

Abstract
Estimating the number of host species that a parasite can infect (i.e. host range) provides key insights into the evolution of host specialism and is a central concept in disease ecology. Host range is rarely estimated in real systems, however, because variation in species relative abundance and the detection of rare species makes it challenging to confidently estimate host range. We applied a non-parametric richness indicator to estimate host range in simulated and empirical data, allowing us to assess the influence of sampling heterogeneity and data completeness. After validating our method on simulated data, we estimated parasite host range for a sparsely sampled global parasite occurrence database (Global Mammal Parasite Database) and a repeatedly sampled set of parasites of small mammals from New Mexico (Sevilleta Long Term Ecological Research Program). Estimation accuracy varied strongly with parasite taxonomy, number of parasite occurrence records, and the shape of host species-abundance distribution (i.e. the dominance and rareness of species in the host community). Our findings suggest that between 20% and 40% of parasite host ranges are currently unknown, highlighting a major gap in our understanding of parasite specificity, host–parasite network structure, and parasite burdens.
Keywords: host specificity, Global Mammal Parasite Database, Sevilleta LTER, species diversity estimation, abundance-based coverage estimator, host breadth
1. Introduction
Species richness—the number of species in an assemblage—is a key feature of any ecological community and central to theories about conservation [1], ecosystem processes [2], community stability [3], and parasite transmission [4]. However, estimates of species richness are largely based on non-exhaustive sampling, which has led to the development of statistical estimators [5] that aim to estimate true diversity by correcting the observed diversity using information contained in the frequency of rare species in samples. The ideal species richness estimator would accommodate for uneven sampling efforts across assemblages, which could allow for species richness estimation at large spatial scales using available observational data [6].
In disease ecology, two metrics analogous to species richness in free-living systems are parasite species richness (number of parasites that can infect a given host species) and host range (the number of host species that a given parasite species can infect) [7,8]. While there have been several efforts to estimate parasite species richness [9–12], few studies have focused on estimating the number of host species infected by a given parasite species (i.e. the number of susceptible host species [13,14]). Estimating the number of host species that are infected by a given parasite species—hereafter ‘host range’—is a crucial step towards identifying host community or parasite traits associated with host specificity [15], which could aid in conservation of host [16] and parasite [17] species. For instance, large differences between observed and estimated host ranges would suggest parasite taxa or geographical areas that could be prioritized for further sampling. Historically, many studies of host specificity estimate host range based solely on observed data, without accounting for potentially unsampled host diversity [18,19], though the role of sampling effort in host range estimation has been acknowledged [11,20]. Recent empirical efforts acknowledge the necessity of addressing incomplete sampling and biases in data, and have used species richness estimators to address host range of helminths [21] and parasitic plants [14].
Estimating host range of a parasite is particularly challenging because heterogeneity exists at three levels: the researcher level, the host community level, and the parasite species level. At the researcher level, sampling biases promote the differential sampling of host and parasite species. This might occur, for instance, in cases of targeted sampling for a particular parasite, or opportunistic sampling of certain easily acquired host species (e.g. examination of roadkill or hunter killed animals). At the host community level, some host species are sampled with low frequency due to their rareness or habitat preferences. For example, terrestrial primates are more commonly sampled than arboreal primates, perhaps because it is easier to follow or capture terrestrial animals [22]. At the parasite species level, variation in parasite infection rates creates variation in infection prevalence among host species. This creates a logistical challenge, as host species that are infected with low probability may easily be missed, especially if the host species is also rare. Some of these issues represent long-standing challenges to estimating free-living species diversity (i.e. sampling biases at the researcher level and insufficient sampling at community level) [23], which has created concern over the application of statistical procedures that assume sampling is random [24–26]. Although many new databases on parasites are available [27–30], they all suffer to some degree from incomplete and variable sampling [31–33]. Thus, it is critically important to develop appropriate methods for using these databases effectively.
Here, we investigate the predictability of parasite host ranges with these three sources of variation implicitly incorporated. We disentangle the effects of data quality and spatial scale by examining two empirical datasets of different spatial resolution, and by subsampling both simulated and empirical data to address the drivers of predictive accuracy. Specifically, we applied statistical techniques originally designed to estimate species richness from geospatial species occurrence data to explore the conditions that enable accurate estimation of parasite host range. First, we assessed estimator performance on simulated data, incorporating variation in the number of parasite occurrences, number of host species (i.e. true host range), and the host species abundance distribution. Next, we applied the method to two empirical datasets that have been collected at different scales: one at the community scale with a fine spatial and temporal resolution (i.e. multi-year, near-exhaustive sampling [34]), and the other at the global scale based on published parasite records on carnivores, primates, and ungulates [29]. We applied species richness estimators to many subsamples of the empirical data to determine the estimability of host range in a limited sample. Recognizing that empirical data are likely not a complete census of possible host species, we estimated host range using all empirical parasite occurrence records, providing an estimate of unsampled host diversity. Lastly, we examined properties of the data that influence parasite host range estimation, including the statistical distribution of sampled host individuals (i.e. the host species abundance distribution), the number of host individuals parasitized, parasite specificity, and parasite taxonomy (e.g. helminths versus viruses). Altogether, we provide cross-validated models of parasite host range, and estimates of unsampled host diversity for a set of over 400 taxonomically diverse parasite species, highlighting a major gap in our understanding of parasite specificity and host–parasite interactions.
2. Material and methods
(a). Species richness estimation
We used the abundance-based coverage estimator (ACE; [35]), a non-parametric asymptotic species richness estimator, to estimate the number of missing species in a sample. The ACE estimator treats host species as samples, differentiating between common and rare species based on the frequency with which a given host species is observed. The cut-off between common and rare species is determined by a value t, where t is typically around 10. However, in many of our simulations, t is much less than 10 and the ACE estimator still performs well.
This method is commonly used in ecology, and has been demonstrated to perform well for many different coverage levels and survey designs [36,37]. Further, the ACE estimator can be used for rarefaction, in which the available data are sampled (host individuals) until the estimator saturates at the predicted number of susceptible host species [14,38], allowing estimation of sampling completeness. Recently, the ACE estimator has been used to estimate the number of likely missing host–parasite associations [39]. Here, we used the ACE estimator for the direct estimation of the number of susceptible host species based on subset data using a combination of simulated data and empirical data, providing cross-validated host range estimates and a robust test of ACE estimator performance.
Model accuracy was quantified using per cent error (PE), defined as the difference between the estimated host range ( ) and the true host range (hp), standardized by the true host range (hp), i.e.
  . Standardization avoids the undesirable effect of inevitably reduced accuracy as host range becomes large (e.g. an estimated host range of 5 when the observed value is 6 is not equivalent in terms of accuracy to a situation where the estimated host range is 50 and the observed host range is 51). PE values close to zero indicate high accuracy, while large positive or negative values indicate overestimation and underestimation of the number of susceptible host species, respectively [40].
While PE provides useful information on the direction and magnitude of departure from the observed host range for a single parasite species, performance for a set of parasite species may be considered by calculating the mean per cent error (MPE; equation (2.1)). However, the average of many simulations may approach zero (i.e. appear to have high accuracy) even if individual parasite species have large negative and large positive PE values. To address this issue, we also report absolute per cent error APE (equation (2.2)) and corresponding mean absolute per cent error (MAPE) for a large set of parasite species. MAPE has a lower bound of 0, while MPE can be negative. For both statistics, values closer to zero indicate greater accuracy. Negative values become possible for MPE if the predicted host range is smaller than the actual host range. This situation occurs when a subset of the available occurrence data are used to estimate host range, and this estimate underestimates the total number of unique host species in the full data.
 |
2.1 |
and
 |
2.2 |
(b). Simulated parasite occurrence data
Data used for richness estimation may come in at least two formats: incidence and abundance data. Incidence data are obtained when the sampling unit is a finite area where only species presence or absence is recorded, while abundance data considers the number of individuals encountered during continuous sampling. Here, we consider host individuals as potential sites for a given parasite, resulting in a sample containing the number of times a parasite infects each host species. This allows us to create a frequency-of-frequencies table, which describes the number of times (j) a parasite was sampled for a number of host species nj (i.e. if a parasite was found to infect two host species 20 times, nj = 2 and j = 20). The ACE estimator described above may be fitted to either incidence or abundance data, providing flexibility to other host–parasite data structures.
To simulate parasite occurrences in a host community, we first assembled the host community. To do this, we sampled occurrences from a set of N host species based on a lognormal distribution (x1, x2, …xN) with a log mean of 2, and a variable standard deviation (0.1–1.1). This distribution is commonly used in community ecology to model the abundance distribution of species in a community [41]. The standard deviation parameter controls the evenness of host abundance across species in the host community, with a lower standard deviation corresponding to greater evenness of parasite occurrences on host individuals. This is important to include in the model because the probability of a given parasite species infecting a given host species is expected to be proportional to the host abundance in the community. To enforce this relationship in simulated data, host species abundances were scaled to be between 0 and 1 ( ), and these normalized values were used as occurrence probabilities for a given parasite (figure 1).
Figure 1.

Conceptual figure depicting the simulation of host–parasite sampling data, where colours represent the number of times a given host–parasite interaction was observed (cooler colours correspond to larger values). For each parasite species P (rows), a subset of host species H (columns) were selected at random to form the host community and corresponding host range (h* values for each P row). Parasite occurrences were then determined by sampling the susceptible host set based on host species relative abundance (top barplot), where species relative abundance is determined initially by drawing host species occurrences from the log-normal distribution. This serves to control the evenness of the host community, which changes the distribution of host relative abundance in the upper panel. (Online version in colour.)
In addition to the effect of host abundance, we allowed variation in parasite specialization by sampling a subset of the host species from the host community (N) to be considered as the susceptible host set (Nh) for a given parasite species (figure 1). From this set of susceptible host species, occurrence records were generated proportional to the scaled host occurrence probabilities (P(xN = 1) values). This corresponds to a situation in which host abundance influences the number of parasite records, as more abundant hosts are more often sampled, but the identity of the susceptible host set itself is not influenced by host species relative abundance. Thus, the actual recorded instances of parasitism—as a researcher would collect in the field—are proportional to the prominence of host species in the community.
Using this simulation approach, we investigated the influence of the number of parasite occurrences (m) and the number of susceptible host species (h) on the accuracy of parasite host range estimation. These two variables (m and h) create a gradient of prediction difficulty, where the most difficult scenario exists when parasite occurrence data (m) are sparse, while the number of susceptible host species (h) is large. We examined the impact of these two variables across wide ranges of parasite occurrence data size (m = [2 − 250]) and number of susceptible host species (h = [2 − 100]). We generated occurrence data and estimated host range for 500 simulated parasite species for each combination of susceptible host species (h) and number of parasite occurrences (m).
The fraction of data used to estimate parasite host ranges likely influences accuracy. In application, incomplete or biased sampling may result in inaccurate host range estimates [42]. To address the role of incomplete sampling, we simulated host–parasite communities as described above, but trained ACE estimators on random partitions of the simulated data (20%, 40%, 60%, and 80%), using these small subsets to estimate the likely host range in the full dataset. To further validate estimates of host range, we explored the influence of incomplete sampling while also considering every combination of parasite occurrence number (m) and susceptible host number (h) as described above; resulting in over 24 000 combinations of m and h for each data partition (e.g. 20% of simulated data).
(c). Empirical host–parasite association data
Parasite host range estimation was only possible for parasites with enough occurrence records and documented host species to create a frequency-of-frequencies table with more than two rows (see [43] for more information). This eliminated some single host parasites, whose host range estimation is impossible, due to the cut-off value for less abundant species (t) being too low to reliably estimate diversity [35]. Under these conditions, we estimated parasite host range using occurrence data for parasites of four mammalian orders: carnivores (n = 167 parasite species), primates (n = 74 parasite species), and the combined group of ungulates (Artiodactyla and Perissodactyla; n = 167 parasite species) as part of the Global Mammal Parasite Database v. 2.0 (GMPD; [29,30]), and for small mammal parasites (n = 40 parasite species) sampled as part of the Sevilleta Long Term Ecological Research (LTER) Program [34]. Single parasite occurrences were common in the GMPD, making host range estimates possible for a fraction of the observed parasite species of carnivores (23% of parasite species), ungulates (22% of parasite species), and primates (19% of parasite species).
We focused on terrestrial mammals, excluding some aquatic host families (i.e. Otariidae, Phocidae, and Odobenidae) and domesticated host species (e.g. Bos taurus) that are prone to sampling biases due to their large ranges, charismatic nature, or economically motivated sampling (e.g. parasites of cattle and other livestock). As a further extension of our work, we included domesticated animals and aquatic host families in a supplemental analysis to test the robustness of our findings to this kind of oversampling of some taxa (see electronic supplementary material, figure S7).
The GMPD and the Sevilleta LTER data represent two extremes of data collection. The GMPD is composed of parasite occurrences from the published literature, producing inherent biases in reporting of parasite occurrences among hosts. For instance, differential study effort on easily sampled hosts or hosts of conservation concern, or on parasites of public health interest (e.g. helminths that infect humans), can introduce bias into the GMPD data. On the other hand, the small mammal parasite data from the Sevilleta LTER consist of a smaller number of potential host species (n = 24) that were sampled more extensively and consistently over time, and a smaller number of parasite species (n = 40) that were identified using established protocols by a team of experts (see [34] for more details). This results in a more even distribution of parasite occurrences among host species (see electronic supplementary material, figure S1) and avoids much of the sampling bias inherent in the GMPD.
To evaluate the qualitative similarity between simulated and empirical data, we visualized parasite species in the empirical data (n = 448 total) along axes of parasite occurrence number (m) and the number of known susceptible host species (h*). Further, we fitted a lognormal distribution to parasite occurrence data for each host, and estimated the standard deviation of the lognormal. Since we standardized our draws from the lognormal distribution between 0 and 1 when we simulated data, the mean of the lognormal fit is uninformative. The standard deviation value, however, provides a link between the accuracy achieved in our simulated data, and the empirical data from both community- (Sevilleta LTER) and global-scale (GMPD) data.
We estimated the susceptible host set of each parasite species in two ways. First, for each parasite, we trained predictive models on 1 000 subsamples of half of the available occurrence data and estimated each parasite's host range on each data subset. This created a range of host range estimates for each parasite, providing a further test of the method relative to simulated data and providing error bounds on host range predictive accuracy. Second, we recognized that the available parasite occurrence data likely do not represent the full host range. To estimate the number of currently unsampled hosts, we trained models using all parasite occurrence data and estimated the total number of susceptible hosts.
For both host range estimation procedures performed on the empirical data, we investigated the impact of parasite taxonomy (i.e. arthropod, bacteria, helminth, protozoa, or virus) and the number of parasite occurrence records on accurate prediction. For the subset data, accuracy for each parasite species was calculated as PE, with MAPE used to investigate differences in accuracy for different parasite taxa. For this analysis, we treated the true host range as what is observed in the empirical data, and the estimated host range to be the subset of the empirical data used to train the model.
3. Results
(a). Performance on simulated data
For model simulations, accuracy of parasite host range estimates was influenced by the number of parasite occurrences (m) and the size of the susceptible host set (h), where parasites with few occurrence values and large potential host ranges were prone to high error in the prediction of missing hosts, shown by dark red in figure 2 corresponding to simulations with limited parasite occurrence data on parasite species with large susceptible host sets. Parasite host range estimates tended to be underestimated in these simulations, while models tended to slightly overestimate the susceptible host set for parasites with lots of available occurrence data and smaller numbers of susceptible host species (electronic supplementary material, figure S1). Host range estimation accuracy increased as a larger subset of data was used to train the model (figure 2; electronic supplementary material, figure S1), while error rates increased as smaller subsets of data were used to train models when data on parasite occurrences were limited and host breadth was large, resulting in underestimation of the true host range (electronic supplementary material, figure S1).
Figure 2.

Host range estimation accuracy, measured as mean absolute per cent error (MAPE; indicated by colour gradient), as a function of the number of parasite occurrences (m; y-axis) and true parasite host breadth (h; x-axis). Panels correspond to the fraction of the parasite occurrence data used for host range estimation. Larger MAPE values (hotter colours) indicate larger error. (Online version in colour.)
The host species abundance distribution, simulated by drawing host abundances from a lognormal distribution, only slightly influenced estimation accuracy of parasite host range (electronic supplementary material, figures S2 and S3). Specifically, host range estimates were marginally less accurate and tended to overestimate the true host range (electronic supplementary material, figure S3) as the standard deviation in the lognormal distribution decreased (corresponding to more even host communities). However, this effect was small compared with the effect of increasing the standard deviation parameter of the lognormal when parasites had large host breadth values, as this resulted in underestimation of the true susceptible host set (electronic supplementary material, figure S3).
(b). Validation on empirical data
Empirical data occupied a region of parameter space in the simulated data that resulted in accurate prediction of parasite host range (figure 3). Further, estimates of mean and standard deviation from lognormal fits to parasite host ranges for carnivores ( ), primates (
 ), ungulates (
 ), and small mammals (
 ) were comparable with those examined in simulations (electronic supplementary material, figure S4).
Figure 3.
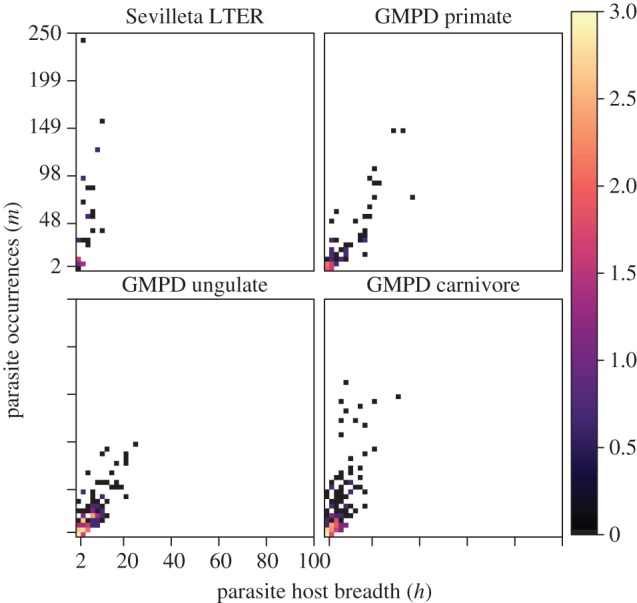
The distribution of parasite species of small mammals in the Sevilleta LTER, and for primates, ungulates, and carnivores in the Global Mammal Parasite Database along axes of the number of parasite occurrences (m; y-axis) and true parasite host breadth (h*; x-axis). The range of m and h* values corresponds directly to the range of conditions of the simulated data (figure 2). The colour legend corresponds to the log-transformed number of parasite species for a given combination of m and h* values. (Online version in colour.)
Model predictions, when trained on only half of the available data, estimated host range fairly accurately (APE < 20%; figure 4; electronic supplementary material). The number of susceptible hosts in the empirical data was consistently within the prediction range generated by training models on different 50% subsets of the empirical data. The accuracy of our approach to host range estimation varied threefold among parasite taxa in terms of absolute PE (figure 4). This suggests that host range estimation varies among parasite taxa, resulting in lower error rates in some parasites (i.e. bacteria and helminths) relative to others (i.e. protozoans and fungi). The number of parasite occurrence records also influenced host range estimation, as accuracy was enhanced for more well-sampled parasites.
Figure 4.

Absolute PE as a function of data source and parasite type. Values closer to 0 correspond to more accurate host range prediction. Error (mean±2 s.e.) tended to be larger for parasites in the Global Mammal Parasite Database. Further, error rates varied based on parasite taxonomy, with viruses and protozoans tending to have larger error than bacteria and helminth parasites. (Online version in colour.)
(c). Estimation of host range
As expected, models trained on all available parasite data suggested that the mean number of unknown host species tends to be smaller (less than 2.2) for parasites of the more consistently sampled Sevilleta LTER small mammals, as compared with host taxa in the more sparsely sampled GMPD, including carnivores ( ), primates (
 ), and ungulates (
 ). Based on estimates of the fraction of the known host range for a given parasite, our findings suggest that approximately 20% of the susceptible host set for parasite species sampled in the Sevilleta LTER effort are currently unknown, compared with around 40% for parasite species in the GMPD (figure 5).
Figure 5.

Estimates for the percentage of unknown hosts (mean±2 s.e.) suggest that many parasites, even those in sparsely populated global databases, may capture the susceptible host set. However, many parasite species had large estimated fractions of unknown hosts, suggesting that the susceptible host set may include many more currently undocumented host species. (Online version in colour.)
4. Discussion
Accurate estimation of parasite host range could enhance our understanding of host–parasite biodiversity and parasite specificity. Estimation of host range can also inform experimental designs attempting to fully census the susceptible host set of a given parasite, which is important in the context of predicting emergence of new infectious agents in humans or threatened species. We applied a non-parametric species richness estimator to simulated and empirical data to investigate whether parasite host range can be accurately estimated, and to identify the situations for which estimates are most accurate. We found that the accuracy of host range estimation is influenced largely by the number of potential susceptible hosts, and marginally by the number of recorded parasite occurrences and variance in the host species-abundance distribution. Estimates for the number of missing hosts for several empirical datasets (global database of parasites of carnivores, ungulates, and primates, and a finely sampled dataset of New Mexican small mammals) vary as a function of sampling scale (e.g. more unsampled host species in the global occurrence database) and parasite taxa (e.g. host ranges for viruses are especially undersampled). From these results, we estimated the current coverage for the host range of 343 parasite species analysed to be around 80%. The identification of the remaining unidentified host species is important for understanding parasite specificity, and to identify which parasites are most likely to spillover to humans [44].
Simulated data offered a way to examine the influence of the amount of parasite occurrence data, host community evenness (i.e. variance in host species-abundance distribution), number of parasite occurrence records, and parasite specificity on host range estimation. In our case, models trained on empirical data had equivalent error rates to those trained on simulated data, suggesting we were able to capture aspects of the empirical data in our simulations. Generalist parasites with few parasite occurrence records had the largest errors in host range estimates, although many of the combinations of parasite specificity and parasite occurrence number that were simulated were never observed in the empirical data. Parasites in the empirical data occupied an area of phase space—in terms of number of parasite occurrences and observed susceptible host range—which our model achieved high accuracy on simulated data.
Our simulations and analyses did not incorporate explicit biases. It is important in this context to emphasize that accurate host range estimation may be difficult for parasites with biased sampling of the susceptible host set or for parasites with pronounced host preferences or few sampled hosts. For instance, parasite infection may alter host behaviour, leading to variation in detection probability as a function of parasite infection. Co-infection creates another challenge because host individuals may serve as habitat for numerous parasite species. Further, parasites with fewer than 50 occurrence values tended to have variable host range estimation accuracy (electronic supplementary material, figure S6), whereas host ranges of parasites with over 100 occurrences were much more accurately predicted. Other biases may largely be accounted for by the non-parametric ACE estimator, which accommodates biased representation of host species in the set of parasite occurrences. However, the somewhat flexible assumption of many of the statistical methods for estimating species richness is that occurrence data represent a random sample, where each different class has some associated probability of being sampled. However, studies that selectively sample for certain parasites may violate this assumption. This bias could explain, in part, the difference in accuracy between the Sevilleta data, which meets the random sample assumption, and the GMPD data, which may or may not (depending on the original source of the data). A related issue concerns the numerous parasite detection protocols, which can further influence known host–parasite associations. Variability in parasite detection as a result of detection approach is certainly present in the GMPD, as host–parasite associations are based on published records, while parasite detection protocols were standardized in the Sevilleta data [34]. Incorporating information on host species sampling effort and developing standardized sampling protocols that enhance parasite detection success will likely improve accurate host range estimation.
It is also important to note that a parasite's host range is not necessarily static, as host range may increase if novel hosts are parasitized as a result of host switching, or host range may decrease with host species extinction, or via the evolution of defences that lead to loss of the parasite or pathogen in a given lineage. Given the considerable lack of information about parasite occurrence, this presents an obstacle to understanding parasite specificity and how it changes through time. The long-term monitoring of host–parasite interactions at local or regional scales is therefore critical for investigating the ecological determinants of parasite host ranges, and to potentially detecting host switching events that serve to expand host ranges, or host extinction events that contract host ranges. Further, the use of genetic techniques for parasite identification can reduce the risk of inflating host range estimates through parasite misidentification. Lastly, the collation and maintenance of parasite occurrence databases [27,29] may provide insight into geographical variation in host range, either as a function of the number of suitable host species in a given area or as a result of geographical variation in parasite specialization. Incorporating geographical space, co-infection dynamics and differential host detectability into simulation models may provide further insight into host range estimation.
In conclusion, the accurate estimation of parasite host range is important for basic and applied aspects of disease ecology. Further, understanding host specificity of a broad range of parasites—including parasitic plants [45], bacterial parasites [46], and animal parasites (this study)—can help identify a trait-basis to host specificity, and address associated questions about host specificity in the presence of limited dispersal and host abundance [47]. Biased sampling of hosts or parasites can lead to inaccurate estimates of parasite specificity, which confounds understanding of the functional and phylogenetic determinants of parasite specificity [48]. Our results also highlight an important issue in parasite community ecology and the study of ecological networks: the predicted fraction of missing, unsampled host species for a set of parasites corresponds to the fraction of unknown interactions in a host–parasite network. Lastly, as parasites with smaller host ranges are likely to be more at risk of going extinct [17], accurate estimation of parasite host range may help prioritize sampling and conservation efforts [49]. These results revealed major gaps in understanding of host range for parasites of mammals, while also highlighting the potential for application of more rigorous approaches incorporating information on host and parasite traits. Future efforts to extend these methods could enable prediction of host range over time or across multiple geographical locations, which could be used to anticipate parasite host shifts or identify a geographical basis for parasite specialization.
Supplementary Material
Acknowledgements
We thank D. Duszyinski for curating the Sevilleta small mammal parasite data, Patrick Stephens and other curators for their work maintaining the GMPD, and the Macroecology of Infectious Disease Research Coordination Network and members of the Drake lab at the University of Georgia for discussions at various stages of the study.
Ethics
The data upon which this study are based are from published records of host–parasite interactions (GMPD), and standardized long-term ecological research efforts (Sevilleta data).
Data accessibility
All data used in this study are available from published sources. The GMPD is available at www.mammalparasites.org and from Stephens et al. [30], and the Sevilleta LTER data are available at sev.lternet.edu/data/sev-13. Code to reproduce the analyses and figures is provided at https://doi.org/10.6084/m9.figshare.5072665.v1.
Author's contributions
T.D., S.H., A.W.P., and J.M.D. designed the study. T.D. and J.M.D. performed the analyses. All authors contributed to manuscript writing.
Competing interests
We declare we have no competing interests.
Funding
This study is supported by the U.S. National Science Foundation Research Coordination Network (NSF/NIH/USDA DEB 131223). S.H. is supported by the Alexander von Humboldt Foundation through a postdoctoral fellowship.
References
- 1.Kerr JT. 1997. Species richness, endemism, and the choice of areas for conservation. Conserv. Biol. 11, 1094–1100. ( 10.1046/j.1523-1739.1997.96089.x) [DOI] [Google Scholar]
- 2.Cardinale BJ, Palmer MA, Collins SL. 2002. Species diversity enhances ecosystem functioning through interspecific facilitation. Nature 415, 426–429. ( 10.1038/415426a) [DOI] [PubMed] [Google Scholar]
- 3.McCann KS. 2000. The diversity–stability debate. Nature 405, 228–233. ( 10.1038/35012234) [DOI] [PubMed] [Google Scholar]
- 4.Keesing F, Holt RD, Ostfeld RS. 2006. Effects of species diversity on disease risk. Ecol. Lett. 9, 485–498. ( 10.1111/j.1461-0248.2006.00885.x) [DOI] [PubMed] [Google Scholar]
- 5.Gotelli NJ, Colwell RK. 2011. Estimating species richness. Biol. Divers. 12, 39–54. [Google Scholar]
- 6.Tittensor DP, Mora C, Jetz W, Lotze HK, Ricard D, Berghe EV, Worm B. 2010. Global patterns and predictors of marine biodiversity across taxa. Nature 466, 1098–1101. ( 10.1038/nature09329) [DOI] [PubMed] [Google Scholar]
- 7.Gorter F, Hall A, Buckling A, Scanlan P. 2015. Parasite host range and the evolution of host resistance. J. Evol. Biol. 28, 1119–1130. ( 10.1111/jeb.12639) [DOI] [PubMed] [Google Scholar]
- 8.Hellgren O, Pérez-Tris J, Bensch S. 2009. A jack-of-all-trades and still a master of some: prevalence and host range in avian malaria and related blood parasites. Ecology 90, 2840–2849. ( 10.1890/08-1059.1) [DOI] [PubMed] [Google Scholar]
- 9.Cooper N, Kamilar JM, Nunn CL. 2012. Host longevity and parasite species richness in mammals. PLoS ONE 7, e42190 ( 10.1371/journal.pone.0042190) [DOI] [PMC free article] [PubMed] [Google Scholar]
- 10.Ezenwa VO, Price SA, Altizer S, Vitone ND, Cook KC. 2006. Host traits and parasite species richness in even and odd-toed hoofed mammals, artiodactyla and perissodactyla. Oikos 115, 526–536. ( 10.1111/j.2006.0030-1299.15186.x) [DOI] [Google Scholar]
- 11.Walther BA, Morand S. 1998. Comparative performance of species richness estimation methods. Parasitology 116, 395–405. ( 10.1017/S0031182097002230) [DOI] [PubMed] [Google Scholar]
- 12.Poulin R. 1998. Comparison of three estimators of species richness in parasite component communities. J. Parasitol. 84, 485–490. [PubMed] [Google Scholar]
- 13.Vesk PA, McCarthy MA, Moir ML. 2010. How many hosts? Modelling host breadth from field samples. Methods Ecol. Evol. 1, 292–299. ( 10.1111/j.2041-210X.2010.00026.x) [DOI] [Google Scholar]
- 14.Watson DM, Milner KV, Leigh A. 2016. Novel application of species richness estimators to predict the host range of parasites. Int. J. Parasitol. 47, 31–39. ( 10.1016/j.ijpara.2016.10.001) [DOI] [PubMed] [Google Scholar]
- 15.Poulin R, Krasnov BR, Morand S. 2006. Patterns of host specificity in parasites exploiting small mammals. In Micromammals and macroparasites (eds Poulin R, Krasnov BR, Morand S), pp. 233–256. Berlin, Germany: Springer. [Google Scholar]
- 16.Farrell MJ, Stephens PR, Berrang-Ford L, Gittleman JL, Davies TJ. 2015. The path to host extinction can lead to loss of generalist parasites. J. Anim. Ecol. 84, 978–984. ( 10.1111/1365-2656.12342) [DOI] [PubMed] [Google Scholar]
- 17.Strona G. 2015. Past, present and future of host–parasite co-extinctions. Int. J. Parasitol. Parasites Wildl. 4, 431–441. ( 10.1016/j.ijppaw.2015.08.007) [DOI] [PMC free article] [PubMed] [Google Scholar]
- 18.Poulin R. 1992. Determinants of host-specificity in parasites of freshwater fishes. Int. J. Parasitol. 22, 753–758. [DOI] [PubMed] [Google Scholar]
- 19.Krasnov BR, Poulin R, Shenbrot GI, Mouillot D, Khokhlova IS. 2005. Host specificity and geographic range in haematophagous ectoparasites. Oikos 108, 449–456. ( 10.1111/j.0030-1299.2005.13551.x) [DOI] [Google Scholar]
- 20.Guégan J-F, Kennedy C. 1996. Parasite richness/sampling effort/host range: the fancy three-piece jigsaw puzzle. Parasitol. Today 12, 367–369. ( 10.1016/0169-4758(96)10054-5) [DOI] [PubMed] [Google Scholar]
- 21.Chaisiri K, Chou M, Siew C, Morand S, Ribas A. 2016. Gastrointestinal helminth fauna of rodents from cambodia: emphasizing the community ecology of host–parasite associations. J. Helminthol. 1, 1–13. ( 10.1017/S0022149X16000869) [DOI] [PubMed] [Google Scholar]
- 22.Cooper N, Nunn CL. 2013. Identifying future zoonotic disease threats where are the gaps in our understanding of primate infectious diseases? Evol. Med. Public Health 2013, 27–36. ( 10.1093/emph/eot001) [DOI] [PMC free article] [PubMed] [Google Scholar]
- 23.Diekmann M, Kühne A, Isermann M. 2007. Random vs. non-random sampling: effects on patterns of species abundance, species richness and vegetation-environment relationships. Fol. Geobot. 42, 179–190. ( 10.1007/BF02893884) [DOI] [Google Scholar]
- 24.Hédl R. 2007. Is sampling subjectivity a distorting factor in surveys for vegetation diversity? Fol. Geobot. 42, 191–198. ( 10.1007/BF02893885) [DOI] [Google Scholar]
- 25.Lepš J. 2007. Subjectively sampled vegetation data: don't throw out the baby with the bath water. Fol. Geobot. 42, 169–178. ( 10.1007/BF02893883) [DOI] [Google Scholar]
- 26.Chiarucci A. 2007. To sample or not to sample? that is the question … for the vegetation scientist. Fol. Geobot. 42, 209–216. ( 10.1007/BF02893887) [DOI] [Google Scholar]
- 27.Gibson D, Bray R, Harris E. 2005. Host-parasite database of the Natural History Museum, London. See www.nhm.ac.uk/researchcuration/scientific-resources/taxonomy-systematics/host-parasites/database/index.jsp.
- 28.Strona G, Lafferty KD. 2012. Fishpest: an innovative software suite for fish parasitologists. Trends Parasitol. 28, 123 ( 10.1016/j.pt.2012.02.001) [DOI] [PubMed] [Google Scholar]
- 29.Nunn CL, Altizer SM. 2005. The Global Mammal Parasite Database: an online resource for infectious disease records in wild primates. Evolut. Anthropol. 14, 1–2. ( 10.1002/evan.20041) [DOI] [Google Scholar]
- 30.Stephens PR, et al. 2017. Global mammal parasite database v. 2.0. Ecology 98, 1476 ( 10.1002/ecy.1799) [DOI] [PubMed] [Google Scholar]
- 31.Yesson C, et al. 2007. How global is the global biodiversity information facility? PLoS ONE 2, e1124 ( 10.1371/journal.pone.0001124) [DOI] [PMC free article] [PubMed] [Google Scholar]
- 32.Boakes EH, McGowan PJ, Fuller RA, Chang-qing D, Clark NE, O'Connor K, Mace GM. 2010. Distorted views of biodiversity: spatial and temporal bias in species occurrence data. PLoS Biol. 8, e1000385 ( 10.1371/journal.pbio.1000385) [DOI] [PMC free article] [PubMed] [Google Scholar]
- 33.Engemann K, Enquist BJ, Sandel B, Boyle B, Jørgensen PM, Morueta-Holme N, Peet RK, Violle C, Svenning J-C. 2015. Limited sampling hampers ‘big data’ estimation of species richness in a tropical biodiversity hotspot. Ecol. Evol. 5, 807–820. ( 10.1002/ece3.1405) [DOI] [PMC free article] [PubMed] [Google Scholar]
- 34.Duszyinski D. 2010. Rodent parasite data for the Sevilleta National Wildlife Refuge, New Mexico (1990–1998). Long Term Ecological Research Network. See 10.6073/pasta/b2f1f0dd39da440d6ee17300c9044989. [DOI]
- 35.Chao A, Lee S-M. 1992. Estimating the number of classes via sample coverage. J. Am. Stat. Assoc. 87, 210–217. ( 10.1080/01621459.1992.10475194) [DOI] [Google Scholar]
- 36.Reese GC, Wilson KR, Flather CH. 2014. Performance of species richness estimators across assemblage types and survey parameters. Glob. Ecol. Biogeogr. 23, 585–594. ( 10.1111/geb.12144) [DOI] [Google Scholar]
- 37.Gotelli NJ, Chao A, Levin S. 2013. Measuring and estimating species richness, species diversity, and biotic similarity from sampling data. In Encyclopedia of biodiversity (ed. Levin S.), vol. 5, pp. 195–211. London, UK: Academic Press. [Google Scholar]
- 38.Watson DM. 2003. The ‘standardized search’: an improved way to conduct bird surveys. Austral Ecol. 28, 515–525. ( 10.1046/j.1442-9993.2003.01308.x) [DOI] [Google Scholar]
- 39.Dallas T, Park AW, Drake JM. 2017. Predicting cryptic links in host-parasite networks. PLoS Comput. Biol. 13, 1–15. ( 10.1371/journal.pcbi.1005557) [DOI] [PMC free article] [PubMed] [Google Scholar]
- 40.Walther BA, Moore JL. 2005. The concepts of bias, precision and accuracy, and their use in testing the performance of species richness estimators, with a literature review of estimator performance. Ecography 28, 815–829. ( 10.1111/j.2005.0906-7590.04112.x) [DOI] [Google Scholar]
- 41.Preston FW. 1962. The canonical distribution of commonness and rarity: part II. Ecology 43, 410–432. ( 10.2307/1933371) [DOI] [Google Scholar]
- 42.Chao A, Chiu C-H. 2016. Nonparametric estimation and comparison of species richness. eLS. 1–11. ( 10.1002/9780470015902.a0026329) [DOI] [Google Scholar]
- 43.Wang J-P, et al. 2011. Species: an R package for species richness estimation. J. Stat. Softw. 40, 1–15. ( 10.18637/jss.v040.i09) [DOI] [Google Scholar]
- 44.Han BA, Kramer AM, Drake JM. 2016. Global patterns of zoonotic disease in mammals. Trends Parasitol. 32, 565–577. ( 10.1016/j.pt.2016.04.007) [DOI] [PMC free article] [PubMed] [Google Scholar]
- 45.Okubamichael DY, Griffiths ME, Ward D. 2016. Host specificity in parasitic plants–perspectives from mistletoes. AoB Plants 8, plw069 ( 10.1093/aobpla/plw069) [DOI] [PMC free article] [PubMed] [Google Scholar]
- 46.Bäumler A, Fang FC. 2013. Host specificity of bacterial pathogens. Cold Spring Harb. Perspect. Med. 3, a010041 ( 10.1101/cshperspect.a010041) [DOI] [PMC free article] [PubMed] [Google Scholar]
- 47.Dick CW, Patterson BD. 2007. Against all odds: explaining high host specificity in dispersal-prone parasites. Int. J. Parasitol. 37, 871–876. ( 10.1016/j.ijpara.2007.02.004) [DOI] [PubMed] [Google Scholar]
- 48.Clark NJ, Clegg SM. 2017. Integrating phylogenetic and ecological distances reveals new insights into parasite host specificity. Mol. Ecol. 26, 3074–3086. ( 10.1111/mec.14101) [DOI] [PubMed] [Google Scholar]
- 49.Dougherty ER, Carlson CJ, Bueno VM, Burgio KR, Cizauskas CA, Clements CF, Seidel DP, Harris NC. 2015. Paradigms for parasite conservation. Conserv. Biol. 30, 724–733. ( 10.1111/cobi.12634) [DOI] [PubMed] [Google Scholar]
Associated Data
This section collects any data citations, data availability statements, or supplementary materials included in this article.
Supplementary Materials
Data Availability Statement
All data used in this study are available from published sources. The GMPD is available at www.mammalparasites.org and from Stephens et al. [30], and the Sevilleta LTER data are available at sev.lternet.edu/data/sev-13. Code to reproduce the analyses and figures is provided at https://doi.org/10.6084/m9.figshare.5072665.v1.