

Abstract
Key points
Although lipid droplets in skeletal muscle are an important energy source during endurance exercise, our understanding of lipid metabolism in this context remains incomplete.
Using transmission electron microscopy, two distinct subcellular pools of lipid droplets can be observed in skeletal muscle – one beneath the sarcolemma and the other between myofibrils.
At rest, well‐trained leg muscles of cross‐country skiers contain 4‐ to 6‐fold more lipid droplets than equally well‐trained arm muscles, with a 3‐fold higher content in type 1 than in type 2 fibres.
During exhaustive exercise, lipid droplets between the myofibrils but not those beneath the sarcolemma are utilised by both type 1 and 2 fibres.
These findings provide insight into compartmentalisation of lipid metabolism within skeletal muscle fibres.
Abstract
Although the intramyocellular lipid pool is an important energy store during prolonged exercise, our knowledge concerning its metabolism is still incomplete. Here, quantitative electron microscopy was used to examine subcellular distribution of lipid droplets in type 1 and 2 fibres of the arm and leg muscles before and after 1 h of exhaustive exercise. Intermyofibrillar lipid droplets accounted for 85–97% of the total volume fraction, while the subsarcolemmal pool made up 3–15%. Before exercise, the volume fractions of intermyofibrillar and subsarcolemmal lipid droplets were 4‐ to 6‐fold higher in leg than in arm muscles (P < 0.001). Furthermore, the volume fraction of intermyofibrillar lipid droplets was 3‐fold higher in type 1 than in type 2 fibres (P < 0.001), with no fibre type difference in the subsarcolemmal pool. Following exercise, intermyofibrillar lipid droplet volume fraction was 53% lower (P = 0.0082) in both fibre types in arm, but not leg muscles. This reduction was positively associated with the corresponding volume fraction prior to exercise (R 2 = 0.84, P < 0.0001). No exercise‐induced change in the subsarcolemmal pool could be detected. These findings indicate clear differences in the subcellular distribution of lipid droplets in the type 1 and 2 fibres of well‐trained arm and leg muscles, as well as preferential utilisation of the intermyofibrillar pool during prolonged exhaustive exercise. Apparently, the metabolism of lipid droplets within a muscle fibre is compartmentalised.
Keywords: electron microscopy, exercise, lipid droplet
Key points
Although lipid droplets in skeletal muscle are an important energy source during endurance exercise, our understanding of lipid metabolism in this context remains incomplete.
Using transmission electron microscopy, two distinct subcellular pools of lipid droplets can be observed in skeletal muscle – one beneath the sarcolemma and the other between myofibrils.
At rest, well‐trained leg muscles of cross‐country skiers contain 4‐ to 6‐fold more lipid droplets than equally well‐trained arm muscles, with a 3‐fold higher content in type 1 than in type 2 fibres.
During exhaustive exercise, lipid droplets between the myofibrils but not those beneath the sarcolemma are utilised by both type 1 and 2 fibres.
These findings provide insight into compartmentalisation of lipid metabolism within skeletal muscle fibres.
Abbreviations
- TEM
transmission electron microscopy
maximum oxygen uptake
Introduction
Cytosolic lipid droplets composed of a lipid core surrounded by a phospholipid monolayer (Martin & Parton, 2006; Fujimoto & Parton, 2011) are no longer considered to be simply inert deposits in adipocytes, but are ubiquitous and dynamic organelles with a variety of functions, including a key role in fatty acid trafficking (Martin & Parton, 2006; Fujimoto & Parton, 2011). Such lipid droplets in skeletal muscle provide a ready source of energy, especially during exercise, with their content being reduced 20–70% following endurance exercise (van Loon, 2004; Shaw et al. 2010).
Quantification of lipid droplets in muscle fibres can be achieved by, for example, biochemical extraction, magnetic resonance spectrometry, histochemical staining with immunofluorescence microscopy, and transmission electron microscopy (TEM) (van Loon, 2004; Kiens, 2006). Indeed, using the TEM method, lipid droplets are observed in two distinct subcellular compartments of a skeletal muscle fibre, namely the intermyofibrillar and subsarcolemmal regions (Crane et al. 2010; Nielsen et al. 2010). In a recent study, Chee and co‐workers (2016) showed that the content of intermyofibrillar, but not subsarcolemmal, lipid droplets was reduced by 40% following a 1 h bout of moderate‐intensity exercise in lean young individuals. Additionally, in the subsarcolemmal region, overweight old individuals had larger lipid droplets than their lean counterparts and the content of these lipid droplets increased following the 1 h exercise (Chee et al. 2016). Interestingly, the size of individual lipid droplets was unchanged, in line with an earlier report that 90 min of moderate‐intensity exercise attenuated the overall content, but not the size, of lipid droplets (Devries et al. 2007). Collectively, these reports imply that a comprehensive understanding of lipid droplet metabolism in skeletal muscle requires detailed analyses of both the subcellular localisation and the size of the lipid droplets.
From the few studies directly comparing arm and leg muscles, it appears that arm muscle is less oxidative metabolically than leg muscle. Blood flow in arm muscles varies more, and when exercising they are less capable of extracting oxygen from the circulation, regardless of training status (Calbet, 2005). Moreover, limited evidence points to a lower fat oxidation in exercising arm muscle when compared to leg muscle (Calbet, 2005; Helge et al. 2008). However, further research is needed to confirm these findings and direct determination of lipid droplet content in arm muscle could provide valuable insights in this regard.
Despite the importance of the arms in sports like swimming, rowing and cross‐country skiing, biological research on the arms is under‐represented and warrants more attention. Moreover, reports comparing the arms and the legs could be confounded if the training status of each limb is not closely matched. Thus, direct comparisons of the highly trained arm and leg muscles of elite cross‐country skiers, can be made unequivocally.
Each mammalian skeletal muscle contains a heterogeneous and distinct mixture of muscle fibres of different fibre types. Phenotypically, type 1 fibres are better equipped than type 2 fibres to utilise lipid substrate for energy metabolism, especially during endurance exercise. Accordingly, type 1 muscle fibres are found to have a greater intramyocellular lipid content (van Loon et al. 2004; De Bock et al. 2005; Shepherd et al. 2012), and the content reduction following prolonged exercise has mainly been observed in type 1 muscle fibres (van Loon et al. 2004; De Bock et al. 2005; Shepherd et al. 2012). Therefore, considering the divergence in lipid metabolism between muscle fibre types, it is essential to discriminate between fibre types when assessing substrate utilisation by skeletal muscle.
By employing quantitative electron microscopy, this study aimed to determine limb‐dependent and fibre type‐dependent subcellular lipid droplet content and distribution in elite cross‐country skiers before and after a 1 h skiing time trial. We hypothesised that at rest the volumes of both intermyofibrillar and subsarcolemmal lipid droplets are higher in leg than in arm muscles, as well as in type 1 than in type 2 muscle fibres. In addition, we predicted that during acute exercise lipid droplets in the intermyofibrillar, but not the subsarcolemmal region would be utilised.
Methods
Ethical approval
The project was approved by the Regional Ethical Review Board in Umeå, Sweden (no. 07–076m). The experiments conformed to the standards set by the Declaration of Helsinki. Prior to giving their written consent to participate, the subjects were fully informed about the project, the risks involved, discomfort associated with the experiments and that they could withdraw from the project at any time.
Subjects
Ten male elite cross‐country skiers participated in the study. Their mean (SD) age, height, weight, maximum oxygen uptake () and haemoglobin concentration were 22 (1) years, 182 (8) cm, 80 (9) kg, 68 (5) ml kg−1 min−1, and 155 (8) g l−1, respectively. Their percentage myosin heavy chain (MHC) isoform compositions (mean (SD)) in the arms and legs were MHC I, 40% (8%), MHC II: 60% (8%), and MHC I, 58% (6%); MHC II, 42% (6%), respectively, as described in detail in a companion paper (Ørtenblad et al., 2011). This study was part of a larger project described in part previously (Nielsen et al. 2011, 2016; Ørtenblad et al. 2011).
Experimental protocol
The skiers were instructed to eat according to their usual intake and not to exercise the day before the time trial. They were provided standard meals the evening prior and in the morning of time trial day. After performing their own warm‐up and ski preparation, the skiers performed a ∼20 km cross‐country skiing time trial (classic style) with an average finishing time of 57 min (range: 52–63 min), with mean (SD) post‐exercise blood lactate level of 10.4 (2.4) mmol l−1. The skiers did not consume any food or fluid during the time trial. Snow conditions and the profile of the course favoured usage of the diagonal stride technique and a high degree of double poling, i.e. upper‐body exercise. The skiers’ values were determined in the laboratory within 2 weeks of the time trial (for further details, see Ørtenblad et al. 2011).
Muscle biopsies
Muscle biopsies were taken from the arm and leg before breakfast of time trial day (Pre) and within 1–2 min after (Post) the time trial. All biopsies were obtained in a randomized order from the left‐ and right‐hand side, with one biopsy in each arm and leg, respectively. All Post biopsies were taken contralateral to the Pre biopsies. Only exercised muscle biopsies were taken as lipid stores in resting muscle are not expected to change (Sacchetti et al. 2004). All biopsies from individual subjects were taken by the same person to minimise any variation in the location and depth of the biopsy. After local anaesthesia (2–3 ml 2% lidocaine (lignocaine)), an incision was made through the skin and fascia and the muscle biopsy was taken from m. vastus lateralis (leg) and the distal part of the lateral head of m. triceps brachii (arm), using a modified Bergström needle with suction. These muscles were preferred because they are highly active during cross‐country skiing (Holmberg et al. 2005). We divided each muscle biopsy into multiple portions for different purposes, including one portion being fixed in glutaraldehyde for transmission electron microscopy analysis. Due to insufficient tissue from a Post leg biopsy, only a total of 39 muscle biopsies were collected from the 10 subjects.
Transmission electron microscopy
Muscle biopsy specimens were prepared for TEM as described previously (Nielsen et al. 2011). In brief, specimens were fixed with 2.5% glutaraldehyde in 0.1 m sodium cacodylate buffer (pH 7.3) for 24 h and subsequently rinsed four times in 0.1 m sodium cacodylate buffer. Subsequently, we post‐fixed muscle specimens with 1% osmium tetroxide (OsO4) and 1.5% potassium ferrocyanide (K4Fe(CN)6) in 0.1 m sodium cacodylate buffer for 90 min at 4°C. After post‐fixation, the muscle specimens were rinsed twice in 0.1 m sodium cacodylate buffer at 4°C, dehydrated through a graded series of alcohol at 4–20°C, infiltrated with graded mixtures of propylene oxide and Epon at 20°C, and embedded in 100% Epon at 30°C. We made ultra‐thin (60 nm) sections (using a Leica Ultracut UCT ultramicrotome) in three depths separated by 150 μm, in order to have more muscle fibres to choose for imaging. The sections were contrasted with uranyl acetate and lead citrate before we examined and captured electron micrographs in a pre‐calibrated Jeol‐1400plus transmission electron microscope (Jeol Ltd, Tokyo, Japan) with a CCD camera (Quemesa, EMSIS GmbH, Münster, Germany).
We made electron micrographs of eight to nine longitudinally oriented muscle fibres per biopsy. From each fibre, 80 electron micrographs were obtained at ×10,000 magnification in a systematic random order, including 40 from the subsarcolemmal region, 20 from the superficial region and 20 from the central region of the myofibrillar space. This was based on the minimal electron micrographs required, whereby no further improvement in the precision of estimating volume by point‐counting could be achieved with additional micrographs. Details on the precision of estimates are provided below. Each electron micrograph covers an area of 5.7 μm by 3.8 μm, which is the minimum interval between micrographs.
Volume fraction estimation
To make robust and unbiased volume estimates of lipid droplets and mitochondria (for fibre‐typing, see below), we used point‐counting techniques, with reference to Cavalieri's principle and the Delesse principle (Weibel, 1979), to estimate areas of mitochondria and lipid droplets in the electron micrographs (Fig. 1). Identification of mitochondria in micrographs was based on previously reported work on mammalian skeletal muscles (Hoppeler et al. 1973). Our criteria for identifying lipid droplets included having a circular white‐greyish appearance with a fuzzy border (absence of distinct membrane) and a minimum diameter of 200 nm.
Figure 1. Transmission electron microscopy and point‐counting of subcellular lipid droplets.
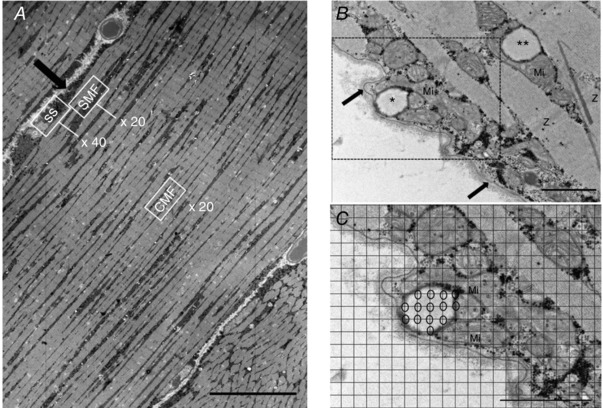
A, acquisition of electron micrographs was systematically randomized to cover the subsarcolemmal (SS), superficial myofibrillar (SMF) and central myofibrillar regions (CMF) of each longitudinally oriented fibre. The arrow indicates the sarcolemma. (original magnification ×600, scale bar: 20 μm). B, subcellular localisations of lipid droplets. The arrow indicates the sarcolemma. C, close‐up view of point‐counting of subsarcolemmal lipid droplet volume fraction with grid (size 135 nm) overlay. The open circles indicate intersections touching a lipid droplet. *, a subsarcolemmal lipid droplet; **, an intermyofibrillar lipid droplet; Mi, mitochondria; Z, Z‐line. (Original magnification ×10,000, scale bar: 1 μm.)
A point grid (135 nm grid size) was overlaid onto each micrograph, generating a total of 1107 points per micrograph for point‐counting. Two subcellular localisations of lipid droplet and mitochondria volume fractions were defined: (i) intermyofibrillar volume fraction and (ii) subsarcolemmal volume fraction. The volume fractions of intermyofibrillar mitochondria and lipid droplets per myofibrillar volume were estimated by point‐counting micrographs from the superficial and central regions of the myofibrillar space. Muscle fibres are assumed to have a cylindrical shape. As the superficial region of a cylinder occupies 3 times more volume than the central region, volume estimates from the superficial myofibrillar space were weighted 3 times more than those from the central myofibrillar space.
The volume fraction of subsarcolemmal lipid droplets and mitochondria per fibre surface area was estimated by point‐counting micrographs from the subsarcolemmal region. We measured the fibre length at the base of the subsarcolemmal region seen in the 40 micrographs. Fibre surface area was calculated as the length of the muscle fibre multiplied by the thickness of the fibre (60 nm).
The volume fractions of total lipid droplets and total mitochondria were computed by adding intermyofibrillar and subsarcolemmal volume fractions per myofibrillar space. The subsarcolemmal volume fraction per myofibrillar space were converted from the subsarcolemmal volume fraction per fibre surface area by multiplying the subsarcolemmal volume fraction per fibre surface area by a factor of 20. Assuming a muscle fibre to be cylindrical with a diameter of 80 nm, the volume beneath a surface area of 1 μm2 is 20 μm3 based on the following formula: V = r × 0.5A where r is fibre radius and A is fibre surface area.
The relative distribution of subcellular lipid droplet volume fractions was calculated after the volume fraction of total lipid droplets was obtained.
The precision of stereological estimates, represented by the estimated coefficient of error (CEest), for the subcellular mitochondrial and lipid droplet volume fractions was calculated as proposed by Howard & Reed (2005). All point‐counting was conducted using a commercial TEM imaging software, iTEM (EMSIS).
Muscle fibre‐typing
We fibre‐typed all muscle fibres before estimating lipid droplet volume fractions. Muscle fibres were categorised as type 1 or 2, based on a distinct differentiation in terms of intermyofibrillar mitochondrial volume fraction and Z‐line width, which was shown to relate to myofibrillar ATPase properties (Sjöström et al. 1982). Intermyofibrillar mitochondrial volume fraction was first plotted against Z‐line width for all the fibres (n = 6–9) obtained from each biopsy. The fibres with the highest intermyofibrillar mitochondrial volume fraction and thickest Z‐line width were categorised as type 1 fibres and vice versa for type 2 fibres (n = 2–3 fibres of each type per biopsy). These fibres were used for point‐counting. Uncategorised fibres (n = 3–5 per biopsy) were put aside. The mean (SD) intermyofibrillar mitochondrial volume percentage and Z‐line width for type 1 fibres were 12.5% (1.7%) and 88 (9) nm, and for type 2 fibres were 7.4% (1.4%) and 77 (8) nm.
Lipid droplet size and number estimations
Lipid droplet size was estimated by measuring and averaging the major and minor diameters of each lipid droplet with the iTEM imaging software. The aspect ratio of the lipid droplets, calculated as (major diameter)/(minor diameter), reflects the ‘length‐to‐width ratio’. The median (IQR) aspect ratio at Pre, 1.31 (1.24–1.36), was not statistically different from the Post value, 1.31 (1.26–1.37).
Lipid droplet numbers were derived by dividing the subcellular lipid droplet volume fraction by the mean individual droplet volume of the respective subcellular localisation. We assumed an individual lipid droplet to be a sphere and its volume was calculated using the formula: V = 4/3πr 3, where r is the radius based on the average of the major and minor diameters of each lipid droplet.
Lipid droplet–mitochondria contact, represented by percentage of lipid droplets in contact with surrounding mitochondria, was estimated by counting the number of lipid droplets located next to (< 15 nm) surrounding mitochondria, out of the total number of whole lipid droplets observable in each electron micrograph.
Point‐counting of mitochondrial content for the purpose of fibre‐typing was conducted by three blinded investigators, where the electron micrographs from the different time points and fibre types were distributed equally between the investigators. Analyses of lipid droplets were conducted by a single blinded investigator. Inter‐investigator and intra‐investigator intraclass correlation coefficients for all analyses were > 0.98.
A total of 14,576 electron micrographs from 190 muscle fibres (95 Pre, 95 Post) were analysed in this study. The median (IQR) CEest for the subsarcolemmal lipid droplet volume fraction was 0.36 (0.26–0.46) at Pre, 0.40 (0.34–0.57) at Post, and for the intermyofibrillar lipid droplet volume fraction it was 0.22 (0.17–0.30) at Pre, 0.27 (0.20–0.40) at Post.
All analyses on lipid droplet volume fraction and numbers were conducted with each observation based on estimates from 2–3 fibres.
Statistical analysis
All interactions or main effects were tested using a linear mixed‐effects model with subjects and time as random effects and with time, limb, fibre type and subcellular location as fixed effects. Variables with skewed distributions were square root‐transformed or log‐transformed before analysis. Non‐parametric Pre–Post comparison and differences across subcellular locations, limbs and fibre types at Pre were tested with lipid droplet–mitochondria contact data. Associations between variables were evaluated using Pearson's correlation coefficient. Values are presented as medians with interquartile range (IQR), unless stated otherwise. Significance level was set at α = 0.05. Statistical analyses were performed using Stata 14 (StataCorp LP, College Station, X, USA) and Prism 6 (GraphPad Software Inc., San Diego, CA, USA).
Results
Subcellular volume fraction of mitochondria at baseline (Pre)
The absolute baseline volume fractions of intermyofibrillar and subsarcolemmal mitochondria are shown in Table 1. When expressed as mitochondrial volume percentage, total mitochondria (i.e. intermyofibrillar and subsarcolemmal) content in arm type 1 and type 2 fibres were 14.4% and 10.2%, respectively, while in leg type 1 and type 2 fibres, values were 12.9% and 7.6%, respectively. The intermyofibrillar and total mitochondrial volume fractions were 10–11% higher in arm than in leg muscles (P < 0.0001). Furthermore, subsarcolemmal mitochondrial volume fraction was 2‐fold higher in arm type 2 fibres than in leg type 2 fibres (P < 0.001), while no difference was found between the limbs in type 1 fibres (P = 0.13).
Table 1.
Subcellular volume fractions of lipid droplet and mitochondria in skeletal muscle at Pre
| Arm | Leg | |||
|---|---|---|---|---|
| Type 1 | Type 2 | Type 1 | Type 2 | |
| Intermyofibrillar lipid droplet volume fraction (μm3 μm−3 myofibrillar space × 103) | 2.1 (1.5–4.3) | 1.3 (0.5–1.6)† | 8.6 (5.0–12.1)** | 3.5 (1.3–6.8)** , † |
| Subsarcolemmal lipid droplet volume fraction (μm3 μm−2 fibre area × 103) | 2.2 (1.2–3.0) | 0.9 (0.0–3.3) | 8.2 (5.6–14.9)** | 10.7 (4.8–17.4)** |
| Total lipid droplet volume fraction (μm3 μm−3 myofibrillar space × 103) | 2.2 (1.6–4.4) | 1.4 (0.5–1.7)†† | 9.3 (5.3–13.0)** | 4.2 (1.9–7.1)**, †† |
| Intermyofibrillar mitochondrial volume fraction (μm3 μm−3 myofibrillar space × 103) | 127 (108–143) | 80 (66–95)††† | 111 (98–125)** | 67 (44–84)**, ††† |
| Subsarcolemmal mitochondrial volume fraction (μm3 μm−2 fibre area × 103) | 440 (295–628) | 366 (240–485)† | 374 (310–436) | 156 (94–258)*, †† |
| Total mitochondrial volume fraction (μm3 μm−3 myofibrillar space × 103) | 144 (132–171) | 102 (84–112)††† | 129 (116–142)** | 76 (48–97)**, ††† |
Values are medians (interquartile range). n = 95 fibres. Limb difference: * P < 0.001; ** P < 0.0001. Fibre type difference: †P = 0.025; ††P < 0.001; †††P < 0.0001.
Subcellular lipid droplet distribution at baseline (Pre)
Volume fraction
The baseline lipid droplet volume fraction, size and density in the different locations are shown in Fig. 2, with the absolute values of the lipid droplet volume fractions shown in Table 1. The intermyofibrillar and total lipid droplet volume fractions were 4‐fold higher in leg than in arm muscles, and the subsarcolemmal lipid droplet volume fraction was 6‐fold higher in leg than in arm muscles (P < 0.0001). Furthermore, the intermyofibrillar (P = 0.0002) and total (P = 0.0003) lipid droplet volume fractions were 3‐fold higher in type 1 fibres than in type 2 fibres, while no difference was found between the fibre types (P = 0.6) in the subsarcolemmal lipid droplet volume fraction.
Figure 2. Baseline subcellular lipid droplet distributions in arm (m. triceps brachii) and leg (m. vastus lateralis) muscle fibres (n = 20 observations).
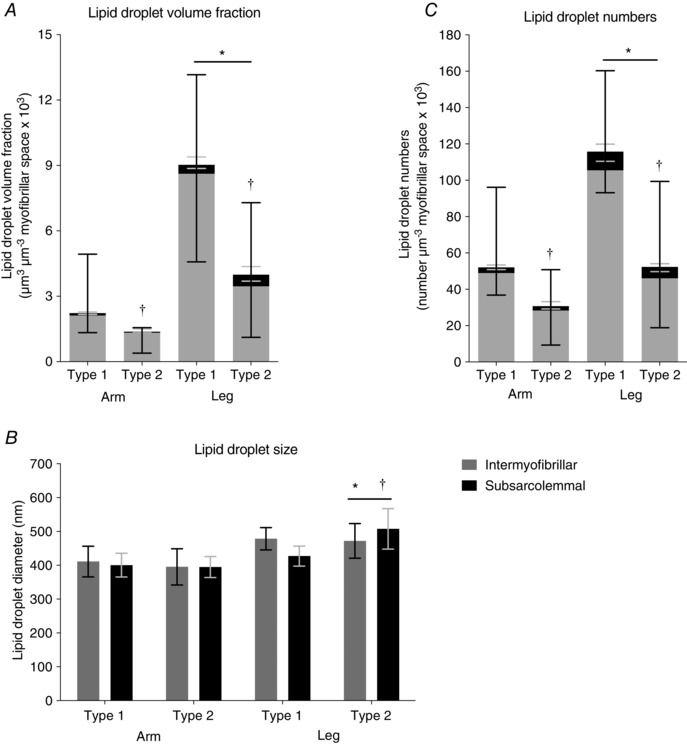
A, subcellular lipid droplet volume fractions. * P < 0.0001 main limb effect in intermyofibrillar and subsarcolemmal regions; †P = 0.0002 main fibre type effect in intermyofibrillar region. B, subcellular lipid droplet size in diameter. * P < 0.001 main limb effect in type 2 fibres; †P = 0.007 main fibre type effect in leg muscle. C, subcellular lipid droplet numbers. * P < 0.0001 main limb effect in intermyofibrillar and subsarcolemmal regions; †P < 0.0001 main fibre type effect in intermyofibrillar region. Bars and lines represent medians with interquartile range (A and C), or means with 95% confidence intervals (B).
In general, the subsarcolemmal lipid droplet volume fractions in type 1 and 2 fibres of the arm, and also in type 1 fibres of the leg, each respectively contributed 3–5% towards the total fibre lipid droplet volume fraction (Table 2). However, the subsarcolemmal lipid droplet volume fraction represented 16% of the total fibre lipid droplet volume fraction in type 2 fibres of the leg, which was 3‐fold higher than type 1 fibres of the leg (P = 0.0001).
Table 2.
Relative distribution of intermyofibrillar and subsarcolemmal lipid droplets in type 1 and 2 human skeletal muscle fibres before (Pre) and after (Post) exercise
| Intermyofibrillar | Subsarcolemmal | |||
|---|---|---|---|---|
| Pre | Post | Pre | Post | |
| Arm | ||||
| Type 1 | 95 (92–97) | 91 (84–93) | 5 (3–8) | 9 (7–16)* |
| Type 2 | 97 (87–100) | 90 (75–94) | 3 (0–13) | 10 (6–25)* |
| Leg | ||||
| Type 1 | 95 (93–97) | 95 (94–97) | 5 (3–7) | 5 (3–6) |
| Type 2 | 85 (65–95) | 91 (80–92) | 16 (5–35)† | 9 (8–20)† |
Values are medians (interquartile range), n = 190 fibres. * P = 0.003 vs. Pre. †P = 0.0001 vs. Leg Type 1.
Lipid droplet size
At baseline, there was no difference in lipid droplet size between the intermyofibrillar and subsarcolemmal regions (Fig. 2 B). However, in type 2 muscle fibres, lipid droplet diameter was found to be 24% larger in the legs than in the arms (P < 0.001), while in type 1 muscle fibres, lipid droplet diameter tended to be 12% larger in the legs than in the arms (P = 0.05). Furthermore, lipid droplet diameter was 8% larger in type 2 than in type 1 fibres (P = 0.007) in leg muscle, but no difference between fibre types was observed in arm muscle.
Lipid droplet numbers
Intermyofibrillar and subsarcolemmal lipid droplet numbers were found to be 59–60% higher in leg than in arm muscles (P < 0.001) (Fig. 2 C). Comparing fibre types in upper and lower limbs, intermyofibrillar lipid droplet numbers were observed to be 68% higher in type 1 than in type 2 fibres (P < 0.0001), while there was no difference between subsarcolemmal lipid droplet numbers (P = 0.2).
Effect of exercise on lipid droplet volume fractions, size and numbers in distinct subcellular locations
Lipid droplet volume fraction
In the arms, the intermyofibrillar lipid droplet volume fraction decreased by 53% across muscle fibre types following exercise (P = 0.0082) (Fig. 3 A), and this decline was positively associated with the intermyofibrillar lipid droplet volume fraction at baseline (Pre) (R 2 = 0.84, P < 0.0001) (Fig. 4). Between fibre types, the reduction in type 1 fibres (58%) tended to be larger than type 2 fibres (51%) (P = 0.09). Although no difference was observed in type 1 fibres (Fig. 3 B), the subsarcolemmal lipid droplet volume fraction in type 2 fibres tended to be 1.5‐fold higher following exercise (P = 0.09). Furthermore, the contribution of the subsarcolemmal lipid droplet volume fraction to the total fibre lipid droplet volume fraction was 2‐fold to 3‐fold higher in both fibre types following exercise (P = 0.0026, Table 2).
Figure 3. Lipid droplet content in intermyofibrillar and subsarcolemmal regions of arm skeletal muscle (m. triceps brachii) before (Pre) and after (Post) approximately 1 h cross‐country skiing time trial.
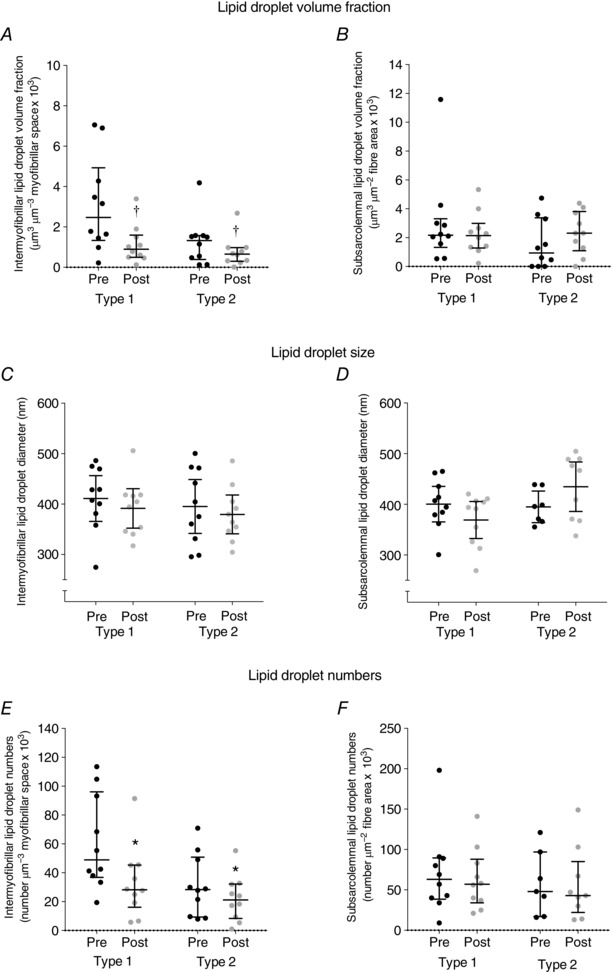
Values were observations (type 1, Pre: n = 10, Post: n = 10; type 2, Pre: n = 10, Post: n = 10) estimated in 2–3 fibres of each fibre type. Pre‐ and post‐exercise intermyofibrillar (A, C and E) and subsarcolemmal (B, D and F) lipid droplet volume fraction (A and B), lipid droplet size (C and D) and lipid droplet numbers (E and F). Lines shown are medians and interquartile range. †P = 0.0082 main time effect. * P = 0.012 main time effect.
Figure 4. The relationship between the volume fraction of intermyofibrillar lipid droplets in arm (m. triceps brachii) skeletal muscle fibres before exercise (Pre) and the subsequent net decline in this parameter following 1 h cross‐country skiing time trial.
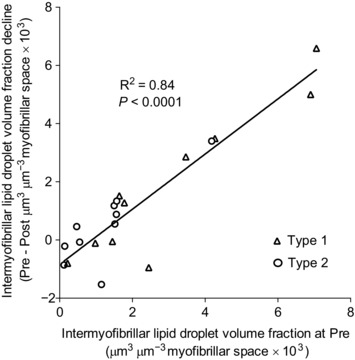
The decline in the volume fraction of lipid droplets was positively associated with the corresponding volume at Pre. The open triangles represent type I fibres (n = 10 observations), and open circles type II fibres (n = 10 observations). The line was fitted linearly.
In leg muscle, no difference in lipid droplet volume fractions was found across localisations following exercise (Fig. 5 A and B). Correspondingly, there was no difference in the relative distributions of the subsarcolemmal lipid droplet volume fraction in leg muscle (Table 2).
Figure 5. Lipid droplet content in intermyofibrillar and subsarcolemmal regions of leg skeletal muscle (m. vastus lateralis) before (Pre) and after (Post) approximately 1 h cross‐country skiing time trial.
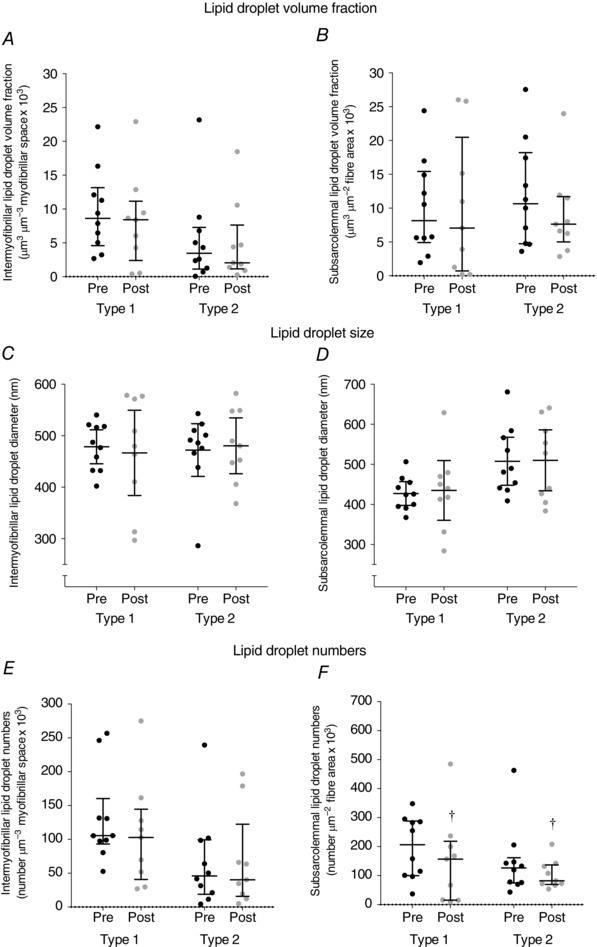
Values were observations (type 1, Pre: n = 10, Post: n = 9; type 2, Pre: n = 10, Post: n = 9) estimated in 2–3 fibres of each fibre type. Pre‐ and post‐exercise intermyofibrillar (A, C and E) and subsarcolemmal (B, D and F) lipid droplet volume fraction (A and B), lipid droplet size (C and D) and lipid droplet numbers (E and F). Lines shown are medians and interquartile range. †P = 0.019 main time effect.
Lipid droplet size and numbers
No difference was observed in lipid droplet size across all localisations in arm and leg muscles prior to and following exercise (Figs 5 C and D and 6).
Figure 6. The diameters of intermyofibrillar and subsarcolemmal lipid droplets in arm (m. triceps brachii) and leg (m. vastus lateralis) skeletal muscle fibres before (Pre) and after (Post) 1 h cross‐country skiing time trial.
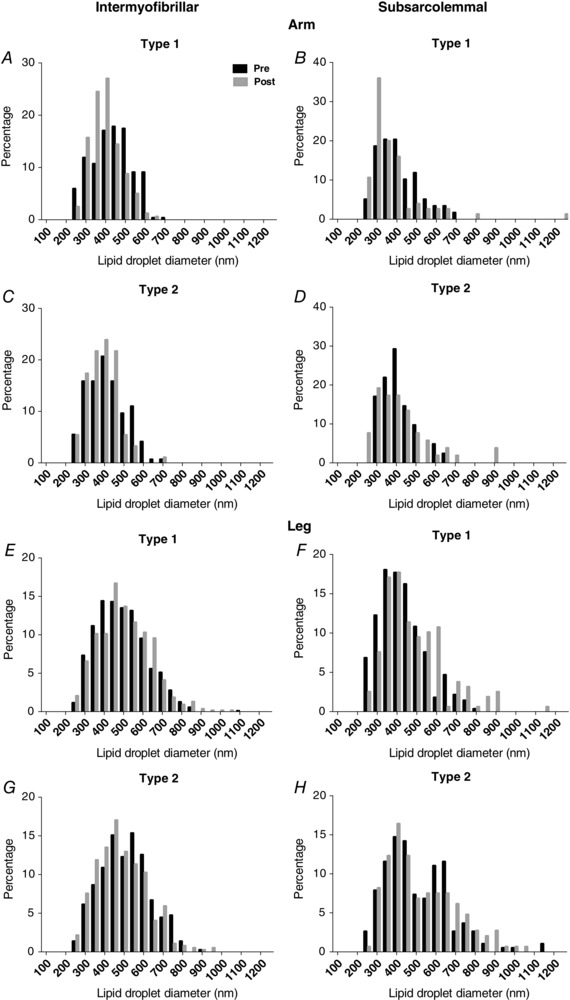
Values were estimated from intermyofibrillar arm (A and C: n = 648) and leg (E and G: n = 2121) lipid droplets, and subsarcolemmal arm (B and D: n = 227) and leg (F and H: n = 771) lipid droplets. There were no significant differences between Pre and Post.
Although there was no difference in subsarcolemmal lipid droplet numbers across fibre types in arm muscle, intermyofibrillar lipid droplet numbers decreased by 36% following exercise (P = 0.012, Fig. 3 E and F). However, the opposite was observed in leg muscle (Fig. 5 E and F), where subsarcolemmal lipid droplet numbers decreased by 31% (P = 0.019), while no difference was found in intermyofibrillar lipid droplet numbers across fibre types following exercise (P = 0.3).
Lipid droplet–mitochondria contact before and after exercise
The proportions of lipid droplets in contact with the surrounding mitochondria across subcellular locations, limbs and fibre types before and after exercise are shown in Table 3. At baseline, no difference was detected at most locations except a higher percentage in the intermyofibrillar than in the subsarcolemmal regions of type 2 fibres in the arms (P = 0.03). No difference was detected following exercise at most locations except a small increase in the intermyofibrillar region of type 1 fibres in the legs (P = 0.02).
Table 3.
Percentage of lipid droplets in contact with mitochondria in type 1 and 2 human skeletal muscle fibres before (Pre) and after (Post) exercise
| Intermyofibrillar | Subsarcolemmal | |||
|---|---|---|---|---|
| Pre | Post | Pre | Post | |
| Arm | ||||
| Type 1 | 83 (75–97) | 86 (72–100) | 67 (50–100) | 71 (50–100) |
| Type 2 | 78 (60–100) | 75 (50–89) | 60 (25–100)* | 67 (50–100) |
| Leg | ||||
| Type 1 | 89 (85–93) | 93 (87–100)† | 81 (67–100) | 90 (75–100) |
| Type 2 | 80 (65–91) | 80 (65–91) | 78 (50–88) | 89 (58–100) |
Values are medians (interquartile range). n = 39–249 lipid droplets (arm) and 147–872 lipid droplets (leg). Wilcoxon's matched‐pairs signed‐rank tests were performed between time points and across subcellular locations, limbs and fibre types at Pre. †P = 0.02 vs. Pre. * P = 0.03 vs. Intermyofibrillar.
Discussion
By leveraging on the high‐resolution characteristics of electron microscopy, we were able to apply stereological techniques to discriminate between intermyofibrillar and subsarcolemmal lipid droplets and semi‐quantitatively estimate the lipid droplet volume fractions in these distinct subcellular locations. Our key observations on highly trained endurance athletes (elite cross‐country skiers) were as follows: (i) at baseline, before exercise, higher volume fractions of both intermyofibrillar and subsarcolemmal lipid droplets were observed in leg muscle than in arm muscle, even though both upper and lower limbs were highly trained; (ii) at baseline, the volume fraction of intermyofibrillar, but not subsarcolemmal, lipid droplets, was higher in type 1 than in type 2 muscle fibres; (iii) in arm muscles, the volume fraction of intermyofibrillar lipid droplets decreased following 1 h of exhaustive exercise, with no change in the subsarcolemmal pool; and (iv) the intermyofibrillar lipid droplets were utilised selectively by both type 1 and 2 fibres, but lipid droplet size appeared not to change.
Limb‐dependent and fibre type‐dependent subcellular lipid droplet differences at baseline
Direct comparisons between arm and leg metabolic profiles may be confounded by an unequal training status of the limbs. However, exercise studies on cross‐country skiers have revealed possible inherent qualitative differences in physiological and metabolic parameters between the limbs (Helge, 2010). Many of these studies have demonstrated a lower fat oxidation in arm than in leg exercises (Calbet, 2005; Helge et al. 2008), a higher lactate release during arm than in leg exercises at equal intensity (Jensen‐Urstad & Ahlborg, 1992), and a different ventilatory response between exercise mostly involving upper body muscle (double poling) and lower body exercise (leg only) of comparable metabolic demand (Calbet, 2005; Holmberg & Calbet, 2007). Furthermore, the fibre type distribution in muscles may be different, with arm muscle having a higher proportion of type 2 fibres (m. triceps brachii) than leg muscle (m. vastus lateralis). Here we examined possible intrinsic limb differences in the metabolic profile, using trained leg and arm muscles, and demonstrate that leg and arm muscles exhibit a clear difference in their lipid droplet volumes and distribution with a 4‐fold higher volume fraction of intermyofibrillar lipid droplets and 6‐fold higher volume fraction of subsarcolemmal lipid droplets in leg than in arm muscles. This is evident in both type 1 and type 2 fibres from highly trained arm and leg muscles. This marked difference in lipid droplet volumes between the limbs could not be fully explained by the training status of the muscles involved, or the different fibre type distribution in the limbs, and it is therefore evident that the limbs have inherently different lipid storage characteristics that are independent of fibre type differences, and as a result a possible difference in metabolic regulation.
In accordance with the long‐held tenet regarding the oxidative capacities of muscle fibre types, the type 1 fibres are considered to be more oxidative than the type 2 fibres in this study, because they are differentiated based on intermyofibrillar mitochondria volume fractions and Z‐line width. Interestingly, while the intermyofibrillar lipid droplet volume fraction was indeed 3‐fold higher in type 1 than in type 2 fibres, the subsarcolemmal lipid droplet pool was not found to be different across fibre types in both upper and lower limbs, indicating that the distribution of lipid droplets in the subsarcolemmal region may not be dependent on the oxidative characteristic of muscle fibres in highly trained individuals. Notably in the legs, the indifferent subsarcolemmal lipid droplet distribution across fibre types could be partly explained by the presence of a second pool of lipid droplets (Fig. 6 H), with diameters of 600–650 nm, which could be regulated differently from the main pool of lipid droplets (∼400 nm diameter). However, more evidence is still needed to verify our observations.
As muscle fibre type discrimination is rarely conducted in studies that have examined ultrastructural features of muscle cells using TEM, the direct comparison of results between this study and others is very much limited. A previous report was identified (Howald et al. 1985) and we could see that the absolute values of baseline total lipid droplet volume fractions estimated in this study (Table 1) are higher than those observed in type 1 (0.0065 cm3 cm−3) and type 2a (0.0027 cm3 cm−3) fibres of young sedentary males in that report. This is probably due to the highly trained status of the cross‐country skiers in this study.
Subcellular lipid droplet volume fraction changes following exercise
As the debate on whether intramuscular lipids serve as an energy source during exercise can be explained by methodological concerns regarding the biochemical extraction of lipids, it is now recognised that there is indeed a substantial decline in intramuscular lipid content following acute exercise (van Loon, 2004; Kiens, 2006; Shaw et al. 2010). Our findings in arm muscle (53% reduction in the volume fraction of intermyofibrillar lipid droplets) are in line with previous studies, including those using immunofluorescence staining and detection of intramuscular lipids, which have reported ∼50–70% reduction, mainly in type 1 muscle fibres, following acute endurance exercise (van Loon et al. 2004; De Bock et al. 2005; Stellingwerff et al. 2007; Shepherd et al. 2012). Importantly, we also showed that lipid droplets located in the intermyofibrillar region were utilised during 1 h of exhaustive exercise, while lipid droplets located in the subsarcolemmal region appeared untouched. This would imply a compartmentalised energy demand for the use of lipid droplets within skeletal muscle fibres during exercise and that the spatial arrangement of lipid droplets dictates their roles in energy metabolism. Moreover, our results are in agreement with a recent study showing that after 1 h of moderate‐intensity cycling by young subjects, the intermyofibrillar lipid content decreased by 40%, while the subsarcolemmal lipid content did not change (Chee et al. 2016). Furthermore, in this study, the magnitude of intermyofibrillar lipid droplet utilisation during exercise was observed to be positively correlated with the amount of intermyofibrillar lipid droplets at baseline, which has also been reported by other studies (Zehnder et al. 2006; Stellingwerff et al. 2007). This implies that a larger lipid droplet pool is associated with higher lipolytic machinery.
It has been speculated that subsarcolemmal mitochondria provide ATP mainly for the requirements of myonuclei and membrane function, while intermyofibrillar mitochondria support ATP production for contracting myofibrils (Hood, 2001). Furthermore, energy‐consuming processes might not be high in the subsarcolemmal region during muscular contractions, as compared to the intermyofibrillar region. Hence, this might explain the utilisation of intermyofibrillar but not subsarcolemmal lipid droplets during exercise in this study.
Lipid droplet size changes following exercise
In general, there was no observed change in lipid droplet size following exercise. Additionally, no large leftward shift (towards smaller diameters) in the diameters of lipid droplets across locations following exercise was present in this study (Fig. 6). This implies that the number of lipid droplets is a more likely factor for the exercise‐induced decline in the volume fraction of intermyofibrillar lipid droplets in arm muscle. This is in line with previous findings. Devries and co‐workers (2007) reported that 90 min of moderate‐intensity cycling led to a decrease in intramuscular lipid content, with concomitant reduction in lipid droplet density but not lipid droplet size in males and females. More recently, intramuscular lipid droplet density in type 1 muscle fibres was found to be decreased by exhaustive knee‐extensor exercise (Prats et al. 2013).
Limb differences in lipid droplet utilisation during exercise
The present study examined the effects of 1 h of cross‐country skiing exercise, which required a varying magnitude of concurrent and alternating upper/lower body movement in a field condition. While clearly there was lipid droplet utilisation in arm muscle, we did not find a corresponding use in leg muscle during exhaustive exercise. It should be noted that a substantial decrease in both arm and leg intramuscular glycogen levels was evident in the same subjects as previously reported by our group (Nielsen et al. 2011), indicating that leg muscles were adequately recruited for the exercise as well. The elite cross‐country skiers have well‐trained arm and leg muscles and if we exclude the influence of inherent limb differences, the absence of lipid droplet volume fraction decline in leg muscle after exercise could be partly explained by laboratory observations made in another group of elite cross‐country skiers during skiing exercise that consisted of diagonal striding and double‐poling phases (van Hall et al. 2003). In that study, plasma fatty acid uptake by arm muscle was found to be low (near zero) during diagonal striding, while there was a consistent plasma fatty acid uptake by leg muscle throughout the whole exercise period, inferring that there was lower plasma fatty acid availability for arm muscle during classic style cross‐country skiing. Furthermore, studies have shown enhanced utilisation of intramuscular lipids during exercise when plasma fatty acid availability is low (Watt et al. 2004; van Loon et al. 2005). Taken together, the leg muscle probably did not have as great a need as arm muscle to utilise subcellular lipid droplets during exercise due to a more consistent energy source from circulating fatty acids.
Fibre‐type‐dependent reduction of lipid droplets following exercise
While other studies had demonstrated that intramuscular lipid decreased predominantly in only type 1 fibres following exercise, we could observe a substantial decline in both type 1 (58%) and type 2 (51%) fibres, with no difference in the relative reduction of lipid droplet content between fibre types. This is most likely due to the very well‐trained type 2 muscle fibres in these elite skiers. Type 2a muscle fibres typically make up more than half of the fibre composition in triceps brachii muscles (Mygind, 1995; Terzis et al. 2006), and both fibre types are heavily recruited when triceps brachii muscles extend the elbows during double poling in classical cross‐country skiing (Holmberg et al. 2005). Moreover, the type 2 fibres of the elite cross‐country skiers in this study are comparatively oxidative, as the mean intermyofibrillar mitochondrial volume percentage (7.4%) is higher than that observed in type 1 and 2 fibres (3.2–5.6%) of untrained individuals (Hoppeler et al. 1973; Bylund et al. 1977). It is also possible that the intense nature of the time trial was able to recruit the type 2 fibres of the skiers to a greater extent than the moderate‐intensity exercise trials used in other studies.
Recent in vitro and human in vivo studies have demonstrated that intracellular lipid droplets are ‘dynamic’ hubs with free fatty acids trafficking between systemic circulation, lipid droplets and mitochondria in different metabolic conditions (e.g. cell starvation) (Kanaley et al. 2009; Rambold et al. 2015). Moreover, intramuscular triacylglycerol (the main constituent of lipid droplets) was reported to have a high turnover rate in post‐absorptive males (Sacchetti et al. 2004). Thus, using the present quantitative electron microscopy method, any absence of a change in lipid droplet content (i.e. volume fraction, size) following exercise would not exclude the presence of fatty acid metabolic flux between systemic circulation, lipid droplets and mitochondria.
Lipid droplet–mitochondria contact following exercise
Higher volume fractions of mitochondria were found, together with higher volume fractions of lipid droplets, in type 1 than in type 2 muscle fibres, indicating a clear distinction in oxidative capacity between muscle fibre types. However, we observed lower volume fractions of lipid droplets in the arm muscles than in the leg muscles, despite higher fractions of mitochondria found in the arm muscles than in leg muscles. This could imply that lipid metabolism is regulated differently in well‐trained arm and leg muscles. Lipid droplets are known to be located close to mitochondria in skeletal muscle (Hoppeler 1986; Vock et al. 1996). This intimacy between lipid droplets and surrounding mitochondria could facilitate substrate supply for oxidative metabolism in the mitochondria. We examined the contact between lipid droplets and the surrounding mitochondria across the different subcellular locations, limbs, fibre types at baseline and following acute exhaustive exercise. However, differences could only be observed between subcellular locations in arm type 2 fibres at baseline and in the intermyofibrillar region of leg type 1 fibres following exercise. Since we observed a clear utilisation of lipid droplets in the arms but not in the legs, the proportion of lipid droplets in contact with the surrounding mitochondria does not seem to correspond to lipid droplet utilisation during exercise in the current study. Indeed, our results are in line with previous findings which did not show an increase in lipid droplet–mitochondria contact following acute exercise despite a reduction in intramyocellular lipid area density in men (Devries et al. 2007). Interestingly, chronic training was demonstrated to be able to increase the contact between the two organelles (Tarnopolsky et al. 2007).
In conclusion, employing quantitative electron microscopy, we demonstrate here that the well‐trained leg muscles of elite cross‐country skiers contain 4‐ to 6‐fold more lipid droplets than the equally well‐trained arm muscles, and that intermyofibrillar but not subsarcolemmal lipid droplets are utilised during exhaustive exercise. Importantly, these findings indicate that the distributions of lipid droplets in the muscles of upper and lower limbs differ, and that the utilisation of lipid droplets depends on their subcellular localisation.
Additional information
Competing interests
The authors declare that they have no competing interests.
Author contributions
The experiments were performed at the Department of Sports Science and Clinical Biomechanics, University of Southern Denmark (muscle analysis, electron microscopy analysis) and Department of Pathology, Odense University Hospital (electron microscopy), and the Swedish Winter Sports Research Centre, Mid Sweden University (exercise and testing). All authors contributed to the conception and design of the experiments, collection and analysis of data. H.C.E.K., J.N., H.C.H. and N.Ø. contributed to the interpretation of data, drafting and/or revision of manuscript, and approval of the final version of manuscript. B.S. passed away on 12 September 2014 before this manuscript was drafted. All authors agree to be accountable for all aspects of the work in ensuring that questions related to the accuracy or integrity of any part of the work are appropriately investigated and resolved. All persons designated as authors qualify for authorship, and all those who qualify for authorship are listed.
Funding
This study was supported by grants from the Danish Diabetes Academy funded by the Novo Nordisk Foundation and the Lundbeck Foundation (R208‐2015‐3220 and R211‐2015‐3223).
Acknowledgements
We thank Karin Trampedach and Susan Bøgebjerg for their excellent technical assistance in transmission electron microscopy.
References
- Bylund AC, Bjurö T, Cederblad G, Holm J, Lundholm K, Sjöstroöm M, Angquist KA & Scherstén T (1977). Physical training in man. Skeletal muscle metabolism in relation to muscle morphology and running ability. Eur J Appl Physiol Occup Physiol 36, 151–169. [DOI] [PubMed] [Google Scholar]
- Calbet JAL (2005). Why do arms extract less oxygen than legs during exercise? Am J Physiol Regul Integr Comp Physiol 289, R1448–R1458. [DOI] [PubMed] [Google Scholar]
- Chee C, Shannon CE, Burns A, Selby AL, Wilkinson D, Smith K, Greenhaff PL & Stephens FB (2016). The relative contribution of intramyocellular lipid to whole body fat oxidation is reduced with age, but subsarcolemmal lipid accumulation and insulin resistance are only associated with overweight individuals. Diabetes 65, 840–850. [DOI] [PMC free article] [PubMed] [Google Scholar]
- Crane JD, Devries MC, Safdar A, Hamadeh MJ & Tarnopolsky MA (2010). The effect of aging on human skeletal muscle mitochondrial and intramyocellular lipid ultrastructure. J Gerontol A Biol Sci Med Sci 65A, 119–128. [DOI] [PubMed] [Google Scholar]
- De Bock K, Richter EA, Russell AP, Eijnde BO, Derave W, Ramaekers M, Koninckx E, Léger B, Verhaeghe J & Hespel P (2005). Exercise in the fasted state facilitates fibre type‐specific intramyocellular lipid breakdown and stimulates glycogen resynthesis in humans. J Physiol 564, 649–660. [DOI] [PMC free article] [PubMed] [Google Scholar]
- Devries MC, Lowther SA, Glover AW, Hamadeh MJ & Tarnopolsky MA (2007). IMCL area density, but not IMCL utilization, is higher in women during moderate‐intensity endurance exercise, compared with men. Am J Physiol Regul Integr Comp Physiol 293, R2336–R2342. [DOI] [PubMed] [Google Scholar]
- Fujimoto T & Parton RG (2011). Not just fat: the structure and function of the lipid droplet. Cold Spring Harb Perspect Biol 3, a004838. [DOI] [PMC free article] [PubMed] [Google Scholar]
- Helge J (2010). Arm and leg substrate utilization and muscle adaptation after prolonged low‐intensity training. Acta Physiol 199, 519–528. [DOI] [PubMed] [Google Scholar]
- Helge J, Damsgaard R, Overgaard K, Andersen J, Donsmark M, Dyrskog S, Hermansen K, Saltin B & Daugaard J (2008). Low‐intensity training dissociates metabolic from aerobic fitness. Scand J Med Sci Sports 18, 86–94. [DOI] [PubMed] [Google Scholar]
- Holmberg H‐C & Calbet JAL (2007). Insufficient ventilation as a cause of impaired pulmonary gas exchange during submaximal exercise. Respir Physiol Neurobiol 157, 348–359. [DOI] [PubMed] [Google Scholar]
- Holmberg H‐C, Lindinger S, Stöggl T, Eitzlmair E & Müller E (2005). Biomechanical analysis of double poling in elite cross‐country skiers. Med Sci Sports Exerc 37, 807–818 [DOI] [PubMed] [Google Scholar]
- Hood DA (2001). Invited review: contractile activity‐induced mitochondrial biogenesis in skeletal muscle. J Appl Physiol 90, 1137–1157. [DOI] [PubMed] [Google Scholar]
- Hoppeler H (1986). Exercise‐induced ultrastructural changes in skeletal muscle. Int J Sports Med 7, 187–204. [DOI] [PubMed] [Google Scholar]
- Hoppeler H, Lüthi P, Claassen H, Weibel ER & Howald H (1973). The ultrastructure of the normal human skeletal muscle. A morphometric analysis on untrained men, women and well‐trained orienteers. Pflugers Arch 344, 217–232. [DOI] [PubMed] [Google Scholar]
- Howald H, Hoppeler H, Claassen H, Mathieu O & Straub R (1985). Influences of endurance training on the ultrastructural composition of the different muscle fiber types in humans. Pflugers Arch 403, 369–376. [DOI] [PubMed] [Google Scholar]
- Howard CV & Reed MG (2005). Unbiased Stereology: Three‐Dimensional Measurement in Microscopy. Bios Scientific Publishers, Oxford, UK. [Google Scholar]
- Jensen‐Urstad M & Ahlborg G (1992). Is the high lactate release during arm exercise due to a low training status? Clin Physiol 12, 487–496. [DOI] [PubMed] [Google Scholar]
- Kanaley JA, Shadid S, Sheehan MT, Guo Z & Jensen MD (2009). Relationship between plasma free fatty acid, intramyocellular triglycerides and long‐chain acylcarnitines in resting humans. J Physiol 587, 5939–5950. [DOI] [PMC free article] [PubMed] [Google Scholar]
- Kiens B (2006). Skeletal muscle lipid metabolism in exercise and insulin resistance. Physiol Rev 86, 205–243. [DOI] [PubMed] [Google Scholar]
- Martin S & Parton RG (2006). Lipid droplets: a unified view of a dynamic organelle. Nat Rev Mol Cell Biol 7, 373–378. [DOI] [PubMed] [Google Scholar]
- Mygind E (1995). Fibre characteristics and enzyme levels of arm and leg muscles in elite cross‐country skiers. Scand J Med Sci Sports 5, 76–80. [DOI] [PubMed] [Google Scholar]
- Nielsen J, Gejl KD, Hey‐Mogensen M, Holmberg H‐C, Suetta C, Krustrup P, Elemans CPH & Ørtenblad N (2016). Plasticity in mitochondrial cristae density allows metabolic capacity modulation in human skeletal muscle. J Physiol 595, 2839–2847. [DOI] [PMC free article] [PubMed] [Google Scholar]
- Nielsen J, Holmberg H‐C, Schrøder HD, Saltin B & Ørtenblad N (2011). Human skeletal muscle glycogen utilization in exhaustive exercise: role of subcellular localization and fibre type. J Physiol 589, 2871–2885. [DOI] [PMC free article] [PubMed] [Google Scholar]
- Nielsen J, Mogensen M, Vind BF, Sahlin K, Hojlund K, Schroder HD & Ørtenblad N (2010). Increased subsarcolemmal lipids in type 2 diabetes: effect of training on localization of lipids, mitochondria, and glycogen in sedentary human skeletal muscle. Am J Physiol Endocrinol Metab 298, E706–E713. [DOI] [PubMed] [Google Scholar]
- Ørtenblad N, Nielsen J, Saltin B & Holmberg H‐C (2011). Role of glycogen availability in sarcoplasmic reticulum Ca2+ kinetics in human skeletal muscle. J Physiol 589, 711–725. [DOI] [PMC free article] [PubMed] [Google Scholar]
- Prats C, Gomez‐Cabello A, Nordby P, Andersen JL, Helge JRW, Dela F, Baba O & Ploug T (2013). An optimized histochemical method to assess skeletal muscle glycogen and lipid stores reveals two metabolically distinct populations of type I muscle fibers. PLoS One 8, e77774. [DOI] [PMC free article] [PubMed] [Google Scholar]
- Rambold AS, Cohen S & Lippincott‐Schwartz J (2015). Fatty acid trafficking in starved cells: regulation by lipid droplet lipolysis, autophagy, and mitochondrial fusion dynamics. Dev Cell 32, 678–692. [DOI] [PMC free article] [PubMed] [Google Scholar]
- Sacchetti M, Saltin B, Olsen DB & van Hall G (2004). High triacylglycerol turnover rate in human skeletal muscle. J Physiol 561, 883–891. [DOI] [PMC free article] [PubMed] [Google Scholar]
- Shaw CS, Clark J & Wagenmakers AJ (2010). The effect of exercise and nutrition on intramuscular fat metabolism and insulin sensitivity. Annu Rev Nutr 30, 13–34. [DOI] [PubMed] [Google Scholar]
- Shepherd SO, Cocks M, Tipton KD, Ranasinghe AM, Barker TA, Burniston JG, Wagenmakers AJM & Shaw CS (2012). Preferential utilization of perilipin 2‐associated intramuscular triglycerides during 1 h of moderate‐intensity endurance‐type exercise. Exp Physiol 97, 970–980. [DOI] [PubMed] [Google Scholar]
- Sjöström M, Angquist KA, Bylund AC, Fridén J, Gustavsson L & Scherstén T (1982). Morphometric analyses of human muscle fiber types. Muscle Nerve 5, 538–553. [DOI] [PubMed] [Google Scholar]
- Stellingwerff T, Boon H, Jonkers RAM, Senden JM, Spriet LL, Koopman R & van Loon LJC (2007). Significant intramyocellular lipid use during prolonged cycling in endurance‐trained males as assessed by three different methodologies. Am J Physiol Endocrinol Metab 292, E1715–E1723. [DOI] [PubMed] [Google Scholar]
- Tarnopolsky MA, Rennie CD, Robertshaw HA, Fedak‐Tarnopolsky SN, Devries MC & Hamadeh MJ (2007). Influence of endurance exercise training and sex on intramyocellular lipid and mitochondrial ultrastructure, substrate use, and mitochondrial enzyme activity. Am J Physiol Regul Integr Comp Physiol 292, R1271–R1278. [DOI] [PubMed] [Google Scholar]
- Terzis G, Stattin B & Holmberg H‐C (2006). Upper body training and the triceps brachii muscle of elite cross country skiers. Scand J Med Sci Sports 16, 121–126. [DOI] [PubMed] [Google Scholar]
- van Hall G, Jensen‐Urstad M, Rosdahl H, Holmberg H‐C, Saltin B & Calbet JAL (2003). Leg and arm lactate and substrate kinetics during exercise. Am J Physiol Endocrinol Metab 284, E193–E205. [DOI] [PubMed] [Google Scholar]
- van Loon LJC (2004). Use of intramuscular triacylglycerol as a substrate source during exercise in humans. J Appl Physiol 97, 1170–1187. [DOI] [PubMed] [Google Scholar]
- van Loon LJC, Thomason‐Hughes M, Constantin‐Teodosiu D, Koopman R, Greenhaff PL, Hardie G, Keizer, HA , Saris WHM & Wagenmakers AJM (2005). Inhibition of adipose tissue lipolysis increases intramuscular lipid and glycogen use in vivo in humans. Am J Physiol Endocrinol Metab 289, E482–E493. [DOI] [PubMed] [Google Scholar]
- van Loon LJC, Koopman R, Stegen JHCH, Wagenmakers AJM, Keizer HA & Saris WHM (2004). Intramyocellular lipids form an important substrate source during moderate intensity exercise in endurance‐trained males in a fasted state. J Physiol 553, 611–625. [DOI] [PMC free article] [PubMed] [Google Scholar]
- Vock R, Hoppeler H, Helgard C, Wu DXY, Billeter R, Weber J‐M, Taylor CR & Weibel ER (1996). Design of the oxygen and substrate pathways. VI. Structural basis of intracellular substrate supply to mitochondria in muscle cells. J Exp Biol 199, 1689–1697. [DOI] [PubMed] [Google Scholar]
- Watt MJ, Holmes AG, Steinberg GR, Mesa JL, Kemp BE & Febbraio MA (2004). Reduced plasma FFA availability increases net triacylglycerol degradation, but not GPAT or HSL activity, in human skeletal muscle. Am J Physiol Endocrinol Metab 287, E120–E127. [DOI] [PubMed] [Google Scholar]
- Weibel ER (1979). Stereological methods. Volume 1: Practical methods for biological morphometry. Academic Press, London. [Google Scholar]
- Zehnder M, Christ ER, Ith M, Acheson KJ, Pouteau E, Kreis R, Trepp R, Diem P, Boesch C & Décombaz J (2006). Intramyocellular lipid stores increase markedly in athletes after 1.5 days lipid supplementation and are utilized during exercise in proportion to their content. Eur J Appl Physiol 98, 341–354. [DOI] [PubMed] [Google Scholar]