

Abstract
Key points
The in situ phenotypic switch of macrophages is delayed in acute injury following irradiation.
The combination of bone marrow transplantation and local muscle radiation protection allows for the identification of a myeloid cell contribution to tissue repair.
PET‐MRI allows monitoring of myeloid cell invasion and metabolism.
Altered cellular composition prior to acute sterile injury affects the in situ phenotypic transition of invading myeloid cells to repair macrophages.
There is reciprocal intercellular communication between local muscle cell compartments, such as PAX7 positive cells, and recruited macrophages during skeletal muscle regeneration.
Abstract
Skeletal muscle regeneration is a complex interplay between various cell types including invading macrophages. Their recruitment to damaged tissues upon acute sterile injuries is necessary for clearance of necrotic debris and for coordination of tissue regeneration. This highly dynamic process is characterized by an in situ transition of infiltrating monocytes from an inflammatory (Ly6Chigh) to a repair (Ly6Clow) macrophage phenotype. The importance of the macrophage phenotypic shift and the cross‐talk of the local muscle tissue with the infiltrating macrophages during tissue regeneration upon injury are not fully understood and their study lacks adequate methodology. Here, using an acute sterile skeletal muscle injury model combined with irradiation, bone marrow transplantation and in vivo imaging, we show that preserved muscle integrity and cell composition prior to the injury is necessary for the repair macrophage phenotypic transition and subsequently for proper and complete tissue regeneration. Importantly, by using a model of in vivo ablation of PAX7 positive cells, we show that this radiosensitive skeletal muscle progenitor pool contributes to macrophage phenotypic transition following acute sterile muscle injury. In addition, local muscle tissue radioprotection by lead shielding during irradiation preserves normal macrophage transition dynamics and subsequently muscle tissue regeneration. Taken together, our data suggest the existence of a more extensive and reciprocal cross‐talk between muscle tissue compartments, including satellite cells, and infiltrating myeloid cells upon tissue damage. These interactions shape the macrophage in situ phenotypic shift, which is indispensable for normal muscle tissue repair dynamics.
Keywords: bone marrow transplantation, inflammation, irradiation, macrophage polarization, muscle damage, radioprotection, regeneration, satellite cells
Abbreviations
- BM
bone marrow
- BMT
bone marrow transplantation
- CSA
cross‐sectional area
- CTX
cardiotoxin
- FACS
fluorescence‐activated cell sorting
- FAP
fibro/adipogenic progenitor
- FSC
forward scatter
- FDG
fluorodeoxyglucose
- GAST
gastrocnemius
- Ly6C
lymphocyte antigen 6 complex, locus C
- MF
macrophage
- MRI
magnetic resonance imaging
- PAX7
paired box 7
- PET
positron emission tomography
- SSC
side scatter
- TA
tibialis anterior
Introduction
The maintenance of skeletal muscle mass and metabolic capacity is critical for human health and quality of life (Wolfe, 2006). Skeletal muscle has distinct metabolic and contractile properties that are influenced by nutrient uptake, microenvironment and physical activity. Age, disuse, fasting and various degenerative diseases alter skeletal muscle mass and function (Walston, 2012; García‐Prat & Muñoz‐Cánoves, 2017; Goljanek‐Whysall et al. 2016). Additionally, a growing number of elderly and cancer patients continue to receive radiation therapy (Zachariah et al. 1997; Peault et al. 2007) even though it has been proposed that radiation is the main factor leading to muscular fatigue and weakness as observed following treatment (Giacalone et al. 2013). However, skeletal muscle has the remarkable ability to regenerate, which it does not only in response to direct trauma but also under normal physiological conditions. Thus, efforts to understand the side effects of radiation on various skeletal muscle tissue compartments are necessary to improve both the treatments and the outcomes during radiation therapy and particularly under states of reduced or limited regenerative capacity. Skeletal muscle regeneration is a collection of highly synchronized processes involving several cellular, molecular and signalling responses. Coordinating inflammation and regeneration is particularly important for efficient repair (ad integrum) following acute injury (Bentzinger et al. 2013).
A chief reason for the lack of better understanding of muscle repair is that skeletal muscle tissue comprises many different cell types, such as satellite cells, fibroblasts, fibro/adipogenic progenitors (FAPs), endothelial and periendothelial cells, mast cells, macrophages (resident and patrolling circulatory monocytes) and T cells, which can all affect the myofibre environment (reviewed in Bentzinger et al. 2013). Any disturbance of these cells’ interactions could disrupt tissue homeostasis and consequently repair. Satellite cells are known to be key regulators of the skeletal muscle compartment (Lepper et al. 2011; Murphy et al. 2011; Sambasivan et al. 2011). These cells are undifferentiated myogenic cells that are found between the sarcolemma and basal lamina, and can fuse to establish new myofibres (Hawke & Garry, 2001). These quiescent cells mature into postmitotic myofibres through specific extracellular signals. Initially these paracrine or autocrine signals result in myoblast expansion followed by pro‐differentiation signals that are required to induce their maturation. The exact nature of such signals is still not clearly defined. Many candidate molecules have been proposed to mediate myoblast differentiation such as IL‐6 (Serrano et al. 2008), insulin growth factors (Tonkin et al. 2015), and more recently growth differentiation factors (Varga et al. 2016b), supporting the notion that a range of factors are involved in this differentiation process. Furthermore, only recently we started to understand which cell types (FAPs and macrophages) are responsible for producing these factors (Arnold et al. 2007; Joe et al. 2010). In the context of muscle regeneration following acute sterile injury, the satellite cells interact primarily with inflammatory and stromal cells, i.e. fibroblasts, pericytes and FAPs (Bentzinger et al. 2013). Importantly, it has been suggested that the cross‐talk between these tissue compartments is crucial both in regulating myoblast expansion and differentiation and regarding the outcome of skeletal muscle regeneration. One approach to studying such processes is to selectively eliminate a particular cellular component.
Previous studies (1) examining the necessity of satellite cells in muscle hypertrophy (Rosenblatt & Parry, 1992, 1993; Rosenblatt et al. 1994; Phelan & Gonyea, 1997; Adams et al. 2002), (2) testing the effect of the host satellite cell niche on donor satellite cell engraftment (Boldrin et al. 2012), and (3) exacerbating the mdx muscle pathology (Wakeford et al. 1991) used γ‐irradiation as a method to ablate satellite cells. Thus, the current understanding is that irradiation can cause a reduction in satellite cell numbers (Olive et al. 1995), which impairs the structure (Darden 1960; Bergstrom & Salmi, 1962) and regeneration capacity of the irradiated muscle (Wakeford et al. 1991; Jurdana et al. 2013). However, it is not known how cross‐talk between satellite cells and other tissue compartments contributes to synchronized repair. At the same time, the field lacks adequate methodology to study and thoroughly delineate the exact nature of such interactions.
A particularly interesting and important aspect of regeneration is the invasion and conversion of circulating inflammatory monocytes into inflammatory macrophages (MFs) and then conversion into repair‐type ones (Arnold et al. 2007; Varga et al. 2016a). Acute muscle injury causes the recruitment of monocytes/macrophages into the damaged area of the muscle and this invasion peaks within the first 2 days after the injury (Tidball, 2005). In the absence of macrophages, muscle regeneration is severely impaired (Arnold et al. 2007; Tidball & Wehling‐Henricks, 2007; Mirza et al. 2009; Wang et al. 2014), highlighting the importance of these cells in the regeneration process. The roles of these immune cells in response to injury are to (1) confine the damage, (2) clear the necrotic debris through phagocytosis, and (3) repair the damage. There are multiple lines of evidence to suggest that macrophages instruct satellite cells to proliferate and differentiate, by secreting cytokines, growth factors and other molecules that regulate the satellite cell pool (Tidball & Villalta, 2010; Mounier et al. 2013; Saclier et al. 2013; Tonkin et al. 2015), including our recent findings that macrophage‐secreted growth and differentiation factor 3 contributes to myoblast fusion (Varga et al. 2016b). This highly dynamic process is characterized by an in situ transition of infiltrating monocytes from an inflammatory (Ly6Chigh) to a repair (Ly6Clow) macrophage phenotype (Varga et al. 2013), which appears to be indispensable for proper regeneration (Wang et al. 2014). It is likely that the microenvironment is driving the inflammatory to repair phenotypic switch, but it still remains to be determined how macrophages make this in situ phenotypic shift. Thus, we hypothesized that there is likely to be a reciprocal communication between local muscle cell populations and macrophages and not only macrophages instructing these cells but vice versa. For example, the presence of and signals from the satellite cells might be required for the invasion and phenotypic shift of macrophages, which is crucial for the outcome of muscle regeneration.
Here, by using cardiotoxin (CTX)‐induced skeletal muscle injury, as an established and highly reproducible in vivo model of acute muscle injury and sterile physiological inflammation (Hardy et al. 2016), combined with (1) irradiation as a means to alter cellular composition prior to injury, (2) bone marrow transplantation with an extended (3 months) recovery period to replenish myeloid cells, (3) in vivo imaging to monitor the myeloid cell phenotypic switch in situ, and (4) focusing on in vivo ablation of a specific muscle cell population (paired box 7 (PAX7) positive cells) as a proof of concept, we show that muscle tissue integrity and cell composition prior to the injury is required for in situ macrophage phenotypic shift and subsequently for proper and complete tissue regeneration. Taken together, our data reveal the existence of a reciprocal cross‐talk between the skeletal muscle tissue and myeloid cells recruited following injury and establish an experimental paradigm suitable to dissect the components of immune cell invasion‐assisted tissue repair.
Methods
Ethical approval
All animal experiments were carried out in accordance with guidelines prescribed by the Institutional Animal Care and Use Committee at Sanford Burnham Prebys Medical Discovery Institute and University of Debrecen, School of Medicine adhering to US, Hungarian (License no.: 21/2011/DEMÁB) and EU regulations, respectively.
Mice
Wild‐type BoyJ (B6.SJL‐Ptprca Pepcb /BoyJ, stock number 002014, The Jackson Laboratory Bar Harbor, ME, USA) and C57BL/6J male control mice were obtained from Charles River Laboratories, Sulzfeld, Germany and bred under specific‐pathogen‐free conditions. Experiments were conducted on adult (2‐ to 6‐month‐old) male mice. All irradiation experiments were performed under anaesthesia in cohorts of 12 animals per experiment. Briefly, mice were anaesthetized with a single intraperitoneal dose of ketamine/xylazine (ketamine 80–100 mg kg−1, xylazine 10–12.5 mg kg−1). Irradiated and bone marrow transplanted mice were maintained in a specific‐pathogen‐free status (autoclaved top filter cages) for the entire course of experimentation, and antibiotics (amoxicillin antibiotic, clavulanic acid, 500 mg/125 mg l−1 of drinking water) were administered in the drinking water for 4 weeks after transplantation to minimize bacterial contamination within the water source and potentially decrease the burden of gastrointestinal bacteria. Irradiated mice were also fed autoclaved rodent chow ad libitum. Animals that undergo irradiation for bone marrow transplantation (BMT) typically lose a considerable amount of weight, only to gain it back relatively quickly after successful transplantation. At our institutions, weight loss of 20% or greater was used as a rationale for killing before the intended experimental endpoint according to the IACUC guidelines. The Pax7CreER/+, Rosa26DTA/+ strain, designated Pax7‐DTA, was generated by crossing Pax7CreER/CreER and Rosa26DTA/DTA strains. Pax7‐DTA pups were genotyped by PCR as previously described (Wu et al. 2006; Nishijo et al. 2009). The tamoxifen‐treated mice were kindly provided by Dr John McCarthy and Dr Charlotte Peterson. When necessary and for tissue collection mice were killed by either isoflurane overdose (adjusted flow rate or concentration to 5% or greater) or CO2 exposure (adjusted flow rate 3 l min−1) in accordance to the University of Debrecen and Sanford Burnham Prebys Medical Discovery Institute's IACUC guidelines.
Bone marrow transplantation
Recipient congenic BoyJ mice (7 weeks old) were irradiated with 9.5 or 11 Gy using a Theratron 780C cobalt unit for the ablation of the recipient bone marrow. The animals to be irradiated were immobilized using a circular cage (mouse pie cage) that could hold up to 11 mice (alert mice). Following the irradiation, isolated bone marrow cells (in sterile RPMI‐1640 medium) flushed out the femur, tibia and humerus from donor C57BL/6J mice were transplanted into the recipient mice by retro‐orbital injection (20 × 106 bone marrow (BM) cells per mouse). This experimental BMT CD45 congenic model allowed us to detect donor, competitor and host contributions in haematopoiesis and repopulation efficiency of donor cells (congenic mice with CD45.1 versus CD45.2). The CD45.1 and CD45.2 contribution was then detected by flow cytometry usually 8–12 weeks following the BMT. In short a cut at the tail tip of the mice provided a drop of blood that was placed into 0.5 ml phosphate‐buffered saline (PBS) + 1% fetal bovine serum + 10 U ml−1 heparin buffer (samples kept on ice). The cells were directly stained by 2 μl mouse anti‐mouse CD45.2‐FITC (clone 104) and 2 μl rat anti‐mouse GR1‐PE (clone RB6‐8C5) antibodies (BD Pharmingen, San Jose, CA, USA) and incubated on ice for 30 min. After two washes with ice‐cold PBS–fetal bovine serum–heparin buffer, we resuspended the cells in 0.5–1 ml BD FACS lysing solution (BD cat no. 349202). We incubated for 5 min at RT then centrifuged the cells (400 g, 5 min, 4°C). We ran the double stained samples on FACS (BD FACS Calibur) and determined the ratio of donor cells. The repopulation was usually over 90% gated on the granulocyte fraction.
Bone marrow transplantation including local radioprotection
An adaptation of the above protocol was used that includes hindlimb lead shielding. The animals to be irradiated were anaesthetized via intraperitoneal injection of ketamine (80 mg kg−1) and xylazine (10 mg kg−1), and placed into a plastic box, with double wall. Water was between the walls, as a scattering medium, in order to get homogeneous dose distribution. Two 5 cm‐high lead blocks were used for protection of one of the legs of the mouse. The blocks were on the poly(methyl methacrylate) shadow tray of the cobalt unit, more than 20 cm distance from the surface of the plastic box, so the air absorbed the Compton electrons from the blocks. The top plate of the box had 5 mm thickness, which is the build‐up region for cobalt energy. The source surface distance (SSD) and source axis distance (SAD) were 80 cm. The beam size was 21 × 21 cm. The activity of the 60Co isotope was about 50 TBq (1350 Ci). Animals are generally irradiated for short periods of time depending on the radioisotope decay charts, amount of irradiation needed, and source of ionizing energy, and in our case the time of irradiation was about 20–30 min (as a function of the given date). Following the irradiation, isolated bone marrow cells from donor C57BL/6J mice were transplanted into the recipient mice by retro‐orbital injection.
Lower body irradiation
As described above, 5 cm‐thick lead shielding blocks were used during irradiation to protect one of the back legs of lightly sedated mice with the exception that this time we focused the radiation field (14.4 cm × 4.8 cm) only in the lower part of their bodies just below the hip, thus minimizing radiation exposure to the rest of the body. The SSD and SAD were kept the same and mice were irradiated with a dose of 11 Gy. The animals were left to recover for 8 weeks after the radiation exposure.
Muscle injury
Mice were anaesthetized with isoflurane (adjusted flow rate or concentration to 1.5%) and 50 μl of cardiotoxin (12 × 10−6 m in PBS) (from Latoxan, Valence, France) was injected in the tibialis anterior (TA) muscle. Muscles were recovered for flow cytometry analysis at day 1 to day 8 post‐injury or for muscle histology at day 8 to day 20 post‐injury.
Histological analysis of muscle regeneration
Muscles were removed and snap frozen in nitrogen‐chilled isopentane (–160°C). Eight‐micrometre‐thick cryosections were cut and stained with haematoxylin–eosin (H&E). For each histological analysis, at least five slides (per condition) were selected where the total regenerative region within the CTX‐injured TA muscle was at least 70%. For each TA, myofibres in the entire injured area were counted and measured. H&E muscle sections were scanned with a Mirax digital slide scanner (3DHISTECH, Budapest, Hungary) and the cross‐sectional area (CSA) was measured with HALO software (Indica Labs, Albuquerque, NM, USA). CSAs for these samples are reported in μm2. Quantitative analysis of necrotic/phagocytic vs. centrally nucleated myofibres was performed using the Panoramic Viewer (3DHISTECH) software and was expressed as a percentage of the total number of myofibres. Necrotic/phagocyted myofibres were defined as pink pale patchy fibres that are invaded by basophil single cells (macrophages).
Immunohistochemistry (frozen sections)
Tissue sections were fixed and permeabilized in ice‐cold acetone for 5 min and blocked for 30 min at 20°C (room temperature) in PBS containing 2% bovine serum albumin (BSA). Tissues were stained for 1 h at room temperature using a primary antibody diluted in 2% BSA. The primary antibodies used for immunofluorescence were rabbit anti‐laminin (L9393 Sigma‐Aldrich, Budapest, Hungary) at a dilution of 1/200, chicken anti‐PAX7 (Developmental Studies Hybridoma Bank, University of Iowa, Iowa City, IA, USA) at a dilution of 1/20, rabbit anti‐Desmin (Abcam 32362, Cambridge, UK) at a dilution of 1/200 and rat anti‐F4/80 (Abcam 6640) at a dilution of 1/200. In all cases, the primary antibody was detected using secondary antibodies (dilution 1/200) conjugated to fluorescein isothiocyanate (FITC; JIR 703‐095‐155) or Cy3 JIR (711‐165‐152). The nuclei were counter‐stained with 0.1–1 μg ml−1 Hoechst. Fluorescence microscopy was performed using a Carl Zeiss Axio Imager Z2 microscope equipped with lasers at 488, 568 and 633 nm. Figures were analysed and assembled using Fiji and Illustrator CS5 (Adobe).
Isolation of macrophages from muscle
The fascia of the TA was removed. Muscles were dissociated in RPMI containing 0.2% collagenase B (Roche Diagnostics GmbH, Mannheim, Germany) at 37°C for 1 h and filtered through a 100 μm and a 40 μm filter. CD45+ cells were isolated using magnetic sorting (Miltenyi Biotec, Bergisch Gladbach, Germany). For FACS, macrophages were treated with Fcγ receptor blocking antibodies and with 10% normal rat serum:normal mouse serum 1:1 mix, then stained with a combination of phycoerythrin‐conjugated anti‐Ly6C antibody (HK1.4, eBioscience, Thermo Scientific, Waltham, MA, USA), allophycocyanin‐conjugated F4/80 antibody (BM8, eBioscience) and FITC‐conjugated Ly6G antibody (1A8, Biolegend, London, UK). Ly6Chigh F4/80low macrophages, Ly6Clow F4/80high macrophages and Ly6Ghigh Ly6Cmed F4/80− neutrophils were quantified. In each experiment, compared samples were processed in parallel to minimize experimental variation. Cells were analysed on a BD FACSAria III sorter and data analysis was performed using BD FACSDIVA and FlowJo V10 software.
RNA isolation
Total RNA was isolated with Trizol reagent according to the manufacturer's recommendation (UD‐GENOMED, Debrecen, Hungary). Twenty micrograms of glycogen (Ambion, Thermo Scientific, Waltham, MA, USA) was added as carrier for RNA precipitation.
RT‐qPCR
Transcript quantification was performed by quantitative real‐time reverse transcription (RT) polymerase chain reaction (PCR) using SYBR Green (Roche Diagnostics GmbH, Mannheim, Germany) assays.
Primer sequences used in transcript quantification are as follows: Pax7 forward 5′‐GGCACAGAGGACCAAGCTC‐3′, Pax7 reverse 5′‐GCACGCCGGTTACTGAAC‐3′. RT‐qPCR results were analysed with the standard ΔC t method and results were normalized to the expression of Rps26.
Small animal PET‐MRI using 18F‐FDG
During the light cycle to minimize muscle activity, C57BL/6 or BoyJ mice were injected with 8.0 ± 0.2 MBq of [18F]fluorodeoxyglucose (18F‐FDG) via the lateral tail vein in 0.2 ml volume. Fifty minutes after 18F‐FDG injection, animals were anaesthetized by 3% isoflurane with a dedicated small animal anaesthesia device and whole body positron emission tomography (PET) scans (10‐min static PET scans) were acquired using the preclinical nanoScan PET/magnetic resonance imaging (MRI) system (Mediso Ltd, Budapest, Hungary). To prevent movement, the animals were fixed to a mouse chamber (MultiCell Imaging Chamber, Mediso Ltd) and positioned in the centre of field of view (FOV). For the determination of the anatomical localization of the organs and tissues, T1‐weighted MRI scans were performed (3D GRE EXT multi‐FOV; TR/TE 15/2 ms; FOV 70 mm; NEX 2). PET volumes were reconstructed using a three‐dimensional ordered subsets expectation maximization (3D‐OSEM) algorithm (Tera‐Tomo, Mediso Ltd). PET and MRI video and images were automatically co‐registered by the PET/MRI instrument's acquisition software (Nucline). Reconstructed, reoriented and co‐registered images were further analysed with InterView™ FUSION (Mediso Ltd) dedicated image analysis software.
PET data analysis
Radiotracer uptake was expressed in terms of standardized uptake values (SUVs). Ellipsoidal 3‐dimensional volumes of interest (VOI) were manually drawn around the edge of the TA and gastrocnemius muscle activity by visual inspection using InterView™ FUSION multi‐modal visualization and evaluation software (Mediso Ltd). The standardized uptake value (SUV) was calculated as follows: SUV = [VOI activity (Bq ml−1)]/[injected activity (Bq)/animal weight (g)], assuming a density of 1 g ml−1
Ex vivo radiotracer uptake studies
Cells were isolated from injured muscles as described above. Live cells for both myeloid CD45+ and non‐myeloid CD45− fractions were selected using FACS based on forward scatter (FSC)/side scatter (SSC) gating and then washed and resuspended in PBS containing 1 mm glucose. The samples were pre‐incubated at 36°C for 10 min at a cell concentration of 1 × 10⁶ ml−1 in PBS and 0.37 MBq ml−1 18F‐FDG was then added to each sample. After the addition of the radioligand, cells were further incubated at 36°C for 50 min and the uptake was terminated by the addition of ice‐cold PBS. The cells were then washed three times with cold PBS and resuspended in 1 ml of cold PBS, and the radioactivity was measured. The tubes were measured in a (Canberra Packard Kft., Budapest Hungary) gamma‐counter for 1 min within the 18F‐sensitive energy window. Decay‐corrected radiotracer uptake was expressed as counts min−1 (106 cells)−1 (cpm). The displayed data are the means ± SD of the results of at least three independent experiments, each performed in triplicate.
Expression data processing and analysis
GSE71155 data sets were loaded into Genespring GX (Agilent Technologies, Santa Clara, CA, USA) software, and multiarray average summarization was carried out. Next, the lowest 5% of the entities with detectable signals were filtered out as not expressed. Duplicate entities, not/poorly annotated transcripts and transcripts reporting inconsistent expression values were also discarded. Further analysis was carried out on the filtered data set based on the RAW expression values. A heat map was generated based on log10‐transformed raw values with the R software (R Foundation for Statistical Computing, Vienna, Austria) package pheatmap. Hierarchical clustering analysis was then applied by Euclidean distance measure and Ward's clustering algorithm, to find correlated genes.
Statistics
All experiments were performed using at least four biological replicates. Student's t test and two‐way ANOVA were performed in GraphPad Prism 6 (GraphPad Software, La Jolla, CA, USA) and P < 0.05 was considered significant (* P < 0.05, ** P < 0.01, *** P < 0.001, **** P < 0.0001). Mean and SEM values are shown in the graphs.
Results
Cardiotoxin‐induced skeletal muscle damage is a robust model of immune cell‐assisted regeneration
We sought to understand the role and contribution of myeloid cells, primarily macrophages and also their interactions during skeletal muscle regeneration. We chose the CTX‐induced skeletal muscle injury model since this model proved to be instrumental for the identification of exogenous mechanisms of muscle regeneration (Chazaud, 2014; Varga et al. 2016a, b) but it is also suitable to study the effect of the regenerating muscle upon myeloid cell activity. The model works as follows: by injecting cardiotoxin (snake venom peptide that acts as a protein kinase C‐specific inhibitor) intramuscularly, we induced homogeneous skeletal muscle damage in the tibialis anterior (TA) muscles. In more than 10 independent experiments, identical morphological changes were observed. Histological analysis by H&E staining demonstrated global myofibre destruction and oedema at days 1 and 2 post‐injury (Fig. 1 A). By day 8 after the injury the overall architecture of the muscle was restored although most regenerated myofibres were smaller and displayed central myonuclei, a known hallmark of recent muscle regeneration (Fig. 1 A). Thus any change in the cellular composition or altered histological features at day 8 post‐injury, indicates perturbations in intracellular communications.
Figure 1. Cardiotoxin induced injury model and dynamic phenotype shift of muscle infiltrating macrophages.
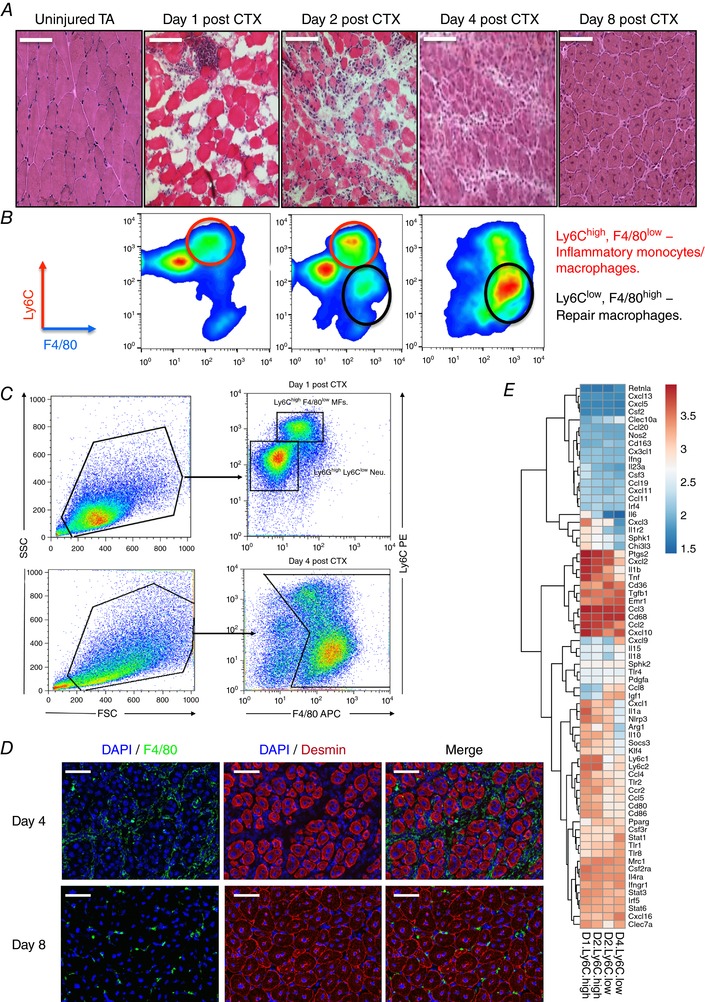
A, tibialis anterior muscles from C57BL/6J mice were injected with CTX and were recovered at various days after injury. Representative H&E‐stained muscle are shown. Scale bars represent 100 μm. B, CD45+ cells isolated from regenerating muscle according to their Ly6C, Ly6G and F4/80 expression. Red circles label inflammatory macrophages (Ly6Chigh F4/80low) and black circles label repair macrophages (Ly6Clow F4/80high). C, FACS gating strategy to enumerate muscle infiltrative macrophages at days 1 and 4 post‐CTX injury. CD45+ cells were gated for an FSC/SSC pattern consistent with monocytic cells, and then percentage of Ly6Chigh F4/80low and Ly6Clow F4/80high MF subsets of all FSC/SSC‐gated cells was calculated. D, immunofluorescence images of regenerating tibialis anterior muscle from a 9‐week‐old wild‐type mouse at day 4 and day 8 after cardiotoxin‐induced injury. The tissue was stained with antibodies directed against the macrophage marker F4/80 (green), the intermediate filament protein desmin (red) and with DAPI (blue) to visualize the cell nuclei. Scale bars represent 100 μm. E, heat map representation of the expression pattern of pro‐inflammatory and anti‐inflammatory markers by muscle‐derived Ly6Chigh and Ly6Clow macrophages at days 1, 2 and 4 post‐CTX injury (GEO: GSE71155). Hierarchical clustering was performed to find correlate genes.
Upon CTX injury a large number of circulating immune cells infiltrate and accumulate in a rapid and highly ordered manner inside the injured tissue. This pool of invading cells consists primarily of neutrophils, monocytes and macrophages. More specifically, after acute injury Ly6Chigh F4/80low monocytes infiltrate early at day 1 to promote the clearance of necrotic debris, whereas Ly6Clow F4/80high macrophages emerge later through a phenotypic shift (Varga et al. 2013) starting at day 2 and completed by day 4, to assist tissue healing (Fig. 1 B and C). To complement these results, F4/80high expressing macrophage localization was assessed using immunohistochemistry from injured muscles at days 4 and 8 after CTX (Fig. 1 D). Furthermore, it was shown that Ly6Chigh macrophages express tumour necrosis factor α (TNFα) and interleukin (IL)‐1β at higher levels and transforming growth factor β (TGF‐β) and IL‐10 at lower levels compared to Ly6Clow macrophages (Perdiguero et al. 2011; Wang et al. 2014). Therefore, they were considered as pro‐inflammatory and anti‐inflammatory macrophages, respectively. However, we recently reported (Varga et al. 2016a) that Gr1+ and Gr1− muscle‐derived macrophages do not display, in general, high differential expression levels of pro‐inflammatory (M1) or anti‐inflammatory (M2) markers. In line with our previous report, re‐analysing more recent publicly available data sets (Varga et al. 2016a), which were obtained using our FACS gating strategy (Fig. 1 B), and by performing hierarchical clustering on a large number of known macrophage marker genes, we report expression patterns with modest differences (Fig. 1 E). Out of 69 markers we looked at, only 14 followed the expected pattern based on the M1–M2 axes, among them CD80, CD86, Nlrp3, Ccr2, Irf4, Emr1, Igf1, Pparg and Clec10a. In addition, the repair macrophages (Ly6Clow) exhibited minimal expression of the well‐established M2 marker CD163, which is in agreement with recent studies (Wang et al. 2014), while others such as Mrc1 and CD68 were highly expressed but remained unchanged between the different muscle macrophage subtypes. These results show that Ly6Chigh and Ly6Clow macrophages in regenerating muscle display distinct inflammatory profiles from those described in the literature in vitro or from the M1/M2 macrophage subtype classification and thus cannot be defined as canonical M1 or M2 macrophages. These findings support the notion that surface markers for macrophage subsets vary depending on the injury model and tissue they are extracted from.
However, the importance and regulation of the phenotypic shift to repair macrophages and the influence of the local muscle environment, including the satellite cell pool, prior to an acute insult to these are not known. Therefore we decided to look at the influence of satellite cell depletion on this process.
The satellite cell pool is radiation sensitive and is required for proper muscle regeneration
We sought first to validate whether muscle regeneration is indeed impaired in irradiated muscles (Wakeford et al. 1991), and second whether this effect is due to diminished satellite cell populations (Barton‐Davis et al. 1999; Caiozzo et al. 2010). The radiation dose we chose was 11 Gy because it has been reported that C57BL/6J mice can tolerate radiation doses of 10–11 Gy (Duran‐Struuck et al. 2008). We used a method, which we termed lower body irradiation, in which mouse hindlimbs were irradiated and left to recover for 8 weeks after the radiation exposure (for details see methods). For this method non‐irradiated and radioprotected (irradiated but simultaneously lead shielded) muscles served as control. Note that the irradiated and radioprotected control belonged to the same animal. TA muscles were then injured with CTX, and analysed 8 days later using histology and morphometry. Importantly, muscle regeneration in the irradiated muscles was severely impaired, even after 2 months post‐irradiation, in comparison to control non‐irradiated or radioprotected muscles as shown by histological analysis (Fig. 2 A). This impairment can also be illustrated by a significant shift to the left of the distribution of the myofibre CSA (Fig. 2 B), a decrease in the mean CSA of regenerating myofibres (−46%, P < 0.0001; Fig. 2 B right panel) and a dramatic increase in necrotic fibres (Fig. 2 C). Macroscopically one could observe more than 35% reduction in the mass of the irradiated muscles compared to the contralateral radioprotected muscles of the same animals and also compared to age‐ and weight‐matched non‐irradiated control animals of the same genetic background (Fig. 3 A). The fact that we observe differences even after 2 months post‐irradiation is an important feature of the experimental set‐up because in this way one can avoid any short‐term effects of irradiation‐induced toxicity.
Figure 2. Diminished satellite cell number in radiation‐exposed muscles impairs skeletal muscle regeneration.
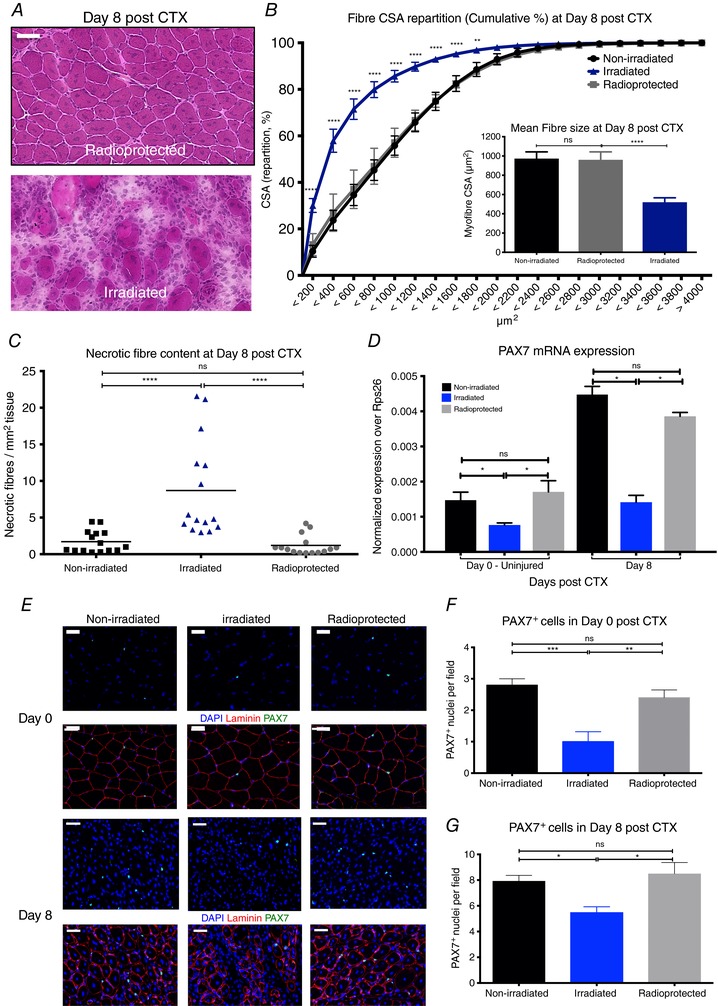
A, representative images of H&E‐stained TA muscles from 11 Gy irradiated and radioprotected muscles at day 8 post‐CTX‐induced injury. Scale bars represent 100 μm. B, myofibre CSA repartition (cumulated) and mean CSA (right panel) in control non‐irradiated, irradiated and radioprotected animals at day 8 post‐CTX injury (n = 8 per group). C, the ratio of phagocytic and/or necrotic fibre area relative to the regeneration area (in mm2) at day 8 post‐CTX injury in control non‐irradiated, irradiated and radioprotected muscle sections (n = 8 per group). D, mRNA expression (±SD) of satellite cell lineage marker, Pax7, in control non‐radiated, irradiated and radioprotected muscles at day 0 (uninjured) and day 8 post‐CTX injury (n = 5 for each group). E, representative images from immunohistochemical detection of lamimin (red), PAX7 (green) and nuclei (blue) from control non‐radiated, irradiated and radioprotected muscles at day 0 (upper panel) and day 8 (lower panel) post‐CTX injury. Scale bars represent 50 μm. F, PAX7+ cell quantification (PAX7 positive cells per field of view) in control non‐radiated, irradiated and radioprotected muscles at day 0 post‐CTX injury. G, PAX7+ cell quantification (PAX7 positive cells per field of view) in control non‐radiated, irradiated and radioprotected muscles at day 8 post‐CTX injury. In all graphs, mean values ± SEM are shown.
Figure 3. Delayed phenotypic transition of infiltrating myeloid cells in irradiated animals following CTX injury.
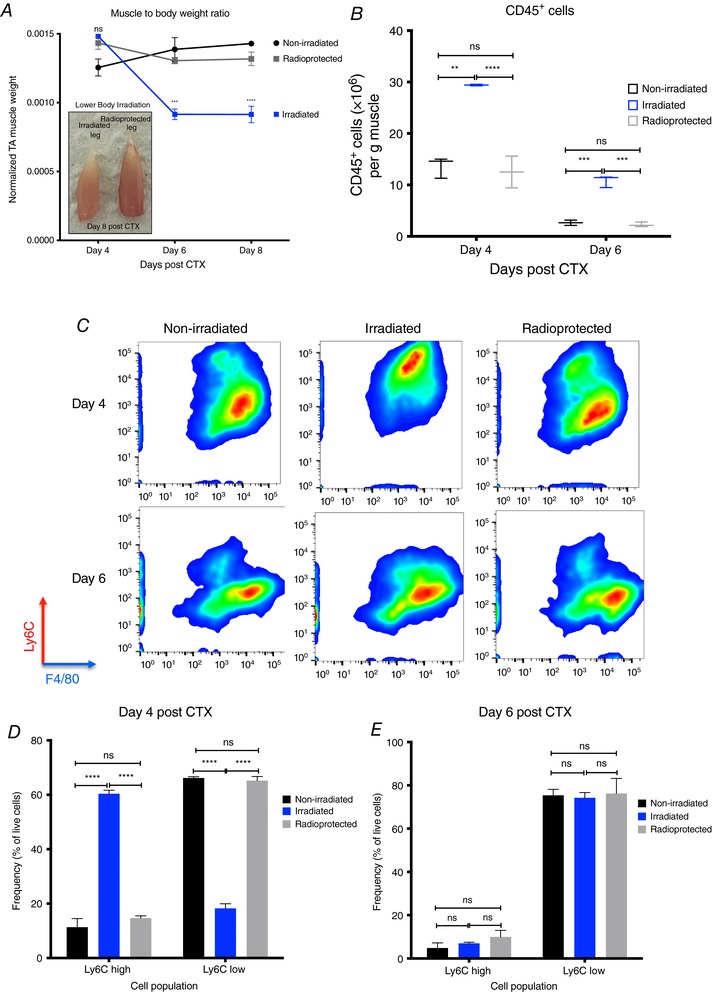
A, normalized TA muscle weight to body weight ratio from irradiated and radioprotected animals at indicated time points following CTX injury (n = 4 per group). Left panel shows representative macroscopical images of recovered irradiated and radioprotected animals and muscles at day 8 post‐CTX injury. B, number of infiltrating myeloid (CD45+) cells in regenerating muscle from control non‐irradiated, irradiated and radioprotected muscles at day 4s and 6 post‐CTX injury (n = 8 muscles per group). C, representative FACS images of inflammatory and repair macrophages from control non‐irradiated, irradiated and radioprotected muscles at days 4 and 6 post‐CTX injury. D, percentage of inflammatory (Ly6Chigh F4/80low) and repair (Ly6Clow F4/80high) MFs from control non‐irradiated, irradiated and radioprotected muscles at day 4 following CTX injury (n = 8 mice per group). E, percentage of inflammatory (Ly6Chigh F4/80low) and repair (Ly6Clow F4/80high) MFs from control non‐irradiated, irradiated and radioprotected muscles at day 6 following CTX injury (n = 8 mice per group). In all graphs, mean values ± SEM are shown.
To assess the effect of irradiation on the local muscle cell pool and more specifically on the satellite cell pool, we measured the mRNA expression of a commonly used marker, Pax7 (von Maltzahn et al. 2013), via qPCR and validated PAX7 through immunohistochemistry. Our data show that indeed Pax7 (Fig. 2 D) mRNA expression is decreased in the irradiated muscles compared to controls and radioprotected muscles at 8 weeks following irradiation. Interestingly, this effect is evident in both injured (day 8 post‐CTX) and uninjured irradiated muscles (day 0). Furthermore, PAX7 staining revealed fewer PAX7+ cells in the irradiated muscles (Fig. 2 E) both at day 0 (Fig. 2 E and F) and day 8 post‐CTX injury (Fig. 2 E and G). Radioprotected muscles served as control and showed similar numbers of PAX7+ cells to non‐irradiated control muscles. These results suggest that PAX7+ satellite cells are indeed radiosensitive and are likely to be the major cause of the muscle regeneration deficiency observed in irradiated muscles.
Delayed phenotypic transition of myeloid cells in irradiated muscles following CTX injury
Next, we asked whether the impaired muscle integrity, and the altered cellular composition induced by irradiation prior to an acute injury, would have any effect on the cellular dynamics of the myeloid cell infiltrate during muscle regeneration (even after 2 months post‐irradiation). Hence, we injected both TA muscles of irradiated mice with CTX and the myeloid cells were isolated at days 4 and 6 after the injury using CD45+ magnetic bead selection. Interestingly, we found a statistically significant increase in the numbers of invading myeloid cells (CD45+) in the irradiated versus radioprotected muscles at both time points (Fig. 3 B), thus excluding the possibility of a massively diminished myeloid cell invasion contributing to the muscle regeneration impairment we observed in Fig. 2 A.
However, this finding did not exclude the possibility of a change in the cellular composition and differentiation of the infiltrating myeloid cells. Therefore, we examined the dynamics of the infiltrating myeloid cell populations during the course of the regeneration period in irradiated and radioprotected muscles (Fig. 3 C). At day 4 post‐CTX, the ratio of Ly6Chigh F4/80low and Ly6Clow F4/80high macrophages in injured muscle between irradiated versus non‐radiated or radioprotected controls showed remarkable differences (Fig. 3 C and D). Normally, in an uncompromised tissue, by day 4 after CTX injury, Ly6Chigh inflammatory macrophages are progressively differentiating into Ly6Clow repair macrophages (Fig. 1 B). This was the case for non‐irradiated and radioprotected controls (Fig. 3 C and D). Surprisingly, in the case of irradiated muscles, this shift started later and was completed only by day 6 (Fig. 3 C–E). In summary, we observed a remarkably long 2‐day delay (in the context of an 8‐day regeneration process) in the phenotypic transition of infiltrating myeloid cells in the irradiated muscles. In addition, this also showed that radioprotection (in the form of lead shielding) during irradiation exposure prevented the delay of muscle regeneration following CTX injury, by preserving the local muscle cell composition and by maintaining the infiltrating myeloid cell kinetics. However, we reached the limit of this method because we were unable to differentiate between the BM‐derived and the tissue‐resident macrophages as the source of the infiltration.
Bone marrow transplantation allows establishing the source of myeloid cell invasion and phenotypic shift
In order to control the source of the infiltrating cells (BM‐derived), and to exclude the possibility that the restoration of the infiltration dynamics in the radioprotected muscles is due to the protection of the resident tissue macrophages, we performed bone marrow transplantation (BMT). This method allowed us to investigate whether the infiltrating myeloid cells in both the radioprotected and irradiated muscles share the same features, and originate from the donor C57BL/6J bone marrow (CD45.2 positive). We used C57BL/6 congenic mice (BoyJ), which carry a differential CD45 pan leukocyte marker (CD45.1), compared to WT C57BL/6J inbred mice that express the CD45.2 allele allowing discrimination between donor and recipient BM‐derived cells. After a radiation dose of 11 Gy, animals were transplanted with C57BL/6J bone marrows (BM) and left to recover for 8 weeks after the BMT. It is important to note that total body irradiation precedes BMT thus providing a unique opportunity to combine irradiation‐induced cell ablation and myeloid cell tracing. TA muscles were then injured with CTX, and analysed 8 days later using histology and morphometry. Macroscopically we could observe almost a 48% reduction in the mass of the muscles compared to age‐ and weight‐matched non‐BMT control animals of the same genetic background (Fig. 4 A and B). Thus, in agreement with our previous lower body irradiation experiments (Fig. 2 A), muscle regeneration in these BMT animals was severely impaired, even after 2 months post‐irradiation and BMT, in comparison to control non‐BMT animals (Fig. 4 C). This impairment can also be illustrated by a significant shift to the left of the distribution of the myofibre CSA (Fig. 4 D), a decrease in the mean CSA of regenerating myofibres (−42%, P < 0.0001), (Fig. 4 D right panel) and an increase in necrotic fibre content (Fig. 4 E).
Figure 4. Impaired regeneration of skeletal muscle in bone marrow transplanted animals.
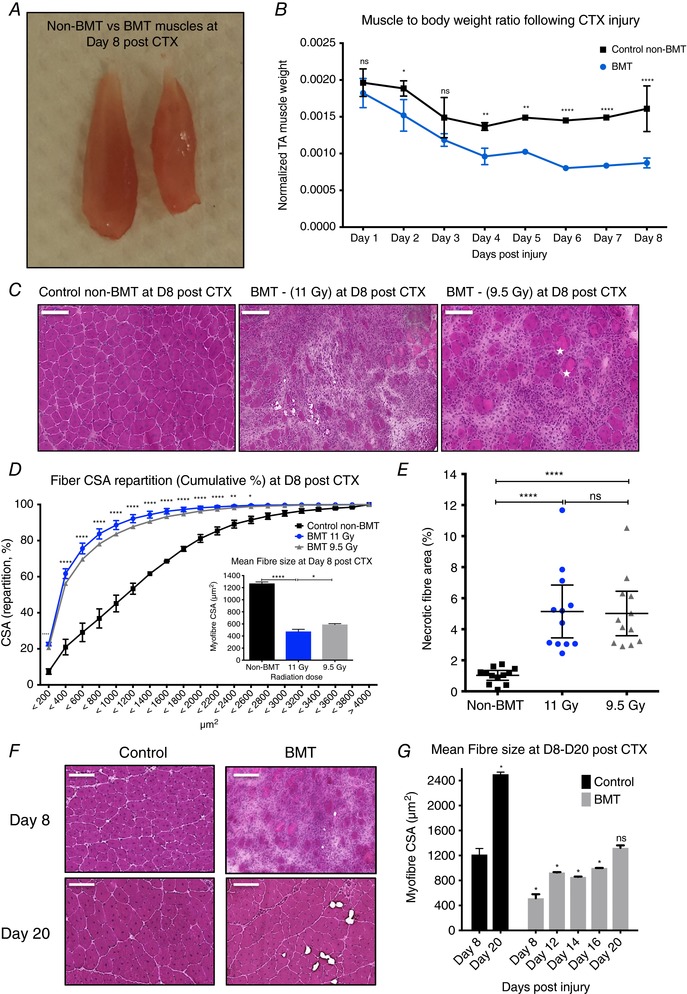
A, normalized TA muscle to body weight from age‐ and weight‐matched control non‐BMT and bone marrow transplanted (BMT) animals at indicated time points following CTX injury. By day 8 post‐CTX TA muscle weight drops from 0.056 to 0.046 g in the control non‐BMT animals and from 0.053 to 0.025 g in the BMT animals. B, representative macroscopical image of TA muscle from control (left) and BMT (right) animals at day 8 post‐CTX injury. C, representative images of H&E‐stained muscle from control (non‐BMT) and BMT animals radiated with 11 or 9.5 Gy at day 8 post‐CTX‐induced injury. Asterisks label phagocytic and/or necrotic fibres. Scale bars represent 100 μm. D, myofibre CSA repartition (cumulated) and mean CSA (right panel) in control and BMT animals (radiated with 11 or 9.5 Gy) at day 8 post‐CTX injury (number of fibres counted > 20,000). Significance is shown for control vs. BMT 11 Gy. E, the ratio of phagocytic and/or necrotic fibre area relative to the regeneration area at day 8 in control and BMT muscle sections. F, representative images of H&E‐stained muscle from control (non‐BMT) and BMT animals at the indicated time points post‐CTX injury. G, average fibre CSA of regenerating muscle at indicated time points post‐CTX injury in control and BMT animals. All data time points were compared to day 8 controls. n = (numbers of individual muscles, derived from controls or BMT animals): at least 8 muscles for each sample per time point. In all graphs, mean values ± SEM are shown.
In addition, when we further followed up the regeneration period in the BMT animals we observed that recovery to a morphologically and histochemically mature muscle took at least 2 more weeks (day 20 post‐CTX) compared to the non‐BMT animals (Fig. 4 F), as shown by the mean CSA of regenerating myofibres (Fig. 4 G). Reducing the radiation dose to 9.5 Gy (a sub‐lethal dose) and increasing the number of BM cells to be injected from 5 × 10⁶ to 20 × 106 had only a small effect in improving the outcome of regeneration (Fig. 4 C‐‐E) although bone marrow chimerism did improve (Fig. 5 B and C). Chimerism measurements were performed as shown before (Mocsai et al. 2002) by using CD45.1 and CD45.2 markers to distinguish between the leukocytes of the donor and that of the recipient. The gating strategy we followed to determine the chimerism in the BMT animals is illustrated in Fig. 5 A.
Figure 5. Delayed phenotypic transition of infiltrating myeloid cells in BMT animals following CTX injury.
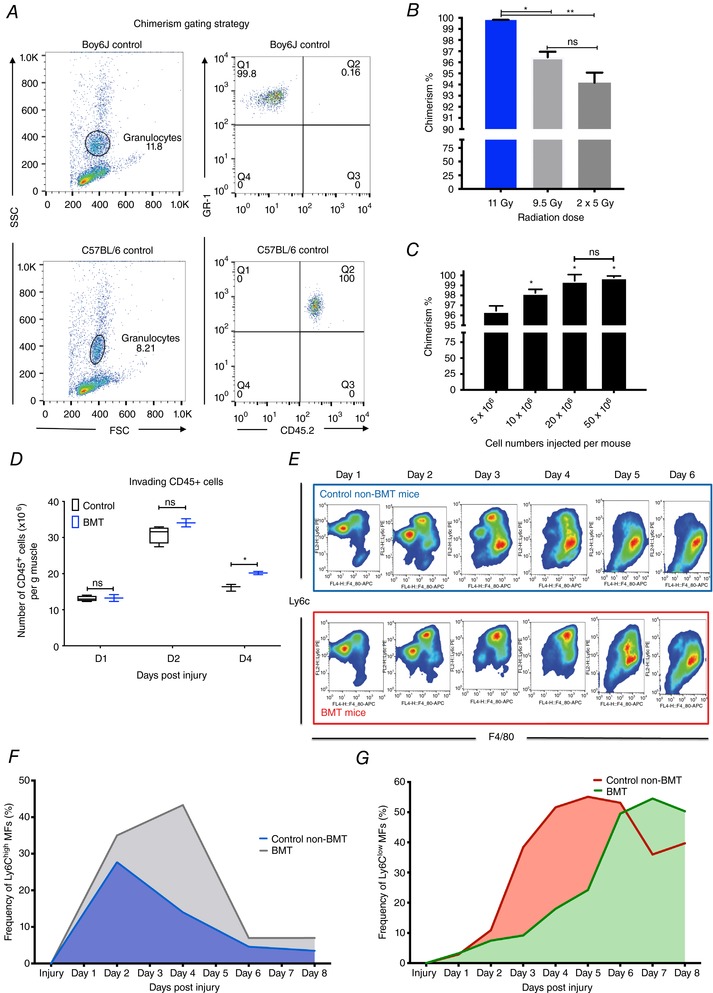
A, FACS gating strategy to calculate chimerism levels following BMT. The ratio of donor (CD45.2+) to host (CD45.1+) bone marrow repopulation is gated on the granulocyte fraction using CD45.2 and GR1 antibodies. B, percentage of chimerism in BMT animals receiving different radiation doses (one single dose of 11 Gy or 9.5 Gy and 2 consecutive doses of 5 Gy with a 24 h rest period between them). C, percentage of chimerism in BMT animals injected with different numbers of donor cells (5, 10, 20 and 50 × 106 cells). In both chimerism experiments n > 8 per group. D, number of infiltrating myeloid (CD45+) cells in regenerating muscle at days 1, 2 and 4 post‐CTX injury (n = 8 muscles per group). E, FACS gating strategy to enumerate muscle infiltrative Ly6Chigh F4/80low and Ly6Clow F4/80high macrophages at day 1–6 post‐CTX injury. Upper panel (blue) shows representative samples from control animals and lower (red) from BMT animals. F, percentage of Ly6Chigh F4/80low muscle MFs at indicated time points following CTX injury (n = 12 mice per group) in control non‐BMT and BMT samples. Day 2–day 6 comparisons between groups give statistically significant results (P < 0.01). G, percentage of Ly6Clow F4/80high muscle MFs at indicated time points following CTX injury (n = 12 mice per group) in control non‐BMT and BMT samples. Day 2–day 6 comparisons between groups give statistically significant results (P < 0.01). In all graphs, mean values ± SEM are shown.
Furthermore, we did not find any statistically significant differences between the numbers of invading myeloid cells (CD45+) in BMT versus non‐BMT controls except from day 4 in which an increase of cell number in the BMT animals was observed (Fig. 5 D), validating our previous results (Fig. 3 B). Next, we examined the dynamics of the infiltrating myeloid cell populations during the course of the regeneration in non‐BMT controls and BMT animals. At day 1 post‐CTX injury, the predominant cell populations within the muscle are neutrophils and Ly6Chigh macrophages (Fig. 1 B). The ratio of the Ly6Ghigh Ly6Cmed F4/80− neutrophils and the Ly6Chigh F4/80low macrophages among the CD45+ cells isolated from injured muscle at day 1 was not significantly altered (Fig. 5 E and F). At day 2 the ratio of Ly6Chigh F4/80low (Fig. 5 F) and Ly6Clow F4/80high (Fig. 5 G) macrophages in injured muscle between BMT and non‐BMT controls was altered (Fig. 5 E–G). More importantly, the difference in the ratio of Ly6Chigh F4/80low and Ly6Clow F4/80high we observe at day 2 could be detected all the way through day 6 after the CTX injury (Fig. 5 E–G). In summary, we consistently observed a 2‐day delay in the phenotypic transition of the infiltrating myeloid cells from the inflammatory to the repair phenotype. These experiments indicated to us, as expected, that irradiation is impacting regeneration in the bone marrow transplantation model as well, while we can readily assess the origin of the myeloid infiltration.
In order to maintain the contralateral leg as a control following irradiation and BMT, we decided to optimize our radioprotection strategy. Thus, we devised a method to both preserve the satellite cell number and replace the bone marrow‐derived macrophages to be able to assess infiltrating macrophage phenotypic dynamics. Methods of radioprotection from radiation‐induced toxicity include dose fractionation (Fig. 4 C) and lead shielding (Fig. 6 A). We measured chimerism at 6‐, 8‐ and 12‐week intervals after transplantation and found that chimerism increased with longer recovery periods (Fig. 6 B), higher radiation doses (Fig. 6 B) and one versus both hindlimbs radioprotected (through lead shielding) (Fig. 6 C). Radioprotecting one leg protects/shields the bone marrow, resulting in chimerism that was slightly decreased (Fig. 6 C) but still high enough (>90%) to allow us to assess the contribution of myeloid cell infiltration. This observation suggests that the optimization of the leg hindlimb radioprotection set‐up worked without sacrificing chimerism efficiency. Now this optimized method allowed us to (1) ablate satellite cells, (2) assess muscle regeneration outcome, (3) control the origin, and (4) assess the dynamics of myeloid cell infiltration – all these in the same animal. In order to simplify the nomenclature, and keeping in mind that we are assessing muscles of the same animal, we call ‘BMT‐shielded’ the muscle of an animal that underwent irradiation with hindlimb radioprotection (by the use of lead shields) followed by BMT, and ‘BMT‐unshielded’ the contralateral muscle of the same animal that underwent irradiation (without radioprotection) followed by BMT. In a typical experiment we had three kinds of muscle: (1) control, meaning muscles from non‐irradiated, non‐shielded, non‐BMT animals, which reported the normal regeneration kinetics; (2) BMT‐shielded, meaning muscles from irradiated, radioprotected and BMT animals; and (3) BMT‐unshielded, meaning muscles from irradiated, non‐radioprotected and BMT animals. Importantly muscles from group 2 and 3 come from the same animal. In agreement with our hypothesis, muscle regeneration and TA muscle mass at day 8 post‐CTX injury in unshielded BMT animals were significantly impaired compared to contralateral BMT shielded muscles, as illustrated by the muscle mass (Fig. 6 D and E), H&E histology staining (Fig. 7 B), the distribution (Fig. 7 D) and mean (Fig. 7 D right panel) myofibre CSA, and necrotic fibre content (Fig. 7 E). The efficiency of the radioprotection can also be seen by the preservation of coat colours only in the radiation‐protected regions (Fig. 6 E left panel). Interestingly, we observed no apparent difference in muscle mass (Fig. 6 D) or CSA (Fig. 7 A and C) of uninjured BMT‐shielded versus uninjured BMT‐unshielded muscles, and also no central myonuclei in the BMT‐unshielded muscles suggesting that the radiation does not have a direct long‐term effect on muscle morphology. Albeit reduced numbers of PAX7 positive cells were observed at 8 weeks following irradiation (Fig. 2 F), it appears that an acute insult to the muscle, such as CTX, is needed to reveal the muscle regeneration deficiency.
Figure 6. BMT with radioprotection‐optimized set‐up.
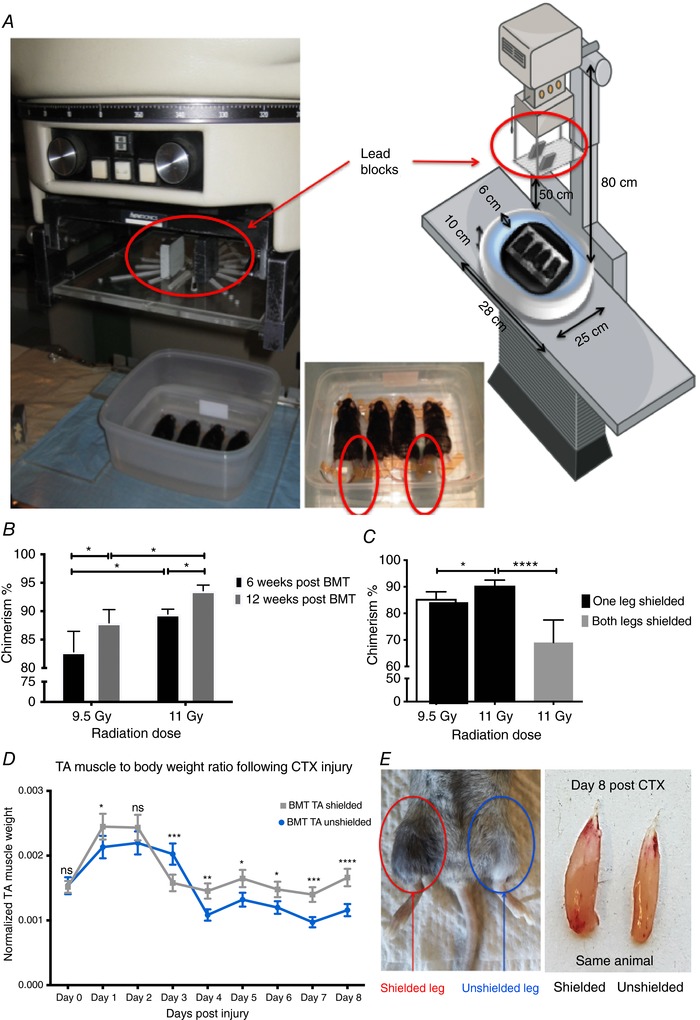
A, representative images of the shielding adaptation during irradiation. The mice were put into a plastic box with double wall and water was used for scattering medium. Two 5 cm‐high lead blocks on the poly(methyl methacrylate) shadow tray were used for protection of one of the legs (red circles) of the mouse at 20 cm distance from the surface of the plastic box. The source surface distance (SSD) and source axis distance (SAD) were 80 cm. The beam size was 21 × 21 cm. The diagrammatic illustration uses a modified version of art from Servier Medical Art under a Creative Commons (CC) licence (http://smart.servier.com/smart_image/radiography-5/). B, percentage of chimerism in animals left to recover for 6 vs. 12 weeks post‐irradiation and BMT (n = 8 per group). C, percentage of chimerism in BMT animals with one vs. both legs shielded (n = 8 per group). D, normalized TA muscle to body weight ratio from BMT shielded vs. unshielded animals at indicated time points following CTX injury (n = 16 per group). E, representative macroscopic images of recovered BMT shielded animals (left) and muscles at day 8 post‐CTX (right). The fur colour was preserved in the shielded leg (red circle) but not in the unshielded leg (blue cirlce) of the same animal. In all graphs, mean values ± SEM are shown.
Figure 7. Radioprotected muscles during BMT have normal recovery time following CTX injury.
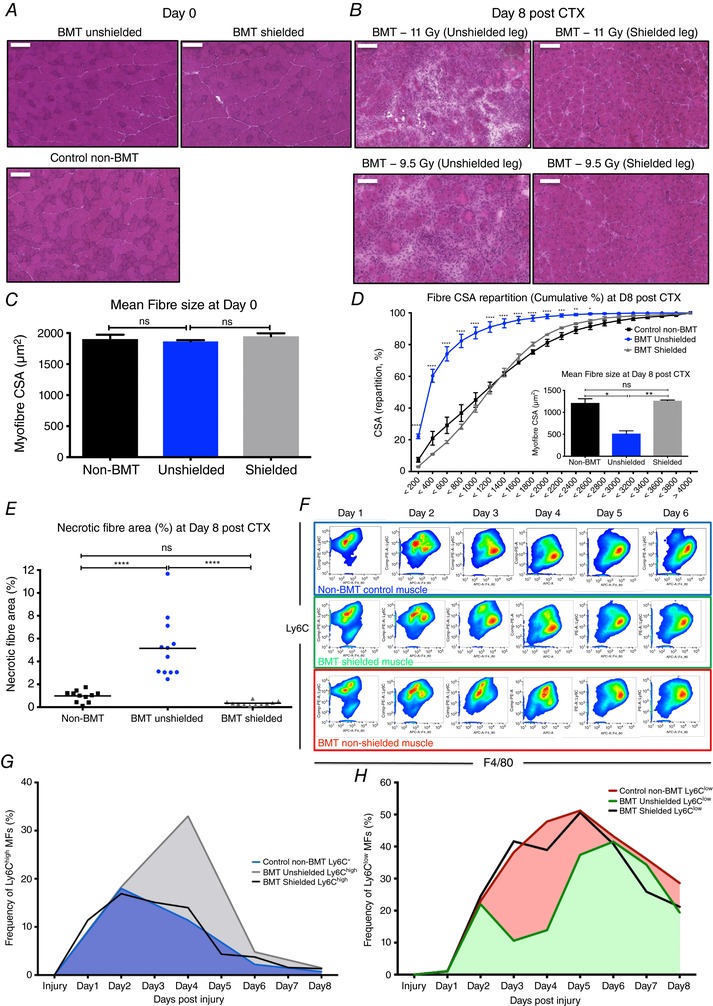
A, representative images of H&E‐stained uninjured TA muscles from control non‐BMT, BMT‐shielded and BMT‐unshielded muscles. Scale bars represent 100 μm. B, representative images of H&E‐stained TA muscle from control non‐BMT, BMT‐shielded and BMT‐unshielded muscles radiated with 11 or 9.5 Gy at day 8 post‐CTX‐induced injury. Scale bars represent 100 μm. C, average fibre CSA of uninjured (day 0) TA muscle from control non‐BMT, BMT‐shielded and BMT‐unshielded muscles (n = 12 muscles per group). D, myofibre CSA repartition (cumulated) and mean CSA (right panel) in control non‐BMT, BMT‐shielded and BMT‐unshielded muscles (n = 12 muscles per group) at day 8 post‐CTX (number of fibres counted >20 000). E, the ratio of phagocytic and/or necrotic fibre area relative to the regeneration area at day 8 in control non‐BMT, BMT‐shielded and BMT‐unshielded muscle sections. F, FACS gating strategy to enumerate muscle infiltrative Ly6Chigh F4/80low and Ly6Clow F4/80high macrophages at day 1–6 post‐CTX injury. Upper panel (blue) shows representative samples from control non‐BMT animals, middle panel (green) shows samples from BMT‐shielded muscles and lower panel (red) from BMT‐unshielded muscles. G, percentage of Ly6Chigh F4/80low muscle MFs from control non‐BMT, BMT‐shielded and BMT‐unshielded animals at indicated time points following CTX injury (n = 12 mice per group). H, percentage of Ly6Clow F4/80high muscle MFs from control non‐BMT, BMT‐shielded and BMT‐unshielded animals at indicated time points following CTX injury (n = 12 mice per group). In all graphs, mean values ± SEM are shown.
Local radioprotection during BMT allows the assessment of donor bone marrow‐derived invading macrophages in an intact muscle tissue environment
The next obvious question was to determine whether radioprotection (lead shielding) in the BMT‐shielded animals sustains the cellular dynamics of the myeloid cell invasion following CTX injury at control levels. Hence, we injected BMT‐shielded and BMT‐unshielded muscles (from the same animal) with CTX and myeloid cells were isolated from them at day 1 to day 6 after the injury using CD45+ magnetic bead selection and Ly6G, Ly6C and F4/80 antibody labelling. Within the same animal the contralateral BMT‐unshielded muscle showed the 2‐day delay in the phenotypic switch from Ly6Chigh to Ly6Clow (Fig. 7 F–H), in accordance with the histopathological assessment (Fig. 7 B). To prove that the infiltrating cells in both the BMT‐shielded and BMT‐unshielded muscles originate from the donor C57BL/6J bone marrow (CD45.2 positive) and share the same features, we quantified CD45+ positive cells according to the myeloid lineage markers CD45.1 (recipient BoyJ bone marrow stains positive for CD45.1 but not CD45.2) and CD45.2 by FACS (Fig. 8 A). Over 90% of the infiltrating cells in both the BMT‐shielded and BMT‐unshielded muscles were CD45.2 positive, which is in line with the level of chimerism detected in the blood from the same animals (Fig. 8 B), thus excluding the contributions of tissue‐resident macrophages in the observed phenotype. Demonstrating that the donor‐derived cell infiltrate (CD45.1 vs. CD45.2 %) was present even when the host limb was radioprotected during BMT suggests that this BMT modification could be a viable model for muscle regeneration studies despite the tibia and femur not being irradiated.
Figure 8. Infiltrating cells in both the BMT‐shielded and BMT‐unshielded muscles share the same features and originate from the donor C57BL/6J bone marrow.
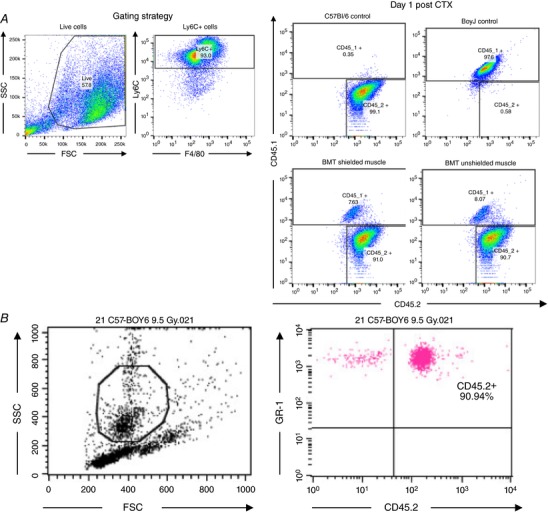
A, tracing of muscle macrophage origin based on the myeloid lineage markers CD45.1 (host BoyJ bone marrow stains positive for CD45.1 but not CD45.2) and CD45.2 (donor bone marrow stains positive for CD45.2 but not CD45.1) at day 1 post‐CTX injury. Both the BMT‐shielded and BMT‐unshielded muscles were over 90% CD45.2 positive (n = 4 per group). B, blood chimerism levels from the same BMT animals prior to the above terminal experiment (n = 4 per group).
Taken together, these results suggest that radioprotection by lead shielding effectively attenuated radiation effects and protected muscle tissue integrity. This also suggests that the cause of the delay in regeneration is the effect of irradiation of the leg itself and not elsewhere in the body, for example in the bone marrow, blood or spleen, which are sites from where myeloid cells could be derived.
18F‐FDG PET‐MRI allows in vivo monitoring of the infiltrating immune response and reveals that the invading myeloid cells are metabolically distinct
The analysis of myeloid cells following the injury based on surface markers requires long (over 6 h) and tedious tissue processing. In order to obtain additional and truly in vivo non‐invasive reading of myeloid cell invasion we turned to in vivo imaging. The positron emission tomography (PET) imaging technique is a widely used non‐invasive method in clinical and preclinical studies for the detection of tumours, staging and monitoring the effect of cancer therapy (Wester, 2007). The glucose analogue 2‐[18F]fluoro‐2‐deoxy‐d‐glucose (18F‐FDG) is the most commonly used and validated tracer, which is taken up by activated cells where it is metabolically trapped and accumulates in proportion to intracellular demand. Increased FDG uptake was observed in several energy‐intensive processes, such as infections and inflammation (Glaudemans et al. 2013; Vaidyanathan et al. 2015), and has been associated with activated neutrophils and macrophages, so we hypothesized that using FDG as a tracer and combining it with MRI (Signore & Glaudemans, 2011; Gondin et al. 2015) could be a novel and effective method to monitor the events following the acute muscle injury and specifically the metabolism of the immune cells during the inflammatory response.
In order to make sure that muscle metabolism was not interfering with our labelling, PET‐MRI experiments were always performed during the light cycle in which the activity of the mice is minimal and thus muscles are considered as being at rest. In addition, in various exercise physiology studies (Tashiro et al. 1999; Kemppainen et al. 2002; Slimani et al. 2006; Haddock et al. 2017), FDG uptake in resting muscles is minimal and thus in our experiments day 0 served as the baseline, allowing us to follow the metabolic changes in the muscle, as the result of CTX injury, and exclude the contribution of skeletal muscle activity. By the quantitative analysis of the decay‐corrected 18F‐FDG PET images we found significant differences in the mean standardized uptake value (SUV) of the indicated TA muscle tissues 50 min after tracer injection and at various time points (day 0–8) post‐CTX injury (Fig. 9 A).
Figure 9. In vivo monitoring of the infiltrating immune response with 18F‐FDG PET‐MRI.
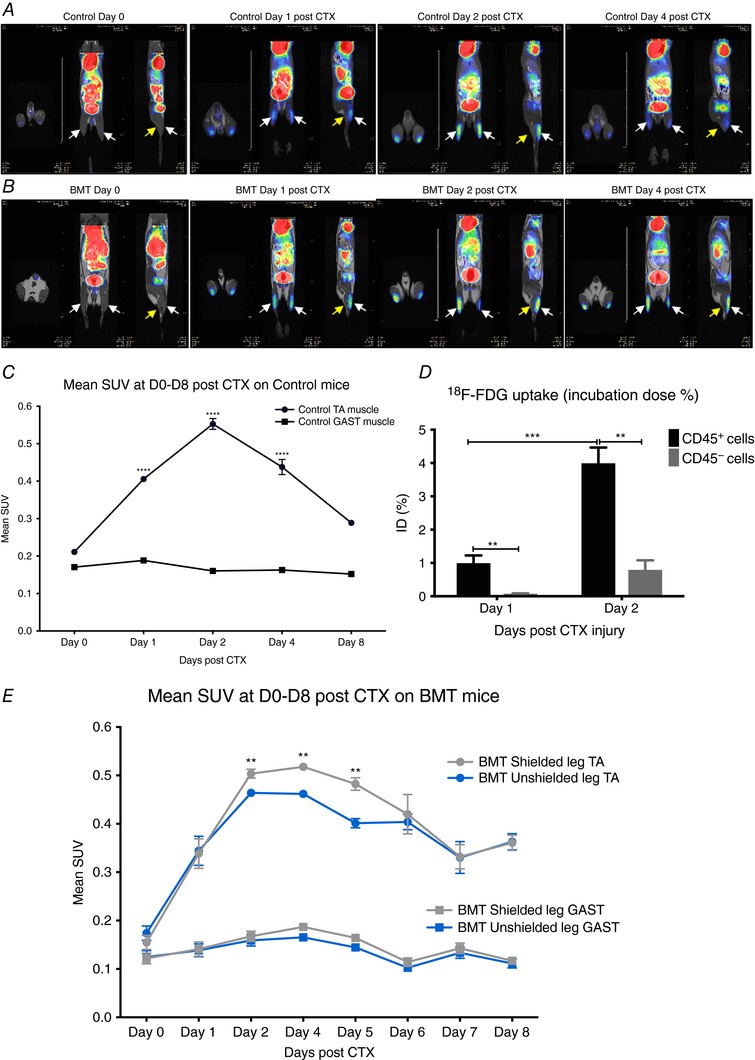
A, representative whole body PET‐MRI images (axial, coronal and sagittal planes are shown) of control non‐BMT at indicated time points post‐CTX injury. Images were obtained 50 mins after i.v. injection with 8.0 ± 0.2 MBq 18F‐FDG. Arrows show muscles under consideration (white arrows indicate tibialis anterior and yellow arrows indicate gastrocnemius). B, representative whole body PET‐MRI images (axial, coronal and sagittal planes are shown) of BMT mice with right leg radioprotection (lower panel) at indicated time points post‐CTX injury. Images were obtained 50 min after i.v. injection with 8.0 ± 0.2 MBq 18F‐FDG. Arrows show muscles under consideration (white arrows indicate TA and yellow arrows indicate GAST). C, quantitative analysis of the 18F‐FDG uptake of the injured TA muscles in control non‐BMT at indicated time points post‐CTX injury. 18F‐FDG mean standardized uptake value (SUV) of TA and GAST (used as baseline muscle mean SUV) muscles (n = 8). D, ex vivo 18F‐FDG uptake (shown as incubation dose % per 106 live cells) of the myeloid CD45+ versus non‐myeloid CD45− cell fractions (106 live cells were sorted in each group/experiment) of the injured TA muscles in control non‐BMT at indicated time points post‐CTX injury (n = 4). E, 18F‐FDG mean SUV of injured TA and uninjured GAST muscles from BMT‐shielded versus BMT‐unshielded muscles of the same animal at indicated time points (n = 8). In all graphs, mean values ± SEM are shown.
The 18F‐FDG accumulation in the leg was overall significantly higher in the injured TA muscle area at all the time points we checked, compared to control uninjured animals (mean SUV was 0.21 ± 0.01) (Fig. 9 A and C). The 18F‐FDG accumulation of the gastrocnemius (GAST) muscle area showed very low signal and served as a negative control at all time points (mean SUV: 0.17 ± 0.02). The radiotracer uptake from injured muscle region at day 2 was approximately two‐fold higher (0.55 ± 0.01) compared to all other time points followed by day 1 (0.42 ± 0.01) and day 4 (0.37 ± 0.01) post‐injury (Fig. 9 C). Next, based on the significantly increased PET signal we observed at day 2 post‐CTX, we asked whether the signal comes from the muscle‐resident cells or the infiltrating immune cells. To tackle this question, we decided to perform an ex vivo 18F‐FDG uptake on isolated myeloid CD45+ versus non‐myeloid CD45− cells from D1 and D2 injured muscles (106 live cells sorted based on FSC/SSC gating were used for each group). In accordance with our hypothesis, myeloid CD45+ cells seemed to take up and utilize almost 5 times more 18F‐FDG compared to non‐myeloid CD45− cells (Fig. 9 D), which is line with previous observations (Gamelli et al. 1996; Hyafil et al. 2009; de Prost et al. 2010), where macrophages co‐localize with the in vivo PET signal in inflamed tissues. Furthermore, the increased 18F‐FDG uptake of the myeloid cells (Fig. 9 D) overlapped with the kinetics of the myeloid cell numbers infiltrating the injured muscle (Fig. 5 F). However one should note that CD45− cell fraction might contain a low percentage of dead cells.
In summary we demonstrated that 18F‐FDG PET‐MRI is a valuable tool to monitor immune cell invasion in vivo. Thus, we used it in order to delineate and further explain the difference in the regeneration process between BMT‐shielded and BMT‐unshielded muscles. By the quantitative analysis of the decay‐corrected 18F‐FDG PET images we found significant differences in the mean SUV of the BMT‐shielded versus BMT‐unshielded muscles at various time points (day 2–6) post‐CTX injury (Fig. 9 B and E), which overlaps with the delayed dynamics of the inflammatory response (Fig. 7 F–H) we observed previously with FACS. More specifically we detected a significantly lower accumulation of 18F‐FDG in the BMT‐unshielded muscles compared to the BMT‐shielded muscles of the same animal at days 2, 4, 5 and 6 post‐CTX.
In vivo ablation of PAX7+ cells produces similar phenotypic transition delay on infiltrating macrophages
The radioprotection and in vivo imaging experiments presented in this study showed that lead shielding during radiation exposure prevented the delay of muscle regeneration following CTX injury, preserved the local muscle cell composition and sustained infiltrating myeloid cell kinetics and metabolic properties at control levels, suggesting that the infiltrating immune response of skeletal muscle regeneration is regulated by a local radiosensitive tissue compartment, including PAX7+ satellite cells. In order to determine if the decrease in satellite cell numbers observed following radiation was contributing to delayed macrophage phenotypic shift, we decided to deplete satellite cells in vivo before the injury. By using a transgenic mouse model for selective diphtheria toxin‐induced depletion of PAX7+ satellite cells (Nishijo et al. 2009), we observed that satellite cell ablation (Pax7 CreER‐DTA) led to a significantly decreased muscle mass following the injury (Fig. 10 A and B). This result is in agreement with the current literature in which PAX7 positive satellite cells are indispensable for skeletal muscle regeneration both for development (Fry et al. 2015) and following an acute injury (Lepper et al. 2011; Sambasivan et al. 2011). Interestingly satellite cell ablation led to alterations not only in muscle macrophage infiltration numbers both at day 4 and day 6 post‐CTX (Fig. 10 C) but also in dynamic MF phenotype shift (Fig. 10 D–G), similar to irradiated and BMT‐unshielded muscles. Therefore our data suggest that it is indeed the PAX7 lineage cell pool that is regulating, at least in part, the repair macrophage phenotype transition.
Figure 10. Delayed phenotypic transition of infiltrating myeloid cells in satellite cell depleted animals following CTX injury.
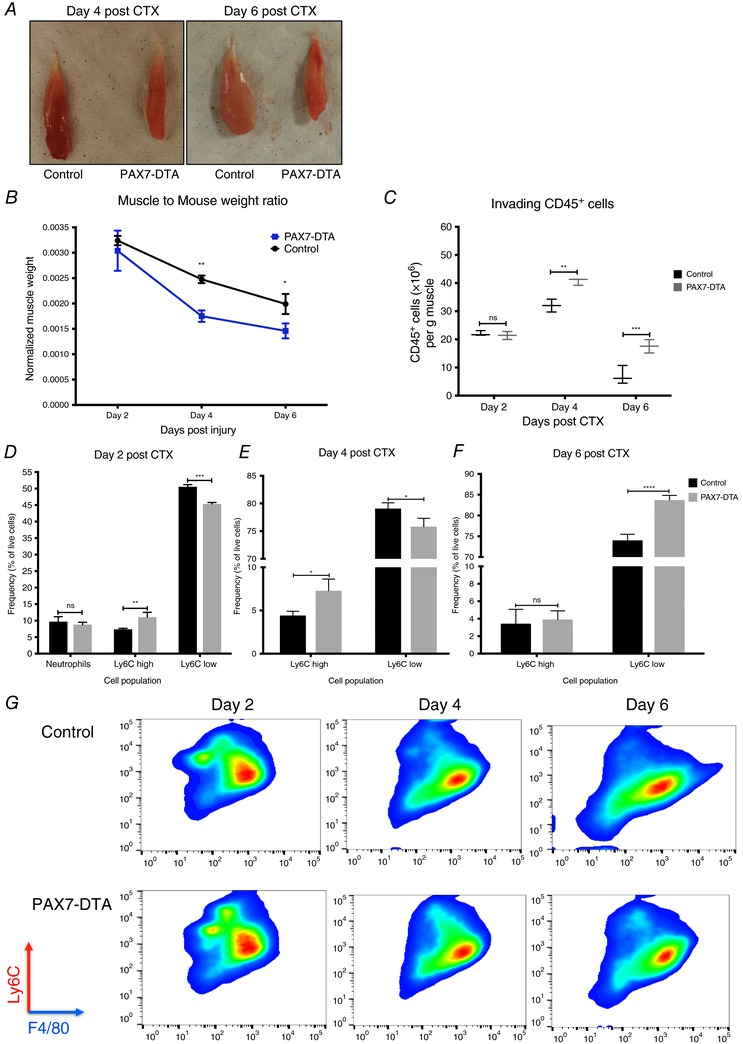
A, representative macroscopic image of TA muscles from control (left) and satellite cell ablated PAX7ER‐DTA (right) animals at days 4 and 6 post‐CTX injury. B, TA muscle weight from control versus PAX7ER‐DTA animals at indicated time points following CTX injury (n = 4 per group). C, number of infiltrating myeloid (CD45+) cells in regenerating muscle of satellite cell‐depleted animals (PAX7ER‐DTA), at days 2, 4 and 6 post‐CTX injury (n = 16 muscles per group). D, percentage of inflammatory (Ly6Chigh F4/80low) and repair (Ly6Clow F4/80high) muscle MFs from control and PAX7ER‐DTA animals at day 2 following CTX injury (n = 12 mice per group). E, percentage of inflammatory (Ly6Chigh F4/80low) and repair (Ly6Clow F4/80high) muscle MFs from control and PAX7ER‐DTA animals at day 4 following CTX injury (n = 12 mice per group). F, percentage of inflammatory (Ly6Chigh F4/80low) and repair (Ly6Clow F4/80high) muscle MFs from control and PAX7ER‐DTA animals at day 6 following CTX injury (n = 12 mice per group). G, representative FACS images of Ly6Chigh F4/80low and Ly6Clow F4/80high macrophages at days 2, 4 and 6 post‐CTX injury. Upper panel shows representative samples from control animals, lower panel from PAX7ER‐DTA animals. In all graphs, mean values ± SEM are shown.
Discussion
Tissue regeneration is a complex but precisely coordinated array of processes involving cellular recruitment, differentiation, phenotype switches and intercellular communications. We have been interested in defining the role and contribution of myeloid cells to pathophysiological processes such as the one during skeletal muscle regeneration. In this work (1) we document that altered cellular composition affects the in situ phenotypic transition of invading myeloid cells to repair macrophages, thus (2) revealing the existence of reciprocal intercellular communication between satellite cells and recruited macrophages during skeletal muscle regeneration, and (3) establish a combination of methods to use bone marrow transplantation, with local muscle radiation shielding, to identify myeloid cell contribution to tissue repair and monitor the myeloid cells’ metabolic activity in vivo.
The skeletal muscle microenvironment is very heterogeneous, with distinct cell types such as satellite cells, fibroblasts, fibro/adipogenic progenitors (FAPs), adipocytes, epithelial cells, Schwann cells and blood cells, all of which may influence and, in turn, be influenced by local structural and biochemical cues (Bentzinger et al. 2013). The general consensus holds that satellite cells are required for muscle regeneration. Here we show that both radiation‐induced or in vivo ablation (PAX7‐DTA) of these cells leads to delayed repair macrophage phenotypic transition and muscle regeneration. While there have been several papers demonstrating that infiltrating macrophages influence satellite cell behaviour (Cantini et al. 1994; Cantini & Carraro, 1995; Saclier et al. 2013), our data indicate that the reverse is also true, and that PAX7 lineage cells are regulating a degree of the in situ macrophage phenotypic shift. However, there are also additional cell types that are abundant in healthy muscle, and it has been recently shown that FAPs (Joe et al. 2010; Uezumi et al. 2010), fibroblasts (Murphy et al. 2011), endothelial cells (Christov et al. 2007), and other interstitial cells like pericytes (Dellavalle et al. 2011; Birbrair et al. 2014; Kostallari et al. 2015) expand following acute muscle damage, to transiently establish an environment that enhances myogenic differentiation. This raises the question whether perturbations of their cellular interplay with satellite cells or macrophages could further explain the delay in the macrophage phenotype switch. For example, it is known that angiogenesis is crucial for muscle repair and satellite cell survival. In this context endothelial cells strongly stimulate myogenic cell growth while myogenic cells promote angiogenesis (reviewed in Latroche et al. 2015). On the other hand, during return to homeostasis, periendothelial cells facilitate the return to quiescence of a subset of muscle precursor cells that ensures self‐renewal of the satellite cell pool (Abou‐Khalil et al. 2010). Interestingly, depletion of PAX7+ cells in vivo has no impact on vasculature (CD31+ endothelial cells), innervation or neuromuscular junctions (Sambasivan et al. 2011). The same group also documented that FAPs and fibroblasts are unchanged in the PAX7+ ablated muscles (Sambasivan et al. 2011), which suggests that the interaction of satellite cells with macrophages is unique and likely to be specific.
Substantially less is known about the role of the adaptive immune system in the regeneration process. Lymphocytes consistently infiltrate the muscle in conditions of chronic injury, including muscular dystrophies (Burzyn et al. 2013; Villalta et al. 2014) and during ageing (Kuswanto et al. 2016). Recent studies have shown that in acute injury models, like the CTX model, lymphocytes are recruited and required for the healing of the muscle (reviewed in Schiaffino et al. 2017). More specifically, T regulatory cells (Tregs) seem to be involved in muscle repair by directly interacting with satellite cells, inducing their expansion (Castiglioni et al. 2015). It has also been shown that Tregs efficiently induced the phenotypic and functional switch to M2 macrophage differentiation in vivo (Liu et al. 2011). Thus it will be interesting for future studies to explore possible interactions of Tregs with satellite cells and macrophages in our system, which could potentially influence the phenotypic shift of the muscle‐infiltrating macrophages.
Our finding that PAX7 positive satellite cells affect macrophage phenotypic transition poses several more questions, regarding a potential niche for macrophages formed by satellite cells, what signalling molecules/cytokines influence the communication between these cell types and whether satellite cells produce signals that instruct macrophage functions such as debris clearance, phagocytosis and myogenesis. It will require selective depletion or replenishment of satellite cells and other cell types to establish the cause and effect relationships between them and macrophage invasion, phenotypic switching and contribution to repair. Future studies should test whether radiation causes a depletion of these and other local interstitial cells with myogenic potential that could affect also the cross‐talk with the immune cells following acute damage, which in turn can affect macrophage infiltration and phenotypic dynamics, and subsequently muscle regeneration outcome.
In order to understand these complex interactions one needs more complex methodologies. We believe that our work here goes some distance to address these needs. Cardiotoxin injection in TA muscles is very well suited to study immune cell infiltration because it induces extensive, homogeneous and synchronous damage. Myeloid cells invade the injured muscle and during the course of regeneration, dynamically alter their phenotype by day 4 in a highly ordered and reproducible manner, leading to complete regeneration (ad integrum) of the muscle fibres by day 8. A recent study by Wang et al. (2014) provided mechanistic insights into the contribution of monocyte‐derived subsets by eliminating CD11b+ monocyte and macrophage subsets using a diphtheria toxin‐inducible system and the CTX injury model. They were able to show by transient and differential ablation that not only monocyte‐derived macrophages, but also the phenotypic transition is necessary for proper regeneration. In this context our data suggest that the delayed transition is likely to be causative of impaired regeneration.
Several important signalling pathways and transcriptional regulators such as insulin‐like growth factor 1, CCAAT/enhancer binding protein β, AMP‐activated protein kinase and p38 MAPK (Ruffell et al. 2009; Perdiguero et al. 2011; Mounier et al. 2013; Tonkin et al. 2015) have been implicated in the phenotypic transition of these muscle macrophages (from the pro‐inflammatory/phagocytic phenotype (Ly6Chigh) to the anti‐inflammatory/reparatory phenotype (Ly6Clow)) using the CTX model. However, many more pathways could be implicated (reviewed in Lawrence & Natoli, 2011) and further work towards their identification is needed. To this end, loss of function experiments have been employed to identify key genes, by crossing gene‐specific floxed allele‐containing mice with the myeloid‐specific LysM‐CRE strain (Clausen et al. 1999), in order to generate myeloid‐specific knockout strains. However, the availability of conditional myeloid‐specific knockout mice for most genes is a limiting factor in delineating their role in the macrophage phenotype switch during muscle injury and regeneration. A commonly used method to assess the contribution of myeloid cell populations in in vivo murine disease models is bone marrow transplantation (BMT). During this CD45 congenic method, the bone marrow of animals is eliminated by total body irradiation and then reconstituted by injecting fresh bone marrow isolated from specific donor animals that are usually genetically manipulated. The fact that the congenic donor cells can be easily tracked is also highly beneficial. However, the requirement for total body irradiation leads to unwanted inflammation, tissue injuries and fibrosis (Colson et al. 1996; Johnston et al. 2002; Ghosh et al. 2009) if not properly optimized. Despite the fact that it has been previously reported that muscle regeneration is impaired in irradiated muscles (Gulati, 1987; Wakeford et al. 1991), BMT experiments to generate chimeric mice have been used extensively as an alternative tool in muscle regeneration studies (Perdiguero et al. 2011; Mounier et al. 2013). Therefore, we reasoned that the combination of an optimized BMT method with dose fractionation and in vivo imaging would allow us to trace and characterize myeloid cell invasion and cellular interactions and overcome the radiation effect. Low radiation doses lead to incomplete engraftment due to survival of the host bone marrow (Soderling et al. 1985; Colson et al. 1996; Baskiewicz‐Masiuk et al. 2009) but at the same time can also lead to macrophage activation (Finkelstein et al. 1994; Lorimore et al. 2001; Coates et al. 2008). Thus, an optimum radiation dose is needed to achieve complete BM ablation without causing any local organ damage. According to the current literature, irradiation doses of 7–13 Gy are myeloablative but one needs to be aware that the higher the dose, the higher the risk for the animals to die from irradiation‐induced toxicity (Down et al. 1991; Hardee et al. 2014). As mentioned above, methods for reducing radiation toxicity include dose fractionation (in which smaller doses of radiation are administered sequentially) and lead shielding. The latter method was successfully used by Labar et al. and Murphy et al. to protect the lungs and study alveolar macrophage turnover following BMT, but were limited by high levels of mixed chimerism in the circulation due to head and forelimbs being lead‐shielded as well (Labar et al. 1992; Murphy et al. 2008).
In our study and in order to bypass these limitations, (1) we used radioprotection sparingly, focused on protecting only one hindlimb (to minimize radioprotection of the recipient animal's BM), (2) increase the number of transplanted cells to 20 × 106 cells/BMT animal in order to increase the degree of chimerism in favour of donor BM repopulation (hindlimb radioprotection increases survival of host BM that in turn increases the competition with the donor BM), and (3) increase recovery time to 12 weeks post‐BMT, thus allowing us to both reach high levels of blood chimerism (>90%) and protect the local radiosensitive muscle compartments (e.g. satellite cell pool).
Our combined method with in vivo tracing of myeloid cells by PET‐MRI is an important advance allowing real time assessment of cell invasion as opposed to cell sorting, which requires several hours of processing. These findings have general ramifications because it may be possible to extend the utility of this system to other organs, for studies that require preservation of resident cell populations in bone marrow‐transplanted animals, and especially in cases of immune cell invasion. In addition, this method allowed us to examine, monitor and characterize the immune cell invasion following acute injury by CTX. The PET‐MRI in vivo imaging studies showed that these invading cells seem to have special metabolic properties biased towards glycolysis. In support of this observation, Mounier et al. (2013) showed that M2a macrophages had an increased basal and maximal oxygen consumption rate in comparison to M1 and M2c macrophages, which could further explain the increased SUV signal at day 2 following the injury. Our findings suggest that 18F‐FDG PET‐MRI is a useful tool to monitor immune cell invasion and to help to delineate and further explain the difference in the regeneration process in the irradiated muscles and especially the difference between BMT‐shielded and BMT‐unshielded muscles. Further acute sterile injury models in other tissues, such as liver or skin injury, could validate our PET‐MRI results.
In conclusion, our work has translational implications on the muscle regenerative potential of the elderly following radiation therapy. Our findings suggest that irradiation of skeletal muscle might impair the ability of satellite cells to orchestrate macrophage phenotypic transition further impacting regeneration potential. This is in addition to other known side effects of irradiation such as direct effects on myoblasts (Jurdana et al. 2013). Our findings also have potential ramifications for pathological circumstances in which recurrent muscle damage and satellite cell‐mediated regeneration asynchrony lead to devastating muscle diseases, such as Duchenne muscular dystrophy, which are most of the time associated with the permanent presence (and potential interaction) of inflammatory cells, especially macrophages.
Limitations
There are some technical limitations of this work. By using this modified BMT method in studies to assess myeloid contribution in muscle regeneration, the sample size might be too small (using only the shielded leg) and thus it could be difficult to find significant relationships among the data, due to the fact that statistical tests for such quantitative (i.e. CSA) studies will require a larger sample size. This will lead to doubling the number of animals in order to ensure a representative distribution of myofibre size and to reliably conclude as to the outcome of regeneration. Furthermore, the increase in cell numbers to be transplanted from 5 × 10⁶ to 20 × 106 will also increase the number of donor BM animals. Another limitation of our study is the usage of a human cobalt radiation source (gamma rays being used). Since various radiation sources (some are exclusively built for small animal research use) and types exist, such as gamma rays and X‐rays (lower energy and longer wavelength compared to gamma rays), with the latter being the most frequently used in radiation and BMT research, one cannot exclude the possibility of slightly different satellite cell ablation, chimerism and shielding efficiency depending on the aforementioned parameters. In addition, the radiation dose we chose and optimized was specific for the C57BL/6J strain. However, one needs to keep in mind that different inbred strains can tolerate different radiation doses (Duran‐Struuck et al. 2008). Thus minor dose and shielding optimization will be needed to attain comparable results. Finally, a conceptual limitation is that the contribution of other cell types to the observed phenotype cannot be excluded with absolute certainty.
Additional information
Competing interests
None of the authors has any conflicts of interest to disclose.
Author contributions
Conceptualization: A.P., T.V. and L.N. Methodology: A.P., A.P., G.T., E.P. and L.N. Software: A.P. and G.T. Validation: A.P., A.P. and G.T. Formal analysis: A.P., A.P. and G.T. Investigation: A.P., A.P., T.V., G.T., G.A.C., I.G., Z.P., B.D., E.P. and L.N. Resources: I.G., B.D., E.P. and L.N. Writing – original draft: A.P. and L.N. Writing – review and editing: A.P., G.A.C. and L.N. Visualization: A.P. and G.T. Funding Acquisition: T.V. and L.N. Supervision: L.N. All authors have approved the final version of the manuscript and agree to be accountable for all aspects of the work. All persons designated as authors qualify for authorship, and all those who qualify for authorship are listed.
Funding
L.N. and A.P. are supported by ‘NR‐NET’ ITN PITN‐GA‐2013‐606806 from the EU‐FP7 PEOPLE‐2013 program. T.V. is a recipient of a Bolyai Fellowship from the Hungarian Academy of Sciences. L.N. is supported by grants from the Hungarian Scientific Research Fund (OTKA K100196, K111941 and K116855) and by the Sanford Burnham Prebys Medical Discovery Institute.
Acknowledgements
The authors acknowledge the technical assistance of Ms Monika Porcelánné and discussions and comments on the manuscript by Dr Zsuzsa Szondy (University of Debrecen), Dr Marine Theret (University of British Columbia), Dr Istvan Szatmari (University of Debrecen), Dr Benedicte Chazaud (Universite Claude Bernard Lyon 1), Dr Remi Mounier (Universite Claude Bernard Lyon 1), Dr David Hammers (University of Florida) and members of the Nagy laboratory. The PAX7ER‐DTA mouse line was provided by Dr Charlotte Peterson and Dr John McCarthy (University of Kentucky).
References
- Abou‐Khalil R, Mounier R & Chazaud B (2010). Regulation of myogenic stem cell behavior by vessel cells: the “ménage à trois” of satellite cells, periendothelial cells and endothelial cells. Cell Cycle 9, 892–896. [DOI] [PubMed] [Google Scholar]
- Adams GR, Caiozzo VJ, Haddad F & Baldwin KM (2002). Cellular and molecular responses to increased skeletal muscle loading after irradiation. Am J Physiol Cell Physiol 283, C1182–C1195. [DOI] [PubMed] [Google Scholar]
- Arnold L, Henry A, Poron F, Baba‐Amer Y, van Rooijen N, Plonquet A, Gherardi RK & Chazaud B (2007). Inflammatory monocytes recruited after skeletal muscle injury switch into anti‐inflammatory macrophages to support myogenesis. J Exp Med 204, 1057–1069. [DOI] [PMC free article] [PubMed] [Google Scholar]
- Barton‐Davis ER, Shoturma DI & Sweeney HL (1999). Contribution of satellite cells to IGF‐1 induced hypertrophy of skeletal muscle. Acta Physiol Scand 167, 301–305. [DOI] [PubMed] [Google Scholar]
- Baśkiewicz‐Masiuk M, Grymuła K, Hałasa M, Pius E, Boehlke M & Machaliński B (2009). Induction of mixed chimerism in mice by employing different conditioning protocols and bone marrow cell transplantation. Transplant Proc 41, 1894–1899. [DOI] [PubMed] [Google Scholar]
- Bentzinger CF, Wang YX, Dumont NA & Rudnicki MA (2013). Cellular dynamics in the muscle satellite cell niche. EMBO Rep 14, 1062–1072. [DOI] [PMC free article] [PubMed] [Google Scholar]
- Bergstrom RM & Salmi A (1962). Radiation‐induced damage in the ultrastructure of striated muscle. Exp Cell Res 26, 226–228. [DOI] [PubMed] [Google Scholar]
- Birbrair A, Zhang T, Wang ZM, Messi ML, Mintz A & Delbono O (2014). Pericytes: multitasking cells in the regeneration of injured, diseased, and aged skeletal muscle. Front Aging Neurosci 6, 245. [DOI] [PMC free article] [PubMed] [Google Scholar]
- Boldrin L, Neal A, Zammit PS, Muntoni F & Morgan JE (2012). Donor satellite cell engraftment is significantly augmented when the host niche is preserved and endogenous satellite cells are incapacitated. Stem Cells 30, 1971–1984. [DOI] [PMC free article] [PubMed] [Google Scholar]
- Burzyn D, Kuswanto W, Kolodin D, Shadrach JL, Cerletti M, Jang Y, Sefik E, Tan TG, Wagers AJ, Benoist C & Mathis D (2013). A special population of regulatory T cells potentiates muscle repair. Cell 155, 1282–1295. [DOI] [PMC free article] [PubMed] [Google Scholar]
- Caiozzo VJ, Giedzinski E, Baker M, Suarez T, Izadi A, Lan M, Cho‐Lim J, Tseng B & Limoli CL (2010). The radiosensitivity of satellite cells: cell cycle regulation, apoptosis and oxidative stress. Radiat Res 17, 582–589. [DOI] [PMC free article] [PubMed] [Google Scholar]
- Cantini M & Carraro U (1995). Macrophage‐released factor stimulates selectively myogenic cells in primary muscle culture. J Neuropathol Exp Neurol 54, 121–128. [DOI] [PubMed] [Google Scholar]
- Cantini M, Massimino ML, Bruson A, Catani C, Dalla Libera L & Carraro U (1994). Macrophages regulate proliferation and differentiation of satellite cells. Biochem Biophys Res Commun 202, 1688–1696. [DOI] [PubMed] [Google Scholar]
- Castiglioni A, Corna G, Rigamonti E, Basso V, Vezzoli M, Monno A, Almada AE, Mondino A, Wagers AJ, Manfredi AA & Rovere‐Querini P (2015). FOXP3+ T cells recruited to sites of sterile skeletal muscle injury regulate the fate of satellite cells and guide effective tissue regeneration. PLoS One 10, e0128094. [DOI] [PMC free article] [PubMed] [Google Scholar]
- Chazaud B (2014). Macrophages: supportive cells for tissue repair and regeneration. Immunobiology 219, 172–178. [DOI] [PubMed] [Google Scholar]
- Christov C, Chrétien F, Abou‐Khalil R, Bassez G, Vallet G, Authier FJ, Bassaglia Y, Shinin V, Tajbakhsh S, Chazaud B & Gherardi RK (2007). Muscle satellite cells and endothelial cells: close neighbors and privileged partners. Mol Biol Cell 18, 1397–1409. [DOI] [PMC free article] [PubMed] [Google Scholar]
- Clausen BE, Burkhardt C, Reith W, Renkawitz R & Forster I (1999). Conditional gene targeting in macrophages and granulocytes using LysMcre mice. Transgenic Res 8, 265–277. [DOI] [PubMed] [Google Scholar]
- Coates PJ, Rundle JK, Lorimore SA & Wright EG (2008). Indirect macrophage responses to ionizing radiation: implications for genotype‐dependent bystander signaling. Cancer Res 68, 450–456. [DOI] [PubMed] [Google Scholar]
- Colson YL, Li H, Boggs SS, Patrene KD, Johnson PC & Ildstad ST (1996). Durable mixed allogeneic chimerism and tolerance by a nonlethal radiation‐based cytoreductive approach. J Immunol 157, 2820–2829. [PubMed] [Google Scholar]
- Darden EB Jr (1960). Changes in membrane potentials, K content, and fibre structure in irradiated frog sartorius muscle. Am J Physiol 198, 709–714. [DOI] [PubMed] [Google Scholar]
- Dellavalle A, Maroli G, Covarello D, Azzoni E, Innocenzi A, Perani L, Antonini S, Sambasivan R, Brunelli S, Tajbakhsh S & Cossu G (2011). Pericytes resident in postnatal skeletal muscle differentiate into muscle fibres and generate satellite cells. Nat Commun 2, 499. [DOI] [PubMed] [Google Scholar]
- de Prost N, Tucci MR & Melo MF (2010). Assessment of lung inflammation with 18F‐FDG PET during acute lung injury. AJR Am J Roentgenol 195, 292–300. [DOI] [PMC free article] [PubMed] [Google Scholar]
- Down JD, Tarbell NJ, Thames HD & Mauch PM (1991). Syngeneic and allogeneic bone marrow engraftment after total body irradiation: dependence on dose, dose rate, and fractionation. Blood 77, 661–669. [PubMed] [Google Scholar]
- Duran‐Struuck R, Hartigan A, Clouthier SG, Dyson MC, Lowler K, Gatza E, Tawara I, Toubai T, Weisiger E, Hugunin K, Reddy P & Wilkinson JE (2008). Differential susceptibility of C57BL/6NCr and B6.Cg‐Ptprca mice to commensal bacteria after whole‐body irradiation in translational bone marrow transplant studies. J Transl Med 6, 10. [DOI] [PMC free article] [PubMed] [Google Scholar]
- Finkelstein JN, Johnston CJ, Baggs R & Rubin P (1994). Early alterations in extracellular matrix and transforming growth factor beta gene expression in mouse lung indicative of late radiation fibrosis. Int J Radiat Oncol Biol Phys 28, 621–631. [DOI] [PubMed] [Google Scholar]
- Fry CS, Lee JD, Mula J, Kirby TJ, Jackson JR, Liu F, Yang L, Mendias CL, Dupont‐Versteegden EE, McCarthy JJ & Peterson CA (2015). Inducible depletion of satellite cells in adult, sedentary mice impairs muscle regenerative capacity without affecting sarcopenia. Nat Med 21, 76–80. [DOI] [PMC free article] [PubMed] [Google Scholar]
- Gamelli RL, Liu H, He LK & Hofmann CA (1996). Augmentations of glucose uptake and glucose transporter‐1 in macrophages following thermal injury and sepsis in mice. J Leukoc Biol 59, 639–647. [DOI] [PubMed] [Google Scholar]
- García‐Prat L & Muñoz‐Cánoves P (2017). Aging, metabolism and stem cells: Spotlight on muscle stem cells. Mol Cell Endocrinol 445, 109–117. [DOI] [PubMed] [Google Scholar]
- Ghosh SN, Wu Q, Mäder M, Fish BL, Moulder JE, Jacobs ER, Medhora M & Molthen RC (2009). Vascular injury after whole thoracic x‐ray irradiation in the rat. Int J Radiat Oncol Biol Phys 74, 192–199. [DOI] [PMC free article] [PubMed] [Google Scholar]
- Giacalone A, Quitadamo D, Zanet E, Berretta M, Spina M & Tirelli U (2013). Cancer‐related fatigue in the elderly. Support Care Cancer 21, 2899–2911. [DOI] [PubMed] [Google Scholar]
- Glaudemans AWJM, de Vries EFJ, Galli F, Dierckx RAJO, Slart RHJA & Signore A (2013). The Use of 18F‐FDG‐PET/CT for diagnosis and treatment monitoring of inflammatory and infectious diseases. Clin Dev Immunol 2013, 623036. [DOI] [PMC free article] [PubMed] [Google Scholar]
- Goljanek‐Whysall K, Iwanejko LA, Vasilaki A, Pekovic‐Vaughan V & McDonagh B (2016). Ageing in relation to skeletal muscle dysfunction: redox homoeostasis to regulation of gene expression. Mamm Genome 27, 341–357. [DOI] [PMC free article] [PubMed] [Google Scholar]
- Gondin J, Théret M, Duhamel G, Pegan K, Mathieu JR, Peyssonnaux C, Cuvellier S, Latroche C, Chazaud B, Bendahan D & Mounier R (2015). Myeloid HIFs are dispensable for resolution of inflammation during skeletal muscle regeneration. J Immunol 194, 3389–3399. [DOI] [PubMed] [Google Scholar]
- Gulati AK (1987). The effect of X‐irradiation on skeletal muscle regeneration in the adult rat. J Neurol Sci 78, 111–120. [DOI] [PubMed] [Google Scholar]
- Haddock B, Holm S, Poulsen JM, Enevoldsen LH, Larsson HBW, Kjær A & Suetta C (2017). Assessment of muscle function using hybrid PET/MRI: comparison of 18F‐FDG PET and T2‐weighted MRI for quantifying muscle activation in human subjects. Eur J Nucl Med Mol Imaging 44, 704–711. [DOI] [PMC free article] [PubMed] [Google Scholar]
- Hardee JP, Puppa MJ, Fix DK, Gao S, Hetzler KL, Bateman TA & Carson JA (2014). The effect of radiation dose on mouse skeletal muscle remodeling. Radiol Oncol 48, 247–256. [DOI] [PMC free article] [PubMed] [Google Scholar]
- Hardy D, Besnard A, Latil M, Jouvion G, Briand D, Thépenier C, Pascal Q, Guguin A, Gayraud‐Morel B, Cavaillon JM, Tajbakhsh S, Rocheteau P & Chrétien F (2016). Comparative study of injury models for studying muscle regeneration in mice. PLoS One 11, e0147198. [DOI] [PMC free article] [PubMed] [Google Scholar]
- Hawke TJ & Garry DJ (2001). Myogenic satellite cells: physiology to molecular biology. J Appl Physiol 91, 534–551. [DOI] [PubMed] [Google Scholar]
- Hyafil F, Cornily JC, Rudd JH, Machac J, Feldman LJ & Fayad ZA (2009). Quantification of inflammation within rabbit atherosclerotic plaques using the macrophage‐specific CT contrast agent N1177: a comparison with 18F‐FDG PET/CT and histology. J Nucl Med 50, 959–965. [DOI] [PubMed] [Google Scholar]
- Joe AW, Yi L, Natarajan A, Le Grand F, So L, Wang J, Rudnicki MA & Rossi FM (2010). Muscle injury activates resident fibro/adipogenic progenitors that facilitate myogenesis. Nat Cell Biol 12, 153–163. [DOI] [PMC free article] [PubMed] [Google Scholar]
- Johnston CJ, Williams JP, Okunieff P & Finkelstein JN (2002). Radiation‐induced pulmonary fibrosis: examination of chemokine and chemokine receptor families. Radiat Res 157, 256–265. [DOI] [PubMed] [Google Scholar]
- Jurdana M, Cemazar M, Pegan K & Mars T (2013). Effect of ionizing radiation on human skeletal muscle precursor cells. Radiol Oncol 47, 376–381. [DOI] [PMC free article] [PubMed] [Google Scholar]
- Kemppainen J, Fujimoto T, Kalliokoski KK, Viljanen T, Nuutila P & Knuuti J (2002). Myocardial and skeletal muscle glucose uptake during exercise in humans. J Physiol 542, 403–412. [DOI] [PMC free article] [PubMed] [Google Scholar]
- Kostallari E, Baba‐Amer Y, Alonso‐Martin S, Ngoh P, Relaix F, Lafuste P & Gherardi RK (2015). Pericytes in the myovascular niche promote post‐natal myofibre growth and satellite cell quiescence. Development 142, 1242–1253. [DOI] [PubMed] [Google Scholar]
- Kuswanto W, Burzyn D, Panduro M, Wang KK, Jang YC, Wagers AJ, Benoist C & Mathis D (2016). Poor repair of skeletal muscle in aging mice reflects a defect in local, interleukin‐33‐dependent accumulation of regulatory T cells. Immunity 44, 355–367. [DOI] [PMC free article] [PubMed] [Google Scholar]
- Labar B, Bogdanić V, Nemet D, Mrsić M, Vrtar M, Grgić‐Markulin L, Kalenić S, Vujasinović S, Presecki V, Jakić‐Razumović J (1992). Total body irradiation with or without lung shielding for allogeneic bone marrow transplantation. Bone Marrow Transplant 9, 343–347. [PubMed] [Google Scholar]
- Latroche C, Gitiaux C, Chrétien F, Desguerre I, Mounier R & Chazaud B (2015). Skeletal muscle microvasculature: a highly dynamic lifeline. Physiology (Bethesda) 30, 417–427. [DOI] [PubMed] [Google Scholar]
- Lawrence T & Natoli G (2011). Transcriptional regulation of macrophage polarization: enabling diversity with identity. Nat Rev Immunol 11, 750–761. [DOI] [PubMed] [Google Scholar]
- Lepper C, Partridge TA & Fan CM (2011). An absolute requirement for Pax7‐positive satellite cells in acute injury‐induced skeletal muscle regeneration. Development 138, 3639–3646. [DOI] [PMC free article] [PubMed] [Google Scholar]
- Liu G, Ma H, Qiu L, Li L, Cao Y, Ma J & Zhao Y (2011). Phenotypic and functional switch of macrophages induced by regulatory CD4+CD25+ T cells in mice. Immunol Cell Biol 89, 130–142. [DOI] [PubMed] [Google Scholar]
- Lorimore SA, Coates PJ, Scobie GE, Milne G & Wright EG (2001). Inflammatory‐type responses after exposure to ionizing radiation in vivo: a mechanism for radiation‐induced bystander effects? Oncogene 20, 7085–7095. [DOI] [PubMed] [Google Scholar]
- Mirza R, DiPietro LA & Koh TJ (2009). Selective and specific macrophage ablation is detrimental to wound healing in mice. Am J Pathol 175, 2454–2462. [DOI] [PMC free article] [PubMed] [Google Scholar]
- Mocsai A, Zhou M, Meng F, Tybulewicz VL & Lowell CA (2002). Syk is required for integrin signaling in neutrophils. Immunity 16, 547–558. [DOI] [PubMed] [Google Scholar]
- Mounier R, Théret M, Arnold L, Cuvellier S, Bultot L, Göransson O, Sanz N, Ferry A, Sakamoto K, Foretz M, Viollet B & Chazaud B (2013). AMPKα1 regulates macrophage skewing at the time of resolution of inflammation during skeletal muscle regeneration. Cell Metab 18, 251–264. [DOI] [PubMed] [Google Scholar]
- Murphy J, Summer R, Wilson AA, Kotton DN & Fine A (2008). The prolonged life‐span of alveolar macrophages. Am J Respir Cell Mol Biol 38, 380. [DOI] [PMC free article] [PubMed] [Google Scholar]
- Murphy MM, Lawson JA, Mathew SJ, Hutcheson DA & Kardon G (2011). Satellite cells, connective tissue fibroblasts and their interactions are crucial for muscle regeneration. Development 138, 3625–3637. [DOI] [PMC free article] [PubMed] [Google Scholar]
- Nishijo K, Hosoyama T, Bjornson CR, Schaffer BS, Prajapati SI, Bahadur AN, Hansen MS, Blandford MC, McCleish AT, Rubin BP, Epstein JA, Rando TA, Capecchi MR & Keller C (2009). Biomarker system for studying muscle, stem cells, and cancer in vivo . FASEB J 23, 2681–2690. [DOI] [PMC free article] [PubMed] [Google Scholar]
- Olive M, Blanco R, Rivera R, Cinos C & Ferrer I (1995). Cell death induced by gamma irradiation of developing skeletal muscle. J Anat 187, 127. [PMC free article] [PubMed] [Google Scholar]
- Peault B, Rudnicki M, Torrente Y, Cossu G, Tremblay JP, Partridge T, Gussoni E, Kunkel LM & Huard J (2007). Stem and progenitor cells in skeletal muscle development, maintenance, and therapy. Mol Ther 15, 867. [DOI] [PubMed] [Google Scholar]
- Perdiguero E, Sousa‐Victor P, Ruiz‐Bonilla V, Jardí M, Caelles C, Serrano AL & Muñoz‐Cánoves P (2011). p38/MKP‐1‐regulated AKT coordinates macrophage transitions and resolution of inflammation during tissue repair. J Cell Biol 195, 307–322. [DOI] [PMC free article] [PubMed] [Google Scholar]
- Phelan JN & Gonyea WJ (1997). Effect of radiation on satellite cell activity and protein expression in overloaded mammalian skeletal muscle. Anat Rec 247, 179–188. [DOI] [PubMed] [Google Scholar]
- Rosenblatt JD & Parry DJ (1993). Adaptation of rat extensor digitorum longus muscle to gamma irradiation and overload. Pflugers Arch 423, 255–264. [DOI] [PubMed] [Google Scholar]
- Rosenblatt JD & Parry DJ (1992). Gamma irradiation prevents compensatory hypertrophy of overloaded mouse extensor digitorum longus muscle. J Appl Physiol 73, 2538–2543. [DOI] [PubMed] [Google Scholar]
- Rosenblatt JD, Yong D & Parry DJ (1994). Satellite cell activity is required for hypertrophy of overloaded adult rat muscle. Muscle Nerve 17, 608–613. [DOI] [PubMed] [Google Scholar]
- Ruffell D, Mourkioti F, Gambardella A, Kirstetter P, Lopez RG, Rosenthal N & Nerlov C (2009). A CREB‐C/EBPβ cascade induces M2 macrophage‐specific gene expression and promotes muscle injury repair. Proc Natl Acad Sci USA 106, 17475–17480. [DOI] [PMC free article] [PubMed] [Google Scholar]
- Saclier M, Yacoub‐Youssef H, Mackey AL, Arnold L, Ardjoune H, Magnan M, Sailhan F, Chelly J, Pavlath GK, Mounier R, Kjaer M & Chazaud B (2013). Differentially activated macrophages orchestrate myogenic precursor cell fate during human skeletal muscle regeneration. Stem Cells 31, 384–396. [DOI] [PubMed] [Google Scholar]
- Sambasivan R, Yao R, Kissenpfennig A, Van Wittenberghe L, Paldi A, Gayraud‐Morel B, Guenou H, Malissen B, Tajbakhsh S & Galy A (2011). Pax7‐expressing satellite cells are indispensable for adult skeletal muscle regeneration. Development 138, 3647–3656. [DOI] [PubMed] [Google Scholar]
- Schiaffino S, Pereira MG, Ciciliot S & Rovere‐Querini P (2017). Regulatory T cells and skeletal muscle regeneration. FEBS J 284, 517–524. [DOI] [PubMed] [Google Scholar]
- Serrano AL, Baeza‐Raja B, Perdiguero E, Jardi M & Munoz‐Canoves P (2008). Interleukin‐6 is an essential regulator of satellite cell‐mediated skeletal muscle hypertrophy. Cell Metab 7, 33–44. [DOI] [PubMed] [Google Scholar]
- Signore A & Glaudemans AW (2011). The molecular imaging approach to image infections and inflammation by nuclear medicine techniques. Ann Nucl Med 25, 681–700. [DOI] [PubMed] [Google Scholar]
- Slimani L, Oikonen V, Hällsten K, Savisto N, Knuuti J, Nuutila P & Iozzo P (2006). Exercise restores skeletal muscle glucose delivery but not insulin‐mediated glucose transport and phosphorylation in obese subjects. J Clin Endocrinol Metab 91, 3394–3403. [DOI] [PMC free article] [PubMed] [Google Scholar]
- Soderling CC, Song CW, Blazar BR & Vallera DA (1985). A correlation between conditioning and engraftment in recipients of MHC‐mismatched T cell‐depleted murine bone marrow transplants. J Immunol 135, 941–946. [PubMed] [Google Scholar]
- Tashiro M, Fujimoto T, Itoh M, Kubota K, Fujiwara T, Miyake M, Watanuki S, Horikawa E, Sasaki H & Ido T (1999). 18F‐FDG PET imaging of muscle activity in runners. J Nucl Med 40, 70–76. [PubMed] [Google Scholar]
- Tidball JG (2005). Inflammatory processes in muscle injury and repair. Am J Physiol Regul Integr Comp Physiol 288, R345–R353. [DOI] [PubMed] [Google Scholar]
- Tidball JG & Wehling‐Henricks M (2007). Macrophages promote muscle membrane repair and muscle fibre growth and regeneration during modified muscle loading in mice in vivo . J Physiol 578, 327–336. [DOI] [PMC free article] [PubMed] [Google Scholar]
- Tidball JG & Villalta SA (2010). Regulatory interactions between muscle and the immune system during muscle regeneration. Am J Physiol Regul Integr Comp Physiol 298, R1173–R1187. [DOI] [PMC free article] [PubMed] [Google Scholar]
- Tonkin J, Temmerman L, Sampson RD, Gallego‐Colon E, Barberi L, Bilbao D, Schneider MD, Musarò A & Rosenthal N (2015). Monocyte/macrophage‐derived IGF‐1 orchestrates murine skeletal muscle regeneration and modulates autocrine polarization. Mol Ther 23, 1189–1200. [DOI] [PMC free article] [PubMed] [Google Scholar]
- Uezumi A, Fukada S, Yamamoto N, Takeda S & Tsuchida K (2010). Mesenchymal progenitors distinct from satellite cells contribute to ectopic fat cell formation in skeletal muscle. Nat Cell Biol 12, 143–152. [DOI] [PubMed] [Google Scholar]
- Vaidyanathan S, Patel CN, Scarsbrook AF & Chowdhury FU (2015). FDG PET/CT in infection and inflammation‐current and emerging clinical applications. Clin Radiol 70, 787–800. [DOI] [PubMed] [Google Scholar]
- Varga T, Mounier R, Gogolak P, Poliska S, Chazaud B & Nagy L (2013). Tissue LyC6‐macrophages are generated in the absence of circulating LyC6‐ monocytes and Nur77 in a model of muscle regeneration. J Immunol 191, 5695–5701. [DOI] [PubMed] [Google Scholar]
- Varga T, Mounier R, Horvath A, Cuvellier S, Dumont F, Poliska S, Ardjoune H, Juban G, Nagy L & Chazaud B (2016a). Highly Dynamic transcriptional signature of distinct macrophage subsets during sterile inflammation, resolution, and tissue repair. J Immunol 196, 4771–4782. [DOI] [PubMed] [Google Scholar]
- Varga T, Mounier R, Patsalos A, Gogolák P, Peloquin M, Horvath A, Pap A, Daniel B, Nagy G, Pintye E, Póliska S, Cuvellier S, Ben Larbi S, Sansbury B, Spite M, Brown C, Chazaud B & Nagy L (2016b). PPARγ in repair macrophages controls GDF3 and skeletal muscle regeneration. Immunity 45, 1038–1051. [DOI] [PMC free article] [PubMed] [Google Scholar]
- Villalta SA, Rosenthal W, Martinez L, Kaur A, Sparwasser T, Tidball JG, Margeta M, Spencer MJ & Bluestone JA (2014). Regulatory T cells suppress muscle inflammation and injury in muscular dystrophy. Sci Transl Med 6, 258ra142. [DOI] [PMC free article] [PubMed] [Google Scholar]
- von Maltzahn J, Jones AE, Parks RJ & Rudnicki MA (2013). Pax7 is critical for the normal function of satellite cells in adult skeletal muscle. Proc Natl Acad Sci USA 110, 16474–16479. [DOI] [PMC free article] [PubMed] [Google Scholar]
- Wakeford S, Watt DJ & Partridge TA (1991). X‐irradiation improves mdx mouse muscle as a model of myofibre loss in DMD. Muscle Nerve 14, 42–50. [DOI] [PubMed] [Google Scholar]
- Walston JD (2012). Sarcopenia in older adults. Curr Opin Rheumatol 24, 623–627. [DOI] [PMC free article] [PubMed] [Google Scholar]
- Wang H, Melton DW, Porter L, Sarwar ZU, McManus LM & Shireman PK (2014). Altered macrophage phenotype transition impairs skeletal and muscle regeneration. Am J Pathol 184, 1167–1184. [DOI] [PMC free article] [PubMed] [Google Scholar]
- Wester HJ (2007). Nuclear imaging probes: from bench to bedside. Clin Cancer Res 13, 3470–3481. [DOI] [PubMed] [Google Scholar]
- Wolfe RR (2006). The underappreciated role of muscle in health and disease. Am J Clin Nutr 84, 475–482. [DOI] [PubMed] [Google Scholar]
- Wu S, Wu Y & Capecchi MR (2006). Motoneurons and oligodendrocytes are sequentially generated from neural stem cells but do not appear to share common lineage‐restricted progenitors in vivo . Development 133, 581–590. [DOI] [PubMed] [Google Scholar]
- Zachariah B, Balducci L, Venkattaramanabalaji GV, Casey L, Greenberg HM & DelRegato JA (1997). Radiotherapy for cancer patients aged 80 and older: a study of effectiveness and side effects. Int J Radiat Oncol Biol Phys 39, 1125–1129. [DOI] [PubMed] [Google Scholar]