

Abstract
Background
Accumulation of problems in physical, psychological, cognitive, or social functioning is characteristic for frail individuals. Using a four-domain approach of frailty, this study explored how sociodemographic and lifestyle factors, life events and health are associated with frailty.
Methods
The study sample included 4019 men and women (aged 40–81 years) examined during the fifth round (2008–2012) of the Doetinchem Cohort Study. Four domains of frailty were considered: physical (≥4 of 8 criteria: unintentional weight loss, exhaustion, strength, perceived health, walking, balance, hearing and vision impairments), psychological (2 criteria: depressive symptoms, mental health), cognitive (<10th percentile on global cognitive functioning), and social frailty (≥2 of 3 criteria: loneliness, social support, social participation). Logistic regression was used to study the cross-sectional association of sociodemographic factors, lifestyle, life events and chronic diseases with frailty domains.
Results
About 17% of the population was frail on one or more domains. Overlap between the frailty domains was limited since 82% of the frail population was frail on one domain only. Low educated respondents were at higher risk of being psychologically and socially frail. Having multiple diseases was associated with a higher risk of being physically and psychologically frail. Being physically active was consistently associated with a lower risk of frailty on each of the four domains. Short or long sleep duration was associated with a higher risk of being physically, psychologically, and socially frail.
Conclusions
Sociodemographic factors, lifestyle and multimorbidity contributed differently to the four frailty domains. It is important to consider multiple frailty domains since this helps to identify different groups of frail people, and as such to provide tailored care and support. Lifestyle factors including physical activity, smoking and sleep duration were associated with multiple domains of frailty.
Electronic supplementary material
The online version of this article doi: 10.1186/s12877-017-0595-0) contains supplementary material, which is available to authorized users.
Keywords: Frailty, Multidimensional, Lifestyle, Physical activity, Sleep, Prospective cohort
Background
With ageing, changes occur in physical, psychological, cognitive, and social functioning. Accumulation of problems in one or more of these domains of functioning is characteristic for frail people. Originally, frailty was mainly focused on the physical problems that older people encounter, such as in Fried’s popular ‘phenotype of frailty’ [1]. Broader definitions of frailty, looking beyond physical functioning, have now been put forward [2–4] one of which is the definition by Gobbens et al. [5]. According to them, frailty is ‘a dynamic state affecting an individual who experiences losses in one or more domains of human functioning (physical, psychological, social) caused by the influence of a range of variables and which increases the risk of adverse outcomes’. A multidimensional approach to frailty is coherent with the interdisciplinary diagnostic process used in the Comprehensive Geriatric Assessment for frail older people, which also examines physical, mental (including both psychological and cognitive functioning), and social functioning [6, 7].
Frailty often leads to restrictions in mobility and reduced self-reliance, and a greater risk of clinically significant adverse outcomes such as hospitalization, institutionalization and mortality [1, 4, 8–10]. In several European countries it is government policy to stimulate older people to participate in society and to live at home for as long as possible [11, 12]. Primary prevention of frailty is therefore needed, directed at both delaying the onset of frailty and slowing down the frailty process as prevention of frailty might eventually lead to prevention or postponement of hospitalization and institutionalization of elderly people. Insight in factors that are associated with the presence of frailty is a first step to assist the identification of potentially vulnerable groups. For the physically frail, a series of socio-demographic, lifestyle, and health-related factors have been shown to be associated with frailty, such as age, female sex, cardiovascular diseases, multimorbidity, BMI, and smoking [13]. As part of a broad frailty definition, little is known about factors associated with the psychological and social domains of frailty. Especially, the association between lifestyle factors and frailty has rarely been studied [13].
Recently, the concept of cognitive frailty has been proposed [14]. Since there is increasing support for the idea of cognitive frailty being a separate frailty domain [15, 16], a four-domain approach of frailty was adopted for the current study including the physical, cognitive, psychological and social domains of frailty. It was recently shown that the overlap between these frailty domains was limited, which implicates that the domains largely entail distinct populations and frailty prevention may target multiple frailty domains [17].
In this study, we explored how sociodemographic factors, lifestyle factors, life events, biological risk factors and chronic diseases were associated with physical, psychological, cognitive, and social frailty in a population-based study of men and women aged 40–81 years.
Methods
Study population
Data of men and women aged 40–81 years participating in the Doetinchem Cohort Study were used for the current study. The Doetinchem Cohort Study is an ongoing population-based cohort study aimed to study the impact of (changes in) lifestyle and biological risk factors on various aspects of health and wellbeing of men and women, aged 20–59 years at baseline, from the Netherlands. A total of 12,405 participants (response rate 62%) were first examined in 1987–1991 (round 1). Of those, a random sample of 7768 participants was re-invited to be examined in 1993–1997 (round 2, n = 6113), 1998–2002 (round 3, n = 4916), 2003–2007 (round 4, n = 4520) and 2008–2012 (round 5, n = 4019). The response rates for all follow-up measurements varied between 75% and 80%. For the current study, we used data from the fifth examination round. Written informed consent was obtained from all participants. The Medical Ethics Committees of the Netherlands Organization of Applied Scientific Research and the University of Utrecht approved the study. Full details of the study have been reported elsewhere [18].
Conceptual model of frailty
The integral conceptual model of frailty which includes the physical, psychological, and social domains of frailty was the basis of our study [19]. In the original model, the psychological domain included feelings of anxiety and depression, a decline in coping, and a decline in cognitive functioning. For the current study, the conceptual model was extended with a fourth domain, being cognitive frailty (Fig. 1) [14]. The rationale for adding a fourth domain was that limitations in functioning due to anxious and depressive feelings (i.e. the psychological domain) are considered to be fundamentally different from limitations in functioning due to e.g. memory problems (i.e. cognitive functioning). In addition, we noticed that cognitive functioning was previously not consistently positioned in one domain of frailty; it belonged either to the physical or the psychological domain [1, 7, 19]. Furthermore, we added several potential determinants of frailty to the model, including health care and support, and providing informal care (Fig. 1). Inadequate formal care or support for chronic diseases or acute disorders may lead to a strong deterioration of physical, cognitive, psychological functioning and increase the risk to become frail. Informal caregiving is also related to negative health outcomes [20].
Fig. 1.
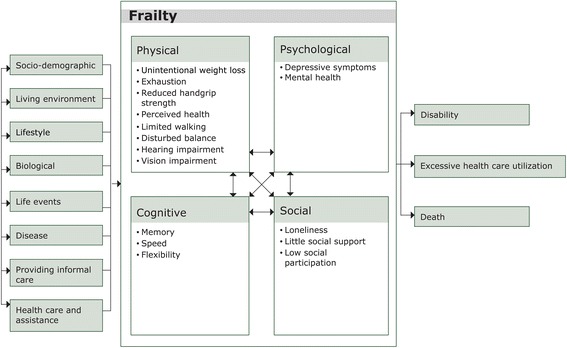
Adapted version of the integral conceptual model of frailty, based on Gobbens [19]
Operationalization of frailty domains
The frailty criteria per domain were based on the Tilburg Frailty Indicator (TFI, Table 1) [21]. The original TFI was not included in our questionnaires. For each item on the TFI we identified the best possible proxy in our questionnaires and data-collection. A detailed description of the criteria can be found in Additional file 1. Participants were considered to be physically frail if they fulfilled ≥4 of 8 frailty criteria described by Gobbens [21, 22]. Participants were considered to be cognitively frail when scoring <10th percentile on a global cognitive functioning score based on memory, speed, and flexibility. Cognitive scores were adjusted for level of education and number of tests performed during follow-up. Psychological frailty was defined as fulfilling both criteria for depression [23] and for poor mental health [24]. Social frailty was defined as meeting ≥2 of 3 criteria using the Loneliness scale [25], Social Support List-12 [26] and a questionnaire about social participation from the Dutch Municipal Health Services Elderly Monitor [27]. Overall frailty was defined as all participants being frail on one or more domains.
Table 1.
Overview of the criteria used to operationalize physical, cognitive, psychological, and social frailty
| Domains | Criteria | Cut-off | Based on |
|---|---|---|---|
| Physical frailty | - Unintentional weight loss - Exhaustion - Low handgrip strength - Perceived health - Limited in walking - Disturbed balance - Hearing impairment - Vision impairment |
≥4 criteria | - Unintentional weight loss: >5% weight loss between round 4 and 5 and not being on a diet - Exhaustion: 2 questions of the Center for Epidemiologic Studies Depression scale (CES-D) [23] - Handgrip strength: dynamometer, sex-specific cut-off stratified for BMI [1] - Perceived health: one question of 36-Item Short-Form Health Survey (SF-36) [24, 62] - Self-reported 100 m walking - Tandem Stand Balance Test - 3 questions regarding hearing - 3 questions regarding vision |
| Cognitive frailty | - Low global cognitive functioning | <10th percentile | Global cognitive functioning score based on tests for memory, speed and flexibility [63]: 15 Words Verbal Learning Test Stroop Colour–Word Test Word Fluency Test Letter Digit Substitution Test |
| Psychological frailty | - Depressive symptoms - Mental health |
=2 criteria | - Center for Epidemiologic Studies Depression scale (CES-D) [23] - Mental Health Inventory 5 (MHI-5) [24, 64] |
| Social frailty | - Loneliness - Low social support - Limited social participation |
≥2 criteria | - Loneliness Scale [25, 65] - Social Support List-12 (SSL-12) [26] - Questionnaire Dutch Elderly Monitor [27] |
Other measurements
Socio-demographic factors
Level of education was categorized into low (intermediate secondary education or less), intermediate (intermediate vocational and higher secondary education) and high (higher vocational education or university). Work status was defined as having a paid job (including salaried employment and self-employed) or being unemployed. Household composition was defined as living alone or not living alone (living with a partner, with children, with parents or other adults). Being married also included registered partnership.
Lifestyle
For defining smoking status, we distinguished current smokers and non-smokers. To establish whether or not people had a healthy diet, the World Health Organisation’s dietary recommendations for the prevention of chronic disease were applied [28]. Score on the healthy diet indicator ranged from 0 to 9 and was based on the sum of the number of nutrients (out of a group of seven nutrients) and the number of products from two food groups for which intake was within the recommended range [29]. Being physically active was defined as adherence to the Dutch physical activity guideline, which recommends 30 min of moderate to vigorous physical activity per day on at least 5 days per week [30]. The average sleep duration per 24-h period was assessed in four categories: 5 h or less, 6 h, 7 or 8 h, and 9 h or more. Alcohol consumption was assessed in four categories: never, not anymore, <1 glass a week, and ≥1 glass a week [31].
Life events
We determined recent life events (i.e. widowhood, divorce) by evaluating potential changes in marital status between round 4 and round 5. Adults who were married in round 4 and became a widow/widower in round 5 were categorized as being widowed; those who were married in round 4 and were divorced in round 5 were categorized as being divorced.
Biological risk factors and chronic disease
BMI was calculated based on measured body weight and height and categorized into normal weight <25 kg/m2, overweight 25–29.9 kg/m2, and obesity ≥30 kg/m2 [32]. Multimorbidity was defined as having two or more chronic diseases [33] out of the following five self-reported diseases: diabetes, cancer, myocardial infarction, cerebrovascular accident, and chronic respiratory symptoms.
Statistical analyses
Descriptive analyses were carried out for the total study population and for the physically, cognitively, psychologically and socially frail separately. For each frailty domain, we used logistic regression models to explore the factors associated with frailty. Odds ratios and 95% confidence intervals of two multivariable models are shown. The first model was adjusted for sociodemographic factors (model 1) and the second model was adjusted for all sociodemographic factors, lifestyle, life events, biological risk factors and chronic diseases (model 2). All analyses were carried out in SAS 9.3 (SAS Institute Inc., Cary, NC, USA).
Results
In our population aged 40–81 years, 2.7% was physically frail, 6.3% was psychologically frail, 7.7% was cognitively frail, and 4.1% was socially frail (Table 2). Women were more frequently physically and psychologically frail (63.6% and 68.7%) than men (36.4% and 31.3% respectively), whereas men were more often cognitively frail than women (68.8% vs. 31.2%). The mean age of those with physical, cognitive and social frailty was higher compared to that of the total study population. Each of the domains of frailty showed a higher percentage of respondents with a low educational level compared to the total study population.
Table 2.
Characteristics of the study population and persons being physically, psychologically, cognitively, and socially frail
| Study population (N = 4019) | Physically frail (N = 110; 2.7%) | Psychologically frail (N = 252; 6.3%) | Cognitively frail (N = 311; 7.7%) | Socially frail (N = 166; 4.1%) | |
|---|---|---|---|---|---|
| Socio-demographic | |||||
| Women | 2118 (52.7%) | 70 (63.6%) | 173 (68.7%) | 97 (31.2%) | 81 (48.8%) |
| Age, yr | 59.9 (SD 9.6) | 68.7 (SD 9.1) | 59.3 (SD 9.9) | 68.8 (SD 8.0) | 63.0 (SD 10.4) |
| Level of education | |||||
| Low | 1657 (41.2%) | 76 (69.1%) | 142 (56.3%) | 154 (49.5%) | 94 (56.6%) |
| Intermediate | 1320 (32.9%) | 14 (12.7%) | 67 (26.6%) | 85 (27.3%) | 47 (28.3%) |
| High | 1042 (25.9%) | 20 (18.2%) | 43 (17.1%) | 72 (23.2%) | 25 (15.1%) |
| Married | 3211 (80.3%) | 63 (57.3%) | 151 (60.4%) | 232 (75.3%) | 108 (65.1%) |
| Living alone | 555 (13.9%) | 38 (34.6%) | 63 (25.2%) | 68 (22.2%) | 43 (25.9%) |
| Paid job | 2024 (50.5%) | 7 (6.4%) | 113 (44.8%) | 52 (16.8%) | 59 (35.8%) |
| Lifestyle | |||||
| Current smoking | 682 (17.1%) | 30 (27.8%) | 77 (30.7%) | 51 (16.6%) | 34 (20.7%) |
| Healthy diet, score (0–7) | 2.9 (SD 1.2) | 2.6 (SD 1.1) | 2.9 (SD 1.1) | 2.8 (SD 1.2) | 2.9 (SD 1.2) |
| Physically active | 3112 (77.5%) | 46 (41.8%) | 170 (67.5%) | 212 (68.4%) | 108 (65.1%) |
| Sleep duration | |||||
| ≤5 h | 163 (4.1%) | 12 (11.0%) | 29 (11.5%) | 15 (4.9%) | 17 (10.3%) |
| 6 h | 703 (17.6%) | 24 (22.0%) | 71 (28.3%) | 52 (16.8%) | 36 (21.7%) |
| 7 or 8 h | 2880 (72.2%) | 56 (51.4%) | 127 (50.6%) | 208 (67.3%) | 95 (57.2%) |
| ≥9 h | 245 (6.1%) | 17 (15.6%) | 24 (9.6%) | 34 (11.0%) | 18 (10.8%) |
| Alcohol consumption | |||||
| Never | 399 (10.0%) | 28 (25.5%) | 40 (15.9%) | 39 (12.6%) | 21 (12.7%) |
| Not anymore | 124 (3.1%) | 11 (10.0%) | 16 (6.3%) | 15 (4.8%) | 9 (5.5%) |
| Low (<1 glass/wk) | 849 (21.2%) | 23 (20.9%) | 61 (24.2%) | 54 (17.4%) | 39 (23.6%) |
| Frequent (≥1 glasses/wk) | 2630 (65.7%) | 48 (43.6%) | 135 (53.6%) | 202 (65.2%) | 96 (58.2%) |
| Life events | |||||
| Widowed | 74 (2.0%) | 4 (4.0%) | 12 (5.3%) | 7 (2.5%) | 4 (2.6%) |
| Divorced | 66 (1.7%) | 1 (1.0%) | 10 (4.4%) | 0 (0.0%) | 7 (4.6%) |
| Biological risk factors and chronic disease | |||||
| BMI, kg/m2 | 26.8 (SD 4.2) | 30.0 (SD 6.9) | 27.4 (SD 5.0) | 28.1 (SD 4.4) | 27.1 (SD 4.7) |
| Multimorbiditya | 320 (8.0%) | 43 (39.1%) | 40 (15.9%) | 61 (19.6%) | 26 (15.7%) |
| Frailty | |||||
| Physically frail | 110 (2.7%) | - | 34 (13.5%) | 26 (8.4%) | 19 (11.5%) |
| Psychologically frail | 252 (6.3%) | 34 (31.2%) | - | 31 (10.0%) | 52 (31.3%) |
| Cognitively frail | 311 (7.7%) | 26 (23.6%) | 31 (12.3%) | - | 20 (12.0%) |
| Socially frail | 166 (4.1%) | 19 (17.3%) | 52 (20.6%) | 20 (6.5%) | - |
Frequencies (percentage) or means (SD) are presented
Note: BMI body mass index, SD standard deviation
aMultimorbidity was defined as having two or more conditions out of diabetes, cancer, myocardial infarction, cerebrovascular accident, and chronic respiratory symptoms
17.1% of the population was frail on one or more of the domains. Of the frail population, 81.5% was frail on one of the domains, 15.2% was frail on two domains, 2.9% was frail on three domains, and 0.4% was frail on all four domains. The greatest overlap was observed for physical and psychological frailty and for social and psychological frailty (one third of the physically and socially frail being also psychologically frail) (Table 2).
Factors associated with physical, psychological, cognitive, and social frailty
An intermediate level of education, a paid job, a healthy diet, being physically active, and frequent alcohol consumption were associated with a lower risk of being physically frail, whereas, being 70 to 81 years, current smoking, a short sleep duration, and multimorbidity were associated with a higher risk of being physically frail (Table 3). Having a paid job showed the strongest negative association with being physically frail (Odds Ratio (OR) 0.16 (95% Confidence Interval (CI) 0.07–0.41)).
Table 3.
Results of the logistic regression analyses on the associated factors with physical, cognitive, psychological, and social frailty
| Physically frail | Psychologically frail | Cognitively frail | Socially frail | |||||
|---|---|---|---|---|---|---|---|---|
| Variables | Model 1d OR (95% CI) | Model 2e OR (95% CI) | Model 1 OR (95% CI) | Model 2 OR (95% CI) | Model 1 OR (95% CI) | Model 2 OR (95% CI) | Model 1 OR (95% CI) | Model 2 OR (95% CI) |
| Socio-demographic | ||||||||
| Women | 1.10 (0.71 1.68) | 1.67 (1.26 2.21) | 1.90 (1.37 2.63) | 0.29 (0.22 0.39) | 0.26 (0.19 0.36) | 0.69 (0.49 0.95) | 0.59 (0.41 0.85) | |
| Age | ||||||||
| 40–49 yra | 1 | 1 | 1 | - | - | 1 | ||
| 50–59 yra | 1.61 (0.53 4.92) | 1.93 (0.53 7.04) | 1.02 (0.70 1.49) | 1 | 1 | 1.10 (0.65 1.86) | ||
| 60–69 yr | 1.23 (0.40 3.76) | 1.79 (0.48 6.62) | 0.70 (0.44 1.10) | 1.35 (0.89 2.06) | 1.28 (0.82 2.00) | 0.97 (0.53 1.78) | ||
| 70–81 yr | 3.00 (1.00 9.07) | 3.89 (1.05 14.42) | 0.50 (0.29 0.86) | 3.91 (2.50 6.12) | 3.32 (2.06 5.35) | 1.46 (0.76 2.80) | ||
| Level of education | ||||||||
| Low | 1.58 (0.94 2.66) | 0.88 (0.49 1.57) | 1.88 (1.31 2.71) | 1.52 (1.03 2.24) | 1.49 (1.08 2.06) | 2.24 (1.42 3.54) | 2.06 (1.27 3.34) | |
| Intermediate | 0.60 (0.30 1.22) | 0.42 (0.21 0.95) | 1.20 (0.80 1.78) | 0.93 (0.60 1.43) | 1.15 (0.81 1.64) | 1.56 (0.95 2.56) | 1.31 (0.77 2.23) | |
| High | 1 | 1 | 1 | 1 | 1 | 1 | 1 | |
| Married | 0.36 (0.18 0.72) | 0.30 (0.21 0.45) | 0.34 (0.22 0.55) | 0.74 (0.42 1.31) | 0.48 (0.28 0.82) | 0.47 (0.26 0.87) | ||
| Living alone | 0.80 (0.38 1.70) | 0.82 (0.52 1.30) | 1.13 (0.62 2.07) | 1.04 (0.57 1.91) | ||||
| Paid job | 0.11 (0.04 0.26) | 0.16 (0.07 0.41) | 0.69 (0.49 0.98) | 0.42 (0.28 0.64) | 0.36 (0.23 0.56) | 0.66 (0.42 1.04) | ||
| Lifestyle | ||||||||
| Current smoking | 2.55 (1.60 4.07) | 3.18 (1.87 5.42) | 1.93 (1.43 2.59) | 1.92 (1.37 2.67) | 1.53 (1.08 2.17) | 1.25 (0.84 1.86) | ||
| Healthy diet | 0.79 (0.67 0.94) | 0.78 (0.64 0.94) | 1.06 (0.95 1.18) | 0.87 (0.78 0.97) | 0.88 (0.79 0.99) | 1.00 (0.88 1.14) | ||
| Physically active | 0.22 (0.14 0.32) | 0.32 (0.20 0.51) | 0.62 (0.47 0.82) | 0.71 (0.52 0.98) | 0.50 (0.38 0.66) | 0.60 (0.40 0.82) | 0.58 (0.42 0.82) | 0.60 (0.41 0.86) |
| Sleep duration | ||||||||
| ≤ 5 h | 2.97 (1.51 5.84) | 2.44 (1.10 5.43) | 4.14 (2.62 6.55) | 4.25 (2.58 6.98) | 1.36 (0.75 2.46) | 2.89 (1.66 5.05) | 3.11 (1.73 5.60) | |
| 6 h | 1.84 (1.11 3.05) | 1.54 (0.86 2.75) | 2.36 (1.73 3.22) | 2.39 (1.72 3.34) | 1.20 (0.85 1.69) | 1.55 (1.04 2.31) | 1.38 (0.89 2.14) | |
| 7 or 8 h | 1 | 1 | 1 | 1 | 1 | 1 | 1 | |
| ≥ 9 h | 2.36 (1.32 4.21) | 1.66 (0.86 3.22) | 2.42 (1.50 3.91) | 2.11 (1.24 3.59) | 1.40 (0.90 2.15) | 1.93 (1.13 3.30) | 1.71 (0.96 3.05) | |
| Alcohol consumption | ||||||||
| Never | 1 | 1 | 1 | 1 | 1 | |||
| Not anymore | 1.38 (0.62 3.06) | 1.46 (0.59 3.60) | 1.61 (0.84 3.06) | 0.86 (0.43 1.73) | 1.14 (0.48 2.68) | |||
| Low (<1 glass/wk) | 0.54 (0.30 0.97) | 0.55 (0.27 1.12) | 0.70 (0.46 1.08) | 0.60 (0.37 0.96) | 0.97 (0.56 1.70) | |||
| Frequent (≥1 glasses/wk) | 0.40 (0.24 0.68) | 0.53 (0.29 0.98) | 0.65 (0.44 0.96) | 0.60 (0.40 0.91) | 0.78 (0.47 1.31) | |||
| Life events | ||||||||
| Widowed | 0.51 (0.17 1.54) | 1.48 (0.74 2.97) | 0.60 (0.25 1.42) | 0.51 (0.17 1.48) | ||||
| Divorcedb | 0.76 (0.10 5.95) | 1.30 (0.62 2.74) | - | 2.15 (0.89 5.17) | ||||
| Biological risk factors and chronic disease | ||||||||
| BMI | ||||||||
| Normal (<25 kg/m2) | 1 | 1 | 1 | 1 | ||||
| Overweight (25–30 kg/m2) | 0.67 (0.39 1.14) | 1.25 (0.92 1.71) | 1.29 (0.94 1.76) | 0.78 (0.54 1.12) | ||||
| Obese (≥30 kg/m2) | 2.12 (1.29 3.47) | 1.24 (0.86 1.80) | 1.80 (1.26 2.59) | 0.72 (0.46 1.14) | ||||
| Multimorbidityc | 4.47 (2.95 6.79) | 3.81 (2.32 6.26) | 2.22 (1.55 3.18) | 1.83 (1.16 2.87) | 1.71 (1.25 2.34) | 1.30 (0.84 2.02) | ||
Odds ratios and 95% confidence intervals are presented in this table. Bold values indicate significance (p < 0.05)
Note: BMI body mass index, OR odds ratio, 95% CI 95% confidence interval
aFor cognitively frail: age categories are 45–59 yr., 60–69 yr., 70–81 yr., 45–59 yr. is the reference category
bFor cognitively frail: no respondents were divorced
cMultimorbidity was defined as having two or more conditions out of diabetes, cancer, myocardial infarction, cerebrovascular accident, and chronic respiratory symptoms
dModel 1 are multivariate models adjusted for socio-demographic variables: sex, age, level of education, marital status, living situation, job status
eModel 2 are multivariate models adjusted for socio-demographic variables, lifestyle, life-events, biological risk factors, and chronic disease (all variables in the table). For model 2 only statistically significant odds ratios are presented to increase readability of the table
A higher risk of being psychologically frail was observed for the following factors: female sex, low educational level, current smoking, short and long sleep duration, and multimorbidity. Being married and being physically active were associated with a lower risk of being psychologically frail. A short sleep duration (≤5 h: 4.25 (95% CI 2.58–6.98); 6 h: 2.39 (95% CI 1.72 3.34)) and a long sleep duration (≥9 h: 2.11 (95% CI 1.24–3.59)) were consistently associated with psychological frailty.
Being 70 to 81 years (0.26 95% CI 0.19–0.36) was the only factor associated with a higher risk of being cognitively frail. Being female, a paid job, a healthy diet, and being physically active were associated with a lower risk of being cognitively frail. A low educational level and short sleep duration were associated with a higher risk of being socially frail. Being a female, being married, and being physically active were associated with a lower risk of being socially frail.
Overall, physical activity was consistently associated with a lower risk of being frail on all four domains. Short sleep duration was consistently associated with three out of the four frailty domains. Living alone, life events, and overweight or obesity were not associated with any of the domains of frailty in the multivariable model.
Frailty on one or more domains
A higher age, a low level of education, current smoking, short and long sleep duration, and multimorbidity were associated with a higher risk to be frail on one or more of the four domains (Table in Additional file 2). Being a female, being married, having a paid job, having a healthy diet, being physically active, and consuming alcohol (≥1 glasses/wk) were associated with a lower risk to be frail on one or more domains.
Discussion
This study suggests that each of the different frailty domains all had a specific combination of associated factors. Most socio-demographic factors and lifestyle were associated with being frail on each of the domains. Being physically active was consistently associated with a lower risk of being frail on each of the four domains. A short or long sleep duration was associated with a higher risk of being physically, psychologically, and socially frail. Other factors associated with one or more domains of frailty were female sex, high age, a low educational level, being married, a paid job, current smoking, a healthy diet, and multimorbidity.
Drawing on the integral conceptual model of frailty, we observed a prevalence of 17.1% among men and women of 40 to 81 years who lived independently. The proportion of frail persons in a population is dependent on the definition of frailty used [34] and on characteristics of the study population. The prevalence of frailty that we observed is relatively low compared to recent other studies based on the integral conceptual model of frailty [21, 22, 35], which could be explained by the large age range of our population and the absence of persons over 81 years of age. The majority of studies directed to frailty have focused solely on people over the age of 65, despite emerging evidence suggesting that frailty begins much earlier than that [36, 37]. Our findings show that frailty may already exist at a relative young age and therefore extend the findings of previous studies.
The relationship between socio-demographic factors and physical frailty has been described in the literature [13, 38]. Like age, sex also contributed differently to each of the frailty domains: being female was associated with a higher risk of being psychologically frail and a lower risk of being cognitively and socially frail. A recent review showed socioeconomic status to be inversely associated with physical frailty [13]. Our findings support a higher risk of being psychologically and socially frail for people with low education. Briefly, socio-demographic factors are important for frailty but their impact varied for each of the domains of frailty.
Lifestyle factors in relation to multiple domains of frailty have not (yet) been studied extensively. An unhealthy lifestyle was previously found to be associated with a higher risk of being physically and socially frail [39–41], and psychologically frail (including cognitive frailty) [39, 40]. However, in these studies lifestyle was assessed by a single item in a self-report questionnaire. Such assessment of lifestyle precludes unambiguous interpretation, because it remains unclear which lifestyle factors participants had in mind when answering the question and what aspect they considered to be unhealthy [40]. Our findings provide novel insight into the specific lifestyle factors (physical activity, smoking, diet, alcohol consumption, sleep) associated with the different domains of frailty. Physical activity was significantly associated with all domains of frailty in our study. A previous study of Strawbridge also considered a broad range of risk factors including lifestyle, in relation to a multidimensional definition of frailty [42]. Being physically inactive, either at one instant or at several measurements over a period of 29 years, was associated with a higher risk of being frail. Other studies confirmed the associations of physical activity with physical frailty and cognitive decline [43, 44], as far as we know no studies included the domains of psychological and social frailty. Our results are in line with earlier studies showing that current smoking was associated with a higher risk of being physically frail [45], and a healthy diet was associated with a lower risk of being physically and cognitively frail [46, 47]. A new insight based on our findings is that short sleep duration was associated with a higher risk to be physically, psychologically and socially frail, and long sleep duration was associated with a higher risk to be psychologically frail. Sleep deprivation contributes to a number of molecular, immune and neural changes that play a role in the development of health problems [48]. Previously, sleep quality and sleep disturbances, but not sleep duration, were reported to be associated with physical frailty [49]. More detailed studies are needed to understand the relation between sleep and each of the frailty domains [50].
In addition to sociodemographic factors and lifestyle, we studied life events, multimorbidity and overweight. Life events were not associated with any of the frailty domains in our study. Other studies reported life events to be associated with a higher risk of being psychologically frail [39–41]. Overweight and obesity were not associated with frailty in our multivariate models, which is comparable to the findings of Strawbridge [42]. Some studies that adjusted for socio-demographic variables and smoking, but not for other lifestyle factors, did report an association between obesity and (physical) frailty [51, 52]. These inconsistent results regarding the relationship between life events and overweight with frailty can be explained by methodological differences such as the definition of life events. Finally, multimorbidity was associated with a higher risk to be physically and psychologically frail, which is in line with other studies [39–42]. Fried illustrated that frailty is distinct but overlapping with comorbidity, with almost 70% of the frail persons also having two or more diseases [8].
In general, there is no consensus about a definition of frailty [34, 53] as shown by the different approaches described in the literature. Besides the well-known frailty phenotype approach [1], the frailty index is another dominant approach in frailty research [54]. The frailty index involves the accumulation of diseases, symptoms, signs, disabilities or any deficiency in health with age [55]. Although different domains of human functioning are incorporated in the frailty index, it differs from our approach to frailty because it considers frailty as much broader than functioning alone. The incorporation of social functioning in the concept of frailty is an area of discussion. During the development of the integral conceptual model of frailty a group of frailty experts agreed upon including social functioning in this model [19]. The social domain cannot be left out because it is relevant to an integrated view of human beings [3, 56], the relationship with adverse outcomes is demonstrated [57, 58], and ‘social relationships’ and ‘social support’ are viewed as determinants of frailty [42, 59, 60]. Two other reasons to consider social functioning as part of a multidimensional definition of frailty are (1) social functioning is regarded as separate health domain in the Comprehensive Geriatric Assessment and therefore viewed as relevant in clinical practice [7], and (2) in a qualitative study the majority of interviewed elderly persons reported to consider reduced social functioning as an important component of frailty [61].
The Doetinchem Cohort Study is a unique cohort for studying frailty because of the relatively wide age range of the participants and the ability to define multiple frailty domains due to the wide array of collected variables. The original TFI scale is based on self-report, but we were able to combine self-reported and objectively measured variables to define frailty. Since the population has a wide age range and includes middle-aged adults, we used similar or more stringent cut-off points than applied earlier by van Campen [22]. A sensitivity analysis for cognitive frailty with a lower cut-off (<7.5%) confirmed the findings of cognitive frailty defined by 10th percentile, except for alcohol consumption, obesity and multimorbidity. Since data required to define social frailty (as well as some of the indicators for physical and psychological frailty) were measured for the first time in the most recent completed round of the Doetinchem Cohort Study, longitudinal analyses were not possible. As such, all analyses were cross-sectional and causal inferences cannot be made. To illustrate this, we take the example of having a paid job. We found that having a paid job was strongly associated with a lower risk to be physically frail. This may suggest a protective effect of having a paid job for being physically frail. However, it may also imply that frail persons have stopped working because of limitations in work functioning. Future studies are needed to address the prospective association between a various range of factors and the development of physical, psychological, cognitive, and social frailty. Another limitation is the measurement of life events. Other studies have shown that especially death of a loved one was associated with frailty [39]. The questionnaire used for the Doetinchem Cohort study did not assess death of a loved one. We therefore decided to use the variable ‘being widowed’ as a proxy. We should however, acknowledge that the life events being widowed and death of a loved one may partly overlap but are not the same. This may explain the lack of association with psychological frailty. Although the response rates for the examination rounds varies between 75 and 80%, we cannot exclude selective response that may have caused an underrepresentation of severely frail participants, in particular of physically and cognitively frail individuals. To minimize a healthy cohort effect, home visits were offered if participants were not able to get to the municipal health services where the examinations were carried out. This way, frail participants could still participate in the study. However, due to potential selective response the observed associations may be underestimated.
Conclusions
The present study suggests that frailty, in particular psychological frailty, may already be present at a relatively young age. Sociodemographic factors, lifestyle and multimorbidity contributed differently to each of the frailty domains. This highlights the relevance of a multidimensional approach to frailty as operationalized in the integral conceptual model of frailty. Understanding which groups of older adults are at risk of being frail on each domain may help to prevent frailty and to identify frail individuals in an early stage. Identification of frail individuals is an important step to preclude the development of undesirable outcomes, to provide adequate healthcare and support, and to effectively prevent and delay the development of frailty by health professionals. Since we know little about factors associated with the psychological, cognitive and social domains of frailty, our findings add to available literature and are relevant for clinical practice [34]. We found that lower educated adults were at higher risk of being frail, and therefore preventive strategies should be directed at this group. Furthermore, our findings suggest that lifestyle factors, specifically physical activity and sleep, are associated with the presence of frailty. As lifestyle is potentially modifiable, interventions directed to improve lifestyle may provide new opportunities for the prevention of frailty in the future. But first longitudinal research should be conducted to better examine how lifestyle affects the development of frailty and its dynamic course.
Additional files
Extensive description of the four domains of frailty. (DOCX 17 kb)
Results of the logistic regression analyses on the associated factors with frailty on any of the domains. (DOCX 19 kb)
Acknowledgements
The authors would like to thank the epidemiologists and fieldworkers of the Municipal Health Service in Doetinchem for their contribution to the data collection for this study.
Funding
Part of this work was supported by the Ministry of Public Health, Welfare and Sport of the Netherlands. The supporting agency had no role in the design or conduct of the study; the collection, analysis, or interpretation of the data; or the writing or approval of the manuscript.
Availability of data and materials
Due to ethical restrictions related to participant consent, all relevant data are available upon request to the principal investigator of the Doetinchem Cohort Study: professor WMM Verschuren (email: monique.verschuren@rivm.nl).
Abbreviations
- BMI
Body Mass Index
- TFI
Tilburg frailty indicator
Authors’ contributions
SHO, DLA, MLR, HSJP, ML, WMMV, SRB and AMWS participated in the conceptual development and study design. SHO and DLA analysed the data and all authors contributed to the interpretation of the results. SHO drafted the manuscript and all other authors commented and revised the manuscript. SHO, DLA, MLR, HSJP, ML, WMMV, SRB and AMWS. All authors read and approved the final manuscript.
Ethics approval and consent to participate
Written informed consent was obtained from all participants. The Medical Ethics Committees of the Netherlands Organization of Applied Scientific Research and the University of Utrecht approved the study.
Consent for publication
Not applicable
Competing interests
The authors declare that they have no competing interests.
Publisher’s Note
Springer Nature remains neutral with regard to jurisdictional claims in published maps and institutional affiliations.
Footnotes
Electronic supplementary material
The online version of this article doi: 10.1186/s12877-017-0595-0) contains supplementary material, which is available to authorized users.
References
- 1.Fried LP, Tangen CM, Walston J, Newman AB, Hirsch C, Gottdiener J, Seeman T, Tracy R, Kop WJ, Burke G, et al. Frailty in older adults: evidence for a phenotype. J Gerontol Series A, Biol Sci Med Sci. 2001;56(3):M146–M156. doi: 10.1093/gerona/56.3.M146. [DOI] [PubMed] [Google Scholar]
- 2.Hogan DB, MacKnight C, Bergman H. Steering committee Canadian initiative on frailty and aging: models, definitions, and criteria of frailty. Aging Clin Exp Res. 2003;15(3 Suppl):1–29. [PubMed] [Google Scholar]
- 3.Levers MJ, Estabrooks CA, Ross Kerr JC. Factors contributing to frailty: literature review. J Adv Nurs. 2006;56(3):282–291. doi: 10.1111/j.1365-2648.2006.04021.x. [DOI] [PubMed] [Google Scholar]
- 4.Markle-Reid M, Browne G. Conceptualizations of frailty in relation to older adults. J Adv Nurs. 2003;44(1):58–68. doi: 10.1046/j.1365-2648.2003.02767.x. [DOI] [PubMed] [Google Scholar]
- 5.Gobbens RJ, Luijkx KG, Wijnen-Sponselee MT, Schols JM. Toward a conceptual definition of frail community dwelling older people. Nurs Outlook. 2010;58(2):76–86. doi: 10.1016/j.outlook.2009.09.005. [DOI] [PubMed] [Google Scholar]
- 6.Pilotto A, Cella A, Pilotto A, Daragjati J, Veronese N, Musacchio C, Mello AM, Logroscino G, Padovani A, Prete C, et al. Three decades of comprehensive geriatric assessment: evidence coming from different healthcare settings and specific clinical conditions. J Am Med Dir Assoc. 2017;18(2):192 e191–192 e111. doi: 10.1016/j.jamda.2016.11.004. [DOI] [PubMed] [Google Scholar]
- 7.Welsh TJ, Gordon AL, Gladman JR. Comprehensive geriatric assessment--a guide for the non-specialist. Int J Clin Pract. 2014;68(3):290–293. doi: 10.1111/ijcp.12313. [DOI] [PMC free article] [PubMed] [Google Scholar]
- 8.Fried LP, Ferrucci L, Darer J, Williamson JD, Anderson G. Untangling the concepts of disability, frailty, and comorbidity: implications for improved targeting and care. J Gerontol Series A, Biol Sci Med Sci. 2004;59(3):255–263. doi: 10.1093/gerona/59.3.M255. [DOI] [PubMed] [Google Scholar]
- 9.Pel-Littel RE, Schuurmans MJ, Emmelot-Vonk MH, Verhaar HJ. Frailty: defining and measuring of a concept. J Nutri, Health Aging. 2009;13(4):390–394. doi: 10.1007/s12603-009-0051-8. [DOI] [PubMed] [Google Scholar]
- 10.Gobbens RJ, van Assen MA, Luijkx KG, Schols JM. The predictive validity of the Tilburg frailty indicator: disability, health care utilization, and quality of life in a population at risk. Gerontologist. 2012;52(5):619–631. doi: 10.1093/geront/gnr135. [DOI] [PubMed] [Google Scholar]
- 11.OECD. Health reform: meeting the challenge of ageing and multiple morbidities: In. Edited by Publishing O; 2011.
- 12.The Swedish National Institute of Public Health . Healthy ageing, a challenge for Europe. Stockholm: The Swedish National Institute of Public Health; 2007. [Google Scholar]
- 13.Mello AC, Engstrom EM, Alves LC. Health-related and socio-demographic factors associated with frailty in the elderly: a systematic literature review. Cad Saude Publica. 2014;30(6):1143–1169. doi: 10.1590/0102-311X00148213. [DOI] [PubMed] [Google Scholar]
- 14.Kelaiditi E, Cesari M, Canevelli M, van Kan GA, Ousset PJ, Gillette-Guyonnet S, Ritz P, Duveau F, Soto ME, Provencher V, et al. Cognitive frailty: rational and definition from an (I.A.N.A./I.A.G.G.) international consensus group. J Nutri, Health Aging. 2013;17(9):726–734. doi: 10.1007/s12603-013-0367-2. [DOI] [PubMed] [Google Scholar]
- 15.Dartigues JF, Amieva H. Cognitive frailty: rational and definition from an (I.A.N.A./i.A.G.G.) international consensus group. J Nutri, Health Aging. 2014;18(1):95. doi: 10.1007/s12603-013-0437-5. [DOI] [PubMed] [Google Scholar]
- 16.Woods AJ, Cohen RA, Pahor M. Cognitive frailty: frontiers and challenges. J Nutri, Health Aging. 2013;17(9):741–743. doi: 10.1007/s12603-013-0398-8. [DOI] [PMC free article] [PubMed] [Google Scholar]
- 17.Rietman ML, van der A DL, Van Oostrom SH, Picavet HSJ, Dollé MET, van Steeg H, Verschuren WMM, Spijkerman AMW: The association between BMI and different frailty domains: a U-shaped curve? Journal Nutri, health Aging 2017, Accepted:DOI: 10.1007/s12603-12016-10854-12603. [DOI] [PubMed]
- 18.Verschuren W, Blokstra A, Picavet H, Smit H. Cohort profile: the Doetinchem cohort study. Int J Epidemiol. 2008;37:1236–1241. doi: 10.1093/ije/dym292. [DOI] [PubMed] [Google Scholar]
- 19.Gobbens RJ, Luijkx KG, Wijnen-Sponselee MT, Schols JM. Towards an integral conceptual model of frailty. J Nutri, Health Aging. 2010;14(3):175–181. doi: 10.1007/s12603-010-0045-6. [DOI] [PubMed] [Google Scholar]
- 20.Bremer P, Cabrera E, Leino-Kilpi H, Lethin C, Saks K, Sutcliffe C, Soto M, Zwakhalen SM, Wubker A, RightTimePlaceCare C. Informal dementia care: consequences for caregivers’ health and health care use in 8 European countries. Health Policy. 2015;119(11):1459–1471. doi: 10.1016/j.healthpol.2015.09.014. [DOI] [PubMed] [Google Scholar]
- 21.Gobbens RJ, van Assen MA, Luijkx KG, Wijnen-Sponselee MT, Schols JM. The Tilburg frailty indicator: psychometric properties. J Am Med Dir Assoc. 2010;11(5):344–355. doi: 10.1016/j.jamda.2009.11.003. [DOI] [PubMed] [Google Scholar]
- 22.van Campen C. Frail older persons in the Netherlands. The Hague: The Netherlands Institute for Social Research (SCP); 2011. [Google Scholar]
- 23.Radloff LS. The CES-D scale: a self-report depression scale for research in the general population. Appl Psychol Meas. 1977;1:385–401. doi: 10.1177/014662167700100306. [DOI] [Google Scholar]
- 24.van der Zee KI, Sanderman R. Het Meten van Gezondheidstoestand Met de RAND-36: een Handleiding. Noordelijk Centrum voor Gezondheidsvraagstukken. Groningen: The Netherlands [in Dutch]; 1993. [Google Scholar]
- 25.de Jong GJ, Kamphuis FH. The development of a Rasch-type loneliness-scale. Appl Psychol Meas. 1985;9:289–299. doi: 10.1177/014662168500900307. [DOI] [Google Scholar]
- 26.Kempen GIJM. M. VEL: the psychometric properties of the SSL12-I, a short scale for measuring social support in the elderly. Soc Indic Res. 1995;35(3):303–312. doi: 10.1007/BF01079163. [DOI] [Google Scholar]
- 27.Dutch Municipal Health Services Elderly Monitor [Monitor Gezondheid Ouderen] [https://www.monitorgezondheid.nl/LNMO.xml]. Accessed Nov 2015.
- 28.World Health Organisation . Diet, nutrition, and the prevention of chronic diseases. Report of a WHO study group. Geneva: WHO Technical Report Series No 797 edn; 1990. [PubMed] [Google Scholar]
- 29.Huijbregts P, Feskens E, Rasanen L, Fidanza F, Nissinen A, Menotti A, Kromhout D. Dietary pattern and 20 year mortality in elderly men in Finland, Italy, and The Netherlands: longitudinal cohort study. BMJ. 1997;315(7099):13–17. doi: 10.1136/bmj.315.7099.13. [DOI] [PMC free article] [PubMed] [Google Scholar]
- 30.Kemper HCG, Ooijendijk WTM, Stiggelbout M. Consensus over de Nederlandse norm voor gezond bewegen [consensus on the Dutch standard for healthy exercise] Tijdschrift voor gezondheidswetenschappen. 2000;3(78):180–183. [Google Scholar]
- 31.Health Council of the Netherlands . Guidelines for a healthy diet 2015. The Hague: Health Council of the Netherlands; 2015. [Google Scholar]
- 32.National Institutes of Health Clinical guidelines on the identification, evaluation, and treatment of overweight and obesity in adults—the evidence report. Obes Res. 1998;6(suppl 2):51S–209S. [PubMed] [Google Scholar]
- 33.van den Akker M, Buntinx F, Knottnerus JA. Comorbidity or multimorbidity: what's in a name? A review of literature. Eur J Gen Pract. 1996;2(2):65–70. doi: 10.3109/13814789609162146. [DOI] [Google Scholar]
- 34.Collard RM, Boter H, Schoevers RA, Oude Voshaar RC. Prevalence of frailty in community-dwelling older persons: a systematic review. J Am Geriatr Soc. 2012;60(8):1487–1492. doi: 10.1111/j.1532-5415.2012.04054.x. [DOI] [PubMed] [Google Scholar]
- 35.Metzelthin SF, Daniels R, van Rossum E, de Witte L, van den Heuvel WJ, Kempen GI. The psychometric properties of three self-report screening instruments for identifying frail older people in the community. BMC Public Health. 2010;10:176. doi: 10.1186/1471-2458-10-176. [DOI] [PMC free article] [PubMed] [Google Scholar]
- 36.Blodgett J, Theou O, Kirkland S, Andreou P, Rockwood K. Frailty in NHANES: comparing the frailty index and phenotype. Arch Gerontol Geriatr. 2015;60(3):464–470. doi: 10.1016/j.archger.2015.01.016. [DOI] [PubMed] [Google Scholar]
- 37.Rockwood K, Song X, Mitnitski A, et al. CMAJ : Canadian Med Assoc J = journal de l'Assoc Med canadienne. 2011;183(8):E487–E494. doi: 10.1503/cmaj.101271. [DOI] [PMC free article] [PubMed] [Google Scholar]
- 38.Hoogendijk EO, van Hout HP, Heymans MW, van der Horst HE, Frijters DH, Broese van Groenou MI, Deeg DJ, Huisman M. Explaining the association between educational level and frailty in older adults: results from a 13-year longitudinal study in the Netherlands. Annals Epidemiol. 2014;24(7):538–544. doi: 10.1016/j.annepidem.2014.05.002. [DOI] [PubMed] [Google Scholar]
- 39.Coelho T, Paul C, Gobbens RJ, Fernandes L. Determinants of frailty: the added value of assessing medication. Front Aging Neurosci. 2015;7:56. doi: 10.3389/fnagi.2015.00056. [DOI] [PMC free article] [PubMed] [Google Scholar]
- 40.Gobbens RJ, van Assen MA, Luijkx KG, Wijnen-Sponselee MT, Schols JM. Determinants of frailty. J Am Med Direc Assoc. 2010;11(5):356–364. doi: 10.1016/j.jamda.2009.11.008. [DOI] [PubMed] [Google Scholar]
- 41.Gobbens RJ, van Assen MA, Luijkx KG, Wijnen-Sponselee MT. Schols JM: [young frail elderly: assessed using the Tilburg frailty indicator] Tijdschr Gerontol Geriatr. 2012;43(6):296–307. doi: 10.1007/s12439-012-0043-8. [DOI] [PubMed] [Google Scholar]
- 42.Strawbridge WJ, Shema SJ, Balfour JL, Higby HR, Kaplan GA. Antecedents of frailty over three decades in an older cohort. J Gerontol B Psychol Sci Soc Sci. 1998;53(1):S9–16. doi: 10.1093/geronb/53B.1.S9. [DOI] [PubMed] [Google Scholar]
- 43.Sofi F, Valecchi D, Bacci D, Abbate R, Gensini GF, Casini A, Macchi C. Physical activity and risk of cognitive decline: a meta-analysis of prospective studies. J Intern Med. 2011;269(1):107–117. doi: 10.1111/j.1365-2796.2010.02281.x. [DOI] [PubMed] [Google Scholar]
- 44.Savela SL, Koistinen P, Stenholm S, Tilvis RS, Strandberg AY, Pitkala KH, Salomaa VV, Strandberg TE. Leisure-time physical activity in midlife is related to old age frailty. J Gerontol Series A, Biol Sci Med Sci. 2013;68(11):1433–1438. doi: 10.1093/gerona/glt029. [DOI] [PubMed] [Google Scholar]
- 45.Kojima G, Iliffe S, Walters K. Smoking as a predictor of frailty: a systematic review. BMC Geriatr. 2015;15:131. doi: 10.1186/s12877-015-0134-9. [DOI] [PMC free article] [PubMed] [Google Scholar]
- 46.Bollwein J, Diekmann R, Kaiser MJ, Bauer JM, Uter W, Sieber CC, Volkert D. Dietary quality is related to frailty in community-dwelling older adults. J Gerontol Series A, Biol Sci Med Sci. 2013;68(4):483–489. doi: 10.1093/gerona/gls204. [DOI] [PubMed] [Google Scholar]
- 47.Leon-Munoz LM, Garcia-Esquinas E, Lopez-Garcia E, Banegas JR, Rodriguez-Artalejo F. Major dietary patterns and risk of frailty in older adults: a prospective cohort study. BMC Med. 2015;13:11. doi: 10.1186/s12916-014-0255-6. [DOI] [PMC free article] [PubMed] [Google Scholar]
- 48.Luyster FS, Strollo PJ, Jr, Zee PC, Walsh JK. Boards of directors of the American Academy of sleep M, the sleep research S: sleep: a health imperative. Sleep. 2012;35(6):727–734. doi: 10.5665/sleep.1846. [DOI] [PMC free article] [PubMed] [Google Scholar]
- 49.Ensrud KE, Blackwell TL, Redline S, Ancoli-Israel S, Paudel ML, Cawthon PM, Dam TT, Barrett-Connor E, Leung PC, Stone KL, et al. Sleep disturbances and frailty status in older community-dwelling men. J Am Geriatr Soc. 2009;57(11):2085–2093. doi: 10.1111/j.1532-5415.2009.02490.x. [DOI] [PMC free article] [PubMed] [Google Scholar]
- 50.Cochen V, Arbus C, Soto ME, Villars H, Tiberge M, Montemayor T, Hein C, Veccherini MF, Onen SH, Ghorayeb I, et al. Sleep disorders and their impacts on healthy, dependent, and frail older adults. J Nutri, Health Aging. 2009;13(4):322–329. doi: 10.1007/s12603-009-0030-0. [DOI] [PubMed] [Google Scholar]
- 51.Blaum CS, Xue QL, Michelon E, Semba RD, Fried LP. The association between obesity and the frailty syndrome in older women: the Women's health and aging studies. J Am Geriat Soc. 2005;53(6):927–934. doi: 10.1111/j.1532-5415.2005.53300.x. [DOI] [PubMed] [Google Scholar]
- 52.Hubbard RE, Lang IA, Llewellyn DJ, Rockwood K. Frailty, body mass index, and abdominal obesity in older people. J Gerontol Series A, Biol Sci Med Sci. 2010;65(4):377–381. doi: 10.1093/gerona/glp186. [DOI] [PubMed] [Google Scholar]
- 53.Cesari M, Marzetti E, Calvani R, Vellas B, Bernabei R, Bordes P, Roubenoff R, Landi F. Cherubini a, consortium S: the need of operational paradigms for frailty in older persons: the SPRINTT project. Aging Clin Exp Res. 2017;29(1):3–10. doi: 10.1007/s40520-016-0712-5. [DOI] [PubMed] [Google Scholar]
- 54.Cesari M, Gambassi G, van Kan GA, Vellas B. The frailty phenotype and the frailty index: different instruments for different purposes. Age Ageing. 2014;43(1):10–12. doi: 10.1093/ageing/aft160. [DOI] [PubMed] [Google Scholar]
- 55.Mitnitski A, Song X, Rockwood K. Assessing biological aging: the origin of deficit accumulation. Biogerontology. 2013;14(6):709–717. doi: 10.1007/s10522-013-9446-3. [DOI] [PMC free article] [PubMed] [Google Scholar]
- 56.De Witte N, Gobbens R, De Donder L, Dury S, Buffel T, Schols J, Verte D. The comprehensive frailty assessment instrument: development, validity and reliability. Geriatr Nurs. 2013;34(4):274–281. doi: 10.1016/j.gerinurse.2013.03.002. [DOI] [PubMed] [Google Scholar]
- 57.Imuta H, Yasumura S, Abe H, Fukao A. The prevalence and psychosocial characteristics of the frail elderly in Japan: a community-based study. Aging (Milano) 2001;13(6):443–453. [PubMed] [Google Scholar]
- 58.Schulz R, Williamson GM. Psychosocial and behavioral dimensions of physical frailty. J Gerontol. 1993;48(SpecNo):39–43. doi: 10.1093/geronj/48.Special_Issue.39. [DOI] [PubMed] [Google Scholar]
- 59.Morley JE, Perry HM, 3rd, Miller DK. Editorial: something about frailty. J Gerontol Series A, Biol Sci Med Sci. 2002;57(11):M698–M704. doi: 10.1093/gerona/57.11.M698. [DOI] [PubMed] [Google Scholar]
- 60.Woo J, Goggins W, Sham A, Ho SC. Social determinants of frailty. Gerontology. 2005;51(6):402–408. doi: 10.1159/000088705. [DOI] [PubMed] [Google Scholar]
- 61.Puts MT, Shekary N, Widdershoven G, Heldens J, Deeg DJ. The meaning of frailty according to Dutch older frail and non-frail persons. J Aging Stud. 2009;23:258–266. doi: 10.1016/j.jaging.2008.03.002. [DOI] [Google Scholar]
- 62.Ware JE, Jr, Sherbourne CD. The MOS 36-item short-form health survey (SF-36). I. Conceptual framework and item selection. Med Care. 1992;30(6):473–483. doi: 10.1097/00005650-199206000-00002. [DOI] [PubMed] [Google Scholar]
- 63.Nooyens AC, Bueno-de-Mesquita HB, van Boxtel MP, van Gelder BM, Verhagen H, Verschuren WM. Fruit and vegetable intake and cognitive decline in middle-aged men and women: the Doetinchem cohort study. Br J Nutr. 2011;106(5):752–761. doi: 10.1017/S0007114511001024. [DOI] [PubMed] [Google Scholar]
- 64.Perenboom R, Oudshoorn K, van Herten L, Hoeymans N, Bijl R. Life-expectancy in good mental health: establishing cut-off points for the MHI-5 and GHQ-12 (in Dutch) Leiden: TNO-report PG/VGZ/99067; 2000. [Google Scholar]
- 65.van Tilburg TG, de Jong GJ. Cesuurbepaling van de eenzaamheidsschaal [Reference standards for the loneliness scale] Tijdschr Gerontol Geriatr. 1999;30(4):158–163. [PubMed] [Google Scholar]
Associated Data
This section collects any data citations, data availability statements, or supplementary materials included in this article.
Supplementary Materials
Extensive description of the four domains of frailty. (DOCX 17 kb)
Results of the logistic regression analyses on the associated factors with frailty on any of the domains. (DOCX 19 kb)
Data Availability Statement
Due to ethical restrictions related to participant consent, all relevant data are available upon request to the principal investigator of the Doetinchem Cohort Study: professor WMM Verschuren (email: monique.verschuren@rivm.nl).