

Abstract
Objective
How researchers’ contributions relate to author order on the byline remains unclear. We sought to identify researchers’ contributions associated with author order, and to explore the existence of author profiles.
Design
Observational study.
Setting
Published record.
Participants
1139 authors of 119 research articles published in 2015 in the Annals of Internal Medicine.
Primary outcomes
Presence or absence of 10 contributions, reported by each author, published in the journal.
Results
On average, first authors reported 7.1 contributions, second authors 5.2, middle authors 4.0, penultimate authors 4.5 and last authors 6.4 (p<0.001). The first author made the greatest contributions to drafting the article, designing the study, analysing and interpreting the data, and providing study materials or patients. The second author contributed to data analysis as well and to drafting the article. The last author was most involved in obtaining the funding, critically revising the article, designing the study and providing support. Factor analysis yielded three author profiles—Thinker (study design, revision of article, obtaining funding), Soldier (providing material or patients, providing administrative and logistical support, collecting data) and Scribe (analysis and interpretation of data, drafting the article, statistical expertise). These profiles do not strictly correspond to byline position.
Conclusions
First, second and last authors of research articles made distinct contributions to published research. Three authorship profiles can be used to summarise author contributions. These findings shed light on the organisation of clinical research teams and may help researchers discuss, plan and report authorship in a more transparent way.
Keywords: Authorship order, Author contributions, Research assessment
Strengths and limitations of this study.
We analysed 10 potential contributions of authors of research articles published in a leading medical journal, and we linked them to author order on the byline.
In addition, we used factor analysis to identify three meaningful author roles.
One limitation is that the contributions were self-reported.
Also, only one journal was included, due to the diversity in contribution reporting formats across journals.
Introduction
The sequence in which the authors of research articles are arranged is important because it is used in the assessment of researchers’ scientific contributions.1–3 Promotion committees and funding agencies often give greater weight to papers published by a candidate as first or last author. For example, guidelines of the National Institutes of Health4 indicate that “To get nods from reviewers, you’ll need significant experience and a publication record (first or last author) in respected peer-reviewed journals.” However, no uniform rules currently exist to establish author order. Usually in the medical sciences, the first author has done most of the work and drafted the first version of the paper, the last author is assumed to have provided guidance or supervision and the authors in-between are often ranked in decreasing order of their contributions.3 5 6 Other systems exist, such as an alphabetical order or a strictly decreasing order of contributions.3 In many instances, author order is not defined by clear rules, but rather by the interplay of various considerations that include the importance author contributions and the time invested in the project, scientific prominence, hierarchy, negotiation and academic give-and-take.7 8 Unsurprisingly, ranking authors is sometimes contentious.8–10
One way to interpret the authors’ order is to analyse specific author contributions. Several studies, based on papers published between 1989 and 2000, have shown that the first authors, and to a lesser extent last authors, have contributed more than others.11–14 However, the evidence remains limited. In two studies,11 14 the contributions were rated by corresponding authors, who may have had a biased view of contributions. Furthermore, several recommendations regarding the ordering of authors have been published in the mean time,1–3 and the International Committee of Medical Journal Editors (ICMJE) authorship criteria have been updated, for instance, by the addition in 2000 of ‘acquisition of data’ as a qualifying contribution and the addition of a new criterion (‘Agreement to be accountable for all aspects of the work in ensuring that questions related to the accuracy or integrity of any part of the work are appropriately investigated and resolved’) in 2013.15 Globally, it remains debatable if author order is a useful reflection of the researchers’ contributions to a given study.
Understanding current author ordering practices in relation to their contributions may help better interpret researchers’ publication lists when evaluating academic merit and also help authors agree on the most suitable ordering. In this paper, we report on an observational study based on self-described contributions of authors of research papers and systematic reviews published in the Annals of Internal Medicine in 2015. We selected this journal because it uses an explicit and detailed contribution reporting format. Our primary objective was to describe frequencies of the contributions according to the author’s position on the byline. A secondary objective was to examine correlations between author contributions and to propose common contribution patterns, if they can be identified.
Methods
This cross-sectional study included all authors of studies published in 2015 in the Annals of Internal Medicine (volumes 162 and 163) as Original reports or Reviews. Consensus statements and guidelines were excluded, as were clinical case reports and opinion papers, because the list of contributions does not fully apply in these instances.
Initially, we aimed to include articles from several prominent medical research journals, but a pilot survey revealed that each journal uses a different system for reporting contributions, which would preclude a pooled analysis. The Annals use a standardised and detailed list of 10 contributions that must be filled explicitly for each author, which limits the risk of information bias. In contrast, other journals allow descriptions of contributions in a free format, or accept statements that provide little information about actual roles (such as ‘all authors fulfil authorship criteria’). We selected the year 2015 because we were interested in current authorship practice.
Outcome variables
The main outcome variables were the 10 contributions filled out for each author: (1) Conception and design of the study; (2) analysis and interpretation of the data; (3) drafting of the article; (4) critical revision of the article for important intellectual content; (5) final approval of the article; (6) provision of study material or patients; (7) statistical expertise; (8) obtaining of funding; (9) administrative, technical or logistical support; (10) collection and assembly of data.
A secondary outcome was the fulfilment of the ICMJE authorship criteria15: the first criterion (Substantial contributions to the conception or design of the work; or the acquisition, analysis or interpretation of data for the work) was considered fulfilled if either of contribution 1, 2, 6 or 10 applied; the second criterion (Drafting the work or revising it critically for important intellectual content) if either 3 or 4 applied; the third criterion (Final approval of the version to be published) if contribution 5 applied. The recently introduced fourth criterion (Agreement to be accountable for all aspects of the work in ensuring that questions related to the accuracy or integrity of any part of the work are appropriately investigated and resolved) could not be evaluated based on the Annals’ contribution list.
Finally, we defined author profile scores based on an exploratory factor analysis of the author contributions (see the Statistical analysis section).
Independent variables
The main independent variable was the author rank on the byline, in five categories: first author, second author, middle author, next-to-last author and last author. If there were four authors, the middle author designation was omitted; if there were three authors, the next-to-last designation was also omitted; and if there were two authors, the second author designation was omitted. If there were joint first authors, the second author designation was omitted.
Additional author-level variables were degrees (MD or other medical degree such as MBBS or DO; PhD or other doctoral degree such as ScD or JD; any master’s degree), home institution (university, including public health schools; medical school or hospital; public agency; industry; foundation or other non-profit; contract research organisation or consulting firm, including individuals who gave only a street address), country (dichotomised as US versus other) and disclosure of affiliation or support by a private entity (public funding disclosures were not included).
The independent variables at the article level were study type (randomised trial, observational study, modelling study, meta-analysis and systematic review without meta-analysis), funding (industry funding and specific non-industry funding), number of authors and number of author institutions.
Sample size
The main purpose of the analysis was to compare authors by rank, for example, first authors to last authors, on the proportions who made a given contribution. To detect a difference between 0.6 and 0.8 with power 0.9 and type 1 error of 0.05, 2×110 observations were necessary (this assumes 0 correlation between authors from the same paper). As 110 was close to the annual number of eligible articles, we opted to include all articles published in 2015.
Statistical analysis
We computed the proportion of authors who reported each contribution, overall, and by author position on the byline. The comparison of ranks was tested using a logistic regression model with mixed effects, where the author contribution was the dependent variable, the article was a random factor and author rank was the fixed factor. We also computed the number of authors with a given contribution per paper and the proportion of papers with at least one author who did not fulfil three current ICMJE authorship criteria.
To identify author contributions that were associated with a specific position on the byline, we constructed conditional logistic regression models where each article defined a cluster, author position (eg, first versus middle author) as the dependent variable and the 10 contributions as the independent variables. We built four models, comparing the first, second, next-to-last and last authors to the middle author(s). Only articles with five or more authors contributed to this analysis (108 articles, 1101 authors). In a second stage, we added other author characteristics to the independent variables: medical, doctoral or master’s degrees, US versus other country of work, medical versus other home institution and disclosure of association with a private entity.
To identify the most relevant patterns of author contributions, we used factor analysis, followed by varimax rotation. Because contribution variables were binary, we repeated this analysis using tetrachoric correlations (a tetrachoric correlation coefficient assumes an underlying normally distributed latent trait that is dichotomised to create the binary variable). We did not include ‘Final approval of the article’ in this analysis because this contribution was fulfilled by a majority of authors and because failure of reporting it likely reflects practical issues rather than lack of approval of the submitted article. Factor loadings represent correlations between each contribution and the corresponding factor or underlying dimension. This analysis led to the identification of three distinct components (see the Results section), each with high loadings for three author contributions. We labelled these dimensions ‘Thinker’, ‘Soldier’ and ‘Scribe’, to characterise their content, and we examined the mean score values obtained from the factor analysis as a function of author order. We compared the mean values of these three scores according to author rank and to author degree using linear regression models with mixed effects, where the dimension score from the factor analysis was the dependent variable, each article defined a random intercept, and author rank was a fixed predictor.
We also compared the proportions of authors who fulfilled ICMJE criteria according to author rank. Finally, we examined the associations between authors’ degrees and the three profile scores (using mixed linear regression models) and author rank on the byline (using conditional logistic regression). Analyses were conducted using SPSS V.22 and Stata V.14. Statistical tests were two-sided and the level of type 1 error was 0.05.
Results
We included 119 research papers published in the Annals in 2015, of which 17 (14.3%) reported on randomised clinical trials, 49 (41.2%) were observational studies, 15 (12.6%) were modelling studies (including cost-effectiveness analyses), 31 (26.1%) were systematic reviews with meta-analysis, 6 (5.0%) were narrative reviews and 1 (0.8%) was a qualitative study.
In total, 1139 authors were listed on the 119 papers. There were between 2 and 29 authors per paper; the average was 9.6 (SD 5.4), and quartiles were 6, 8 (median) and 12 authors. In total, 692 (60.8%) of the authors held a medical degree (MD, DO, MBBCh or other), 354 (31.1%) held another doctoral degree (PhD, ScD or other), 350 (30.7%) held a master’s degree (MSc, MPH or other) and 64 (5.6%) held other qualifications or none. The majority of authors (834, 73.2%) were based at US institutions, and about half (593, 52.1%) were based at a hospital or medical school (the others were based at non-medical university departments, public health agencies, non-governmental organisations, private firms or pharmaceutical companies). A minority (172, 15.2%) disclosed an affiliation with a private entity.
Author contributions
Typically, several authors per paper reported any of the contributions (table 1): eg, a median of four authors conceived and designed the study, six analysed and interpreted the data and four drafted the article. Almost 90% of the authors approved the published article, three quarters participated in data analysis and in critical revision of the manuscript, and about half participated in the conception and design of the study and in data collection. On average, an author had 4.8 contributions; first authors had 7.1 contributions, second authors had 5.2, middle authors had 4.0, next-to-last authors had 4.5 and last authors had 6.4 contributions (p<0.001). Taken separately, most contributions displayed a U-shaped pattern across the byline, with highest contribution frequencies from the first and last authors and lowest contribution frequencies from middle authors (table 1). Second authors contributed less than first authors, but more than middle authors, while next-to-last authors resembled middle authors, except for their role in conceiving the study.
Table 1.
Frequencies of author contributions, and of conditions for fulfilling author requirements, overall and by author rank on the byline, among 1139 authors of research articles published in 2015 in the Annals of Internal Medicine
| Author contribution | Median no of contributing authors per article (range) | Overall, % (n) |
According to author rank, % | |||||
| First | Second | Middle | Next to last | Last | p Value* | |||
| 1. Conception and design of the study | 4 (1–17) | 52.2 (595) | 95.3 | 61.5 | 36.6 | 49.6 | 87.4 | <0.001 |
| 2. Analysis and interpretation of the data | 6 (0–22) | 73.6 (838) | 97.7 | 89.9 | 63.4 | 63.0 | 89.9 | <0.001 |
| 3. Drafting of the article | 4 (1–13) | 45.7 (520) | 98.4 | 57.8 | 32.2 | 40.0 | 58.0 | <0.001 |
| 4. Critical revision of the article for important intellectual content | 6 (1–26) | 74.8 (852) | 83.7 | 79.8 | 69.3 | 69.6 | 96.6 | <0.001 |
| 5. Final approval of the article | 7 (2–29) | 88.8 (1011) | 96.9 | 85.3 | 86.1 | 88.7 | 98.3 | <0.001 |
| 6. Provision of study materials or patients | 1 (0–18) | 24.2 (276) | 36.4 | 16.5 | 23.8 | 17.4 | 26.9 | 0.002 |
| 7. Statistical expertise | 2 (0–6) | 22.8 (260) | 48.1 | 29.4 | 15.9 | 18.3 | 32.8 | <0.001 |
| 8. Obtaining of funding | 1 (0–11) | 17.6 (200) | 38.0 | 13.8 | 8.4 | 14.8 | 52.9 | <0.001 |
| 9. Administrative, technical or logistical support | 2 (0–15) | 28.5 (325) | 38.0 | 26.6 | 23.1 | 34.8 | 44.5 | <0.001 |
| 10. Collection and assembly of data | 4 (0–20) | 49.7 (566) | 76.0 | 55.0 | 45.4 | 39.1 | 50.4 | <0.001 |
*From logistic regression model with the author contribution as dependent variable, article as random factor and author rank as fixed factor.
The conditional multiple logistic regression models were fit to the subset of 1101 (96.7%) authors of 108 (90.8%) articles with five or more authors. These analyses highlighted the contributions that were most strongly associated with a given author rank, in comparison with the middle authors (table 2). The first author was most emphatically defined by the drafting of the article, with a very high odds ratio (OR) after adjustment for other contributions. In addition, the conception and design of the study, analysis and interpretation of the data, and provision of study material or patients had all ORs greater than 5 for first author compared with middle authors. None of the associations was as strong as for the second author, but analysis and interpretation of the data, drafting of the article and collection and assembly of data had all significantly elevated ORs. The next-to-last author had elevated odds of providing administrative, technical or logistical support, but was not substantially different from the middle authors in other respects. The last author position was most strongly associated with obtaining the funding for the study, critically revising the article and with conceiving and designing the study; additional contributions were analysis and interpretation of data and administrative and other support. Final approval of the article was not associated with any specific author rank, and neither was the provision of statistical expertise.
Table 2.
Adjusted ORs of author rank relative to middle rank, according to author contributions, among 1101 authors of 108 research articles with five or more authors published in 2015 in the Annals of Internal Medicine (conditional logistic regression analysis)
| Contribution | Author rank | |||||||
| First (vs middle) | Second (vs middle) | Next to last (vs middle) | Last (vs middle) | |||||
| OR (95% CI) | p Value | OR (95% CI) | p Value | OR (95% CI) | p Value | OR (95% CI) | p Value | |
| Conception and design of the study | 6.9 (2.6 to 17.9) | <0.001 | 1.5 (0.9 to 2.6) | 0.15 | 1.6 (0.9 to 2.7) | 0.08 | 6.4 (2.8 to 14.7) | <0.001 |
| Analysis and interpretation of the data | 10.2 (1.1 to 91.5) | 0.038 | 3.5 (1.6 to 7.8) | 0.002 | 1.6 (0.9 to 2.8) | 0.15 | 3.4 (1.1 to 9.9) | 0.027 |
| Drafting of the article | 73.5 (9.2 to 584.4) | <0.001 | 2.3 (1.3 to 4.0) | 0.004 | 1.0 (0.6 to 1.7) | 0.96 | 1.3 (0.7 to 2.6) | 0.43 |
| Critical revision of the article for important intellectual content | 0.4 (0.2 to 1.0) | 0.042 | 1.4 (0.7 to 2.8) | 0.30 | 0.6 (0.3 to 1.0) | 0.054 | 13.8 (2.8 to 68.4) | 0.001 |
| Final approval of the article | 1.3 (0.3 to 6.2) | 0.74 | 0.6 (0.3 to 1.4) | 0.27 | 1.7 (0.8 to 3.8) | 0.17 | 2.5 (0.5 to 13.5) | 0.28 |
| Provision of study materials or patients | 6.5 (2.2 to 19.2) | 0.001 | 1.2 (0.6 to 2.6) | 0.59 | 1.2 (0.6 to 2.4) | 0.52 | 1.4 (0.6 to 3.2) | 0.38 |
| Statistical expertise | 1.5 (0.7 to 3.1) | 0.27 | 1.3 (0.7 to 2.3) | 0.37 | 1.0 (0.5 to 1.8) | 0.94 | 1.1 (0.5 to 2.2) | 0.89 |
| Obtaining of funding | 2.6 (1.1 to 6.5) | 0.035 | 1.5 (0.7 to 3.4) | 0.30 | 1.7 (0.8 to 3.6) | 0.13 | 18.0 (6.5 to 49.8) | <0.001 |
| Administrative, technical, or logistical support | 1.0 (0.5 to 1.9) | 0.95 | 0.7 (0.4 to 1.4) | 0.32 | 1.8 (1.1 to 3.1) | 0.023 | 2.6 (1.4 to 5.1) | 0.004 |
| Collection and assembly of data | 1.3 (0.6 to 3.0) | 0.50 | 2.0 (1.1 to 3.4) | 0.018 | 0.7 (0.4 to 1.1) | 0.12 | 0.7 (0.3 to 1.4) | 0.26 |
Of note, once author contributions were included in the models, other author characteristics—that is, degree, type of institution and country of work—were not significantly associated with author position and were not kept in the final models.
Fulfilment of ICMJE authorship criteria
Overall, 1057 (92.8%) authors fulfilled the first ICMJE criterion, 947 (83.1%) fulfilled the second, 1011 (88.8%) fulfilled the third and 823 (72.3%) complied with all three criteria (figure 1). Nearly all first and last authors were in compliance with the three criteria, in contrast to about two-thirds of the middle authors. For only 25 (21.0%) papers did all authors fulfil all three ICMJE authorship criteria; the other 94 papers (79.0%) included between 1 and 15 non-compliant authors.
Figure 1.
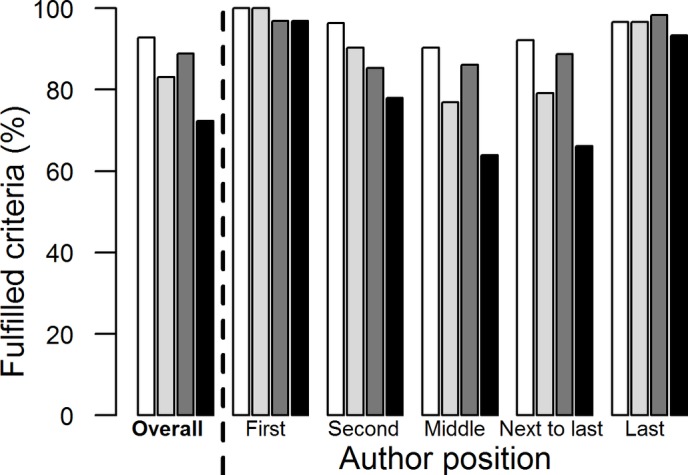
Proportions of authors who fulfilled the first ICMJE authorship criterion (white bars; Substantial contributions to the conception or design of the work; or the acquisition, analysis or interpretation of data for the work), the second ICMJE criterion (light grey bars; Drafting the work or revising it critically for important intellectual content), the third ICMJE criterion (dark grey bars; Final approval of the version to be published) and three ICMJE criteria (black bars), overall and according to author position on the byline. ICMJE, International Committee of Medical Journal Editors.
Composite author profiles
The principal components analysis yielded an interpretable solution, which was the same whether we used Pearson correlation coefficients or tetrachoric correlation coefficients (table 3). The first dimension was defined by high loadings on ‘Conception and design’, ‘Critical revision of article’ and ‘Obtaining funding’; the second, by high loadings on ‘Analysis and interpretation’, ‘Drafting the article’ and ‘Statistical expertise’; and the third, by ‘Provision of study materials’, ‘Administrative and other support’ and ‘Collection of data’. We labelled these dimensions Thinker, Scribe and Soldier as a mnemonic help.
Table 3.
Factor loadings of nine author contributions on three main factors (‘Final approval of the article’ was omitted, and loadings <0.3 are not shown)
| Dimension 1 (Thinker) | Dimension 2 (Scribe) | Dimension 3 (Soldier) | |
| Conception and design of the study | 0.70 (0.55) | ||
| Analysis and interpretation of the data | 0.66 (0.55) | ||
| Drafting of the article | 0.60 (0.41) | ||
| Critical revision of the article for important intellectual content | 0.69 (0.56) | ||
| Provision of study materials or patients | 0.64 (0.52) | ||
| Statistical expertise | 0.76 (0.67) | ||
| Obtaining of funding | 0.65 (0.55) | ||
| Administrative, technical, or logistical support | 0.58 (0.47) | ||
| Collection and assembly of data | 0.75 (0.65) |
Same analysis based on tetrachoric correlations in parentheses.
The corresponding dimension scores all had a mean of 0 and SD of 1 in the whole sample, by definition. When compared according to author order (table 4), all three mean scores were elevated for first authors, but particularly the Scribe score, which was 0.91 above the overall mean. Second authors also had elevated Scribe scores, but less than first authors, and the other two scores were close to 0. Middle authors had negative scores (ie, below the general mean) for all three scores and so did next-to-last authors. Last authors had a particularly elevated Thinker score, but the other two scores were above 0 as well.
Table 4.
Mean value (SD) of mean scores from the factor analysis, overall and by author rank on the byline
| According to author rank | |||||
| First | Second | Middle | Next to last | Last | |
| Thinker profile score* | 0.57 (0.80) | 0.05 (0.96) | −0.28 (0.92) | −0.06 (1.02) | 0.94 (0.79) |
| p Values | <0.001 | 0.001 | reference | 0.022 | <0.001 |
| Soldier profile score* | 0.55 (1.06) | −0.08 (0.96) | −0.10 (0.93) | −0.12 (1.10) | 0.18 (1.07) |
| p Values | <0.001 | 0.20 | reference | 0.35 | <0.001 |
| Scribe profile score* | 0.91 (0.81) | 0.39 (0.94) | −0.26 (0.95) | −0.09 (0.88) | 0.21 (0.92) |
| p Values | <0.001 | <0.001 | reference | 0.23 | <0.001 |
p Values from a linear regression model with mixed effects.
*All scores have a mean of 0 and SD of 1 in the full sample.
Authors’ degrees
Authorship profiles differed by author degree (table 5). The Thinker profile score was highest among authors with MDs and additional degrees and was lowest among authors without doctoral degrees. The Scribe profile score was highest among authors with PhDs or master’s degrees and was lowest among physicians without additional degrees and authors with other qualifications. The Soldier score was highest among those with other qualifications.
Table 5.
Authorship summary scores and author ranks according to the authors’ degrees
| Authors’ degrees | |||||||
| MD only (n=411) |
MD and master’s (n=175) |
MD and PhD (n=106) |
PhD (n=248) |
Master’s (n=135) |
Other (n=64) |
||
| Profile scores, mean (SD) | p Value* | ||||||
| Thinker | 0.05 (0.95) | 0.41 (0.84) | 0.24 (0.86) | 0.04 (1.02) | −0.58 (1.04) | −0.79 (0.86) | <0.001 |
| Scribe | −0.36 (0.87) | −0.02 (0.99) | 0.00 (0.97) | 0.46 (1.00) | 0.45 (0.95) | −0.40 (0.85) | <0.001 |
| Soldier | 0.08 (0.98) | −0.13 (1.02) | 0.21 (1.17) | −0.38 (0.87) | 0.17 (0.91) | 0.62 (0.89) | <0.001 |
| Author rank, n (row %) | p Value† |
||||||
| First | 41 (31.8) | 29 (22.5) | 15 (11.6) | 30 (23.3) | 7 (5.4) | 7 (5.4) | <0.001 |
| Second | 33 (30.3) | 16 (14.7) | 7 (6.4) | 26 (23.9) | 24 (22.0) | 3 (2.8) | 0.09 |
| Middle | 262 (39.3) | 82 (12.3) | 50 (7.5) | 137 (20.5) | 89 (13.3) | 47 (7.0) | reference |
| Next to last | 39 (33.9) | 14 (12.2) | 15 (13.0) | 27 (23.5) | 14 (12.2) | 6 (5.2) | 0.031 |
| Last | 36 (30.3) | 34 (28.6) | 19 (16.0) | 28 (23.5) | 1 (0.8) | 1 (0.8) | <0.001 |
*From linear regression models with the profile score as dependent variable, article as random factor and author degree category as fixed factor.
†From conditional logistic regression model with each author rank as dependent variable (versus middle position) and author degree category as predictor, conditional on article. p Values are for comparison with middle author rank.
The proportions of MDs and of PhDs were similar across author positions on the byline, but physicians with additional degrees were more likely to be listed first or last, and non-physicians with master’s degrees or with other qualifications were more frequently listed in middle positions (table 5).
Discussion
This study confirmed that author order on the byline reflects considerable differences in the researchers’ roles and involvement in the study and in the published article, both in quantity and in quality. Furthermore, this analysis identified specific author contributions that are associated with being first, second or last author, in comparison with a middle position on the author list. Additionally, this analysis identified three emergent authorship profiles—Thinker, Soldier and Scribe—that summarise authors’ reported roles. Importantly, these author profiles do not strictly correspond to specific positions on the byline, and neither do they correspond to particular ICMJE authorship criteria.
The U-shaped pattern of the frequency of most author contributions according to byline position justifies the large credit generally afforded to first and last authors of medical articles. In this, our results confirm previously published studies11–14 but give perhaps a greater weight to last authors than was previously recognised. Our results also showcase the special contributions of second authors. Globally, our results align with the proposal to identify papers by the first, second and last author names.5 In contrast, we found little evidence that next-to-last authors were more involved in the research than authors in the middle of the byline.
A correlate of the U-shaped pattern of contributions is that unjustified authorship (per ICMJE criteria) was quite prevalent among middle authors but was exceptional among leading and last authors. Overall, the proportion of unjustified authors was similar to previous estimates.16–20 We note that it is the lack of involvement in actual writing (drafting the paper or revising it for important content) that is the most common cause of non-compliance with ICMJE criteria. How to deal with unjustified authorship is a matter of current debate.3 7 21 22
Our results do not support the notion that authors have distinct, specific roles according to their position on the byline; their roles are multiple, and they overlap between byline positions. While our results confirm the common perception that first and last authors have made larger contributions to a published study, substantial variability persisted between authors/articles. We suggest that promotion committees would be well advised to ask for specific contributions made by a given individual instead of relying on author byline position as a proxy of the work done.
The factor analysis identified three summary authorship profiles that we called the Thinker, the Soldier and the Scribe. This was an exploratory analysis, as we did not predefine any specific groupings of author contributions. Nevertheless, these profiles make intuitive sense (at least to us), as they appear to corroborate our experiences of conducting and publishing research. These profiles help understand the collaboration and distribution of work within clinical research teams. As with author contributions, we did not see a clean separation of author profiles by byline position—for example, the first author is not just a Scribe, the middle author is definitely not a typical Soldier and the last author is not only the Thinker.
The analysis of authors’ degrees indicated that physicians who held master’s degrees or PhDs fit the Thinker profile the best, and were more frequently listed as first or last authors. Authors with PhDs and master’s degrees were most associated with the Scribe profile. These results confirm that authors’ training and professional identity influence their roles in research; notably, physicians with additional degrees were able to make key scientific contributions to the reported studies and were frequently rewarded by prominent positions on the authors list.
This study has several limitations. We restricted the study to a single journal to obtain a homogeneous and detailed description of author contributions, but this entails a risk of selection bias. Even though the Annals publish a broad spectrum of research and put no particular constraints on authorship, it may not be representative of medical research articles in general. In particular, the majority of the authors were based at US institutions. Authorship practices may be different elsewhere, and it remains to be seen if the author profiles we identified can be replicated in other contexts. Second, we analysed authors’ self-reported contributions as published, with no corroborating evidence. Previous research has suggested that descriptions of contributions may lack reliability and may underestimate contributions,23 especially if they are made by one author on behalf of others, as may have been the case for some articles. Errors may have diminished the contrasts described in this study but may also have caused bias, if for instance first and last authors completed the contribution disclosures for other coauthors. Furthermore, the Annals reporting format does not distinguish essential contributions from minor involvement; a graded format24 may provide a more accurate description of contributions. Third, we only included research papers and did not examine authorship for opinion papers, guidelines and other types of articles. Finally, we analysed all types of research articles together, as we lacked power to compare authorship patterns of, for example, randomised trials to those of meta-analyses.
In light of this analysis, we suggest that contributorship has the best potential to represent the roles of scientists who conduct clinical research in a transparent manner. The biggest obstacle today is the lack of a consensual taxonomy of scientific roles (ie, contributions). Each journal uses a different system, and no definitions are provided. We believe that a collaborative effort of scientists and journal editors is needed to establish an international classification of scientific contributions and to develop a standardised instrument for the reporting of these contributions.
In summary, we characterised specific contribution patterns of first, second and last authors of research articles published in the Annals of Internal Medicine, and we identified three global author profiles. Interestingly, author order on the byline and authorship profiles do not fully overlap. These findings shed light on the organisation of clinical research teams and could help researchers discuss, plan and report authorship in a more transparent way.
bmjopen-2016-013898supp001.docx (32.7KB, docx)
Supplementary Material
Footnotes
Contributors: Conception and design of the study: TVP, AP, MC, TA, CC and AGA.
Acquisition of data: TVP, AP and AGA.
Analysis and interpretation of results: TVP, AP, MC, TA, CC and AGA.
Drafting of the manuscript: TVP.
Critical revision for important intellectual content: AP, MC, TA, CC and AGA.
Approval of the submitted manuscript: TVP, AP, MC, TA, CC and AGA.
Acceptance of responsibility for all aspects of the study in ensuring that questions related to the accuracy or integrity of any part of the work are appropriately investigated and resolved: TVP, AP, MC, TA, CC and AGA.
Competing interests: None
Provenance and peer review: Not commissioned; externally peer reviewed.
Data sharing statement: No unrestricted data sharing at this time; other analyses of the dataset are ongoing. Interested parties may contact the corresponding author to gain access to the dataset.
References
- 1. Wren JD, Kozak KZ, Johnson KR, et al. The write position. A survey of perceived contributions to papers based on byline position and number of authors. EMBO Rep 2007;8:988–91. 10.1038/sj.embor.7401095 [DOI] [PMC free article] [PubMed] [Google Scholar]
- 2. Bhandari M, Guyatt GH, Kulkarni AV, et al. Perceptions of authors' contributions are influenced by both byline order and designation of corresponding author. J Clin Epidemiol 2014;67:1049–54. 10.1016/j.jclinepi.2014.04.006 [DOI] [PubMed] [Google Scholar]
- 3. Hess CW, Brückner C, Kaiser T, et al. Scientific Integrity Committee of Swiss Academies of Arts and Sciences. Authorship in scientific publications: analysis and recommendations. Swiss Med Wkly 2015;145:w14108. 10.4414/smw.2015.14108 [DOI] [PubMed] [Google Scholar]
- 4. National Institutes of Allergy and Infectious Diseases. Ten steps to winning a RO1 application. https://www.niaid.nih.gov/researchfunding/grant/strategy/Pages/stepswin.aspx(accessed on 6 aug 2016).
- 5. Grando SA, Bernhard JD. “First author, second author, et int, and last author”: a proposed citation system for biomedical papers. Sci Editor 2003;26:122–3. [Google Scholar]
- 6. Riesenberg D, Lundberg GD. The order of authorship: who's on first? JAMA 1990;264:264. [PubMed] [Google Scholar]
- 7. Street JM, Rogers WA, Israel M, et al. Credit where credit is due? regulation, research integrity and the attribution of authorship in the health sciences. Soc Sci Med 2010;70:1458–65. 10.1016/j.socscimed.2010.01.013 [DOI] [PubMed] [Google Scholar]
- 8. Jia JD. Authorship. Fierce disputes about order of authors sometimes occur in China. BMJ 1997;315:746. [PMC free article] [PubMed] [Google Scholar]
- 9. Hoen WP, Walvoort HC, Overbeke AJPM, et al. What are the factors determining authorship and the order of the authors' names? JAMA 1998;280:217–8. 10.1001/jama.280.3.217 [DOI] [PubMed] [Google Scholar]
- 10. Dance A. Who’s on first? Nature 2012;489:591–3. [DOI] [PubMed] [Google Scholar]
- 11. Shapiro DW, Wenger NS, Shapiro MF, et al. The contributions of authors to multiauthored biomedical research papers. JAMA 1994;271:438–42. 10.1001/jama.1994.03510300044036 [DOI] [PubMed] [Google Scholar]
- 12. Yank V, Rennie D. Disclosure of researcher contributions: a study of original research articles in the Lancet . Ann Intern Med 1999;130:661–70. 10.7326/0003-4819-130-8-199904200-00013 [DOI] [PubMed] [Google Scholar]
- 13. Hwang SS, Song HH, Baik JH, et al. Researcher contributions and fulfillment of ICMJE authorship criteria: analysis of author contribution lists in research articles with multiple authors published in radiology. International Committee of Medical Journal Editors. Radiology 2003;226:16–23. 10.1148/radiol.2261011255 [DOI] [PubMed] [Google Scholar]
- 14. Marusić M, Bozikov J, Katavić V, et al. Authorship in a small medical journal: a study of contributorship statements by corresponding authors. Sci Eng Ethics 2004;10:493–502. [DOI] [PubMed] [Google Scholar]
- 15. International Committee of Medical Journal Editors. Recommendations for the conduct, reporting, editing, and publication of scholarly work in medical journals. 2015. http://www.icmje.org/icmje-recommendations.pdf(accessed on 6 aug 2016). [PubMed]
- 16. Flanagin A, Carey LA, Fontanarosa PB, et al. Prevalence of articles with honorary authors and ghost authors in peer-reviewed medical journals. JAMA 1998;280:222–4. 10.1001/jama.280.3.222 [DOI] [PubMed] [Google Scholar]
- 17. Wislar JS, Flanagin A, Fontanarosa PB, et al. Honorary and ghost authorship in high impact biomedical journals: a cross sectional survey. BMJ 2011;343:d6128. 10.1136/bmj.d6128 [DOI] [PMC free article] [PubMed] [Google Scholar]
- 18. Eisenberg RL, Ngo L, Boiselle PM, et al. Honorary authorship in radiologic research articles: assessment of frequency and associated factors. Radiology 2011;259:479–86. 10.1148/radiol.11101500 [DOI] [PubMed] [Google Scholar]
- 19. Bonekamp S, Halappa VG, Corona-Villalobos CP, et al. Prevalence of honorary coauthorship in the American Journal of Roentgenology . AJR Am J Roentgenol 2012;198:1247–55. 10.2214/AJR.11.8253 [DOI] [PubMed] [Google Scholar]
- 20. Rajasekaran S, Shan RL, Finnoff JT, et al. Honorary authorship: frequency and associated factors in physical medicine and rehabilitation research articles. Arch Phys Med Rehabil 2014;95:418–28. 10.1016/j.apmr.2013.09.024 [DOI] [PubMed] [Google Scholar]
- 21. Kovacs J. Honorary authorship epidemic in scholarly publications? How the current use of citation-based evaluative metrics make (pseudo)honorary authors from honest contributors of every multi-author article. J Med Ethics 2013;39:509–12. 10.1136/medethics-2012-100568 [DOI] [PubMed] [Google Scholar]
- 22. Gasparyan AY, Ayvazyan L, Kitas GD. Authorship problems in scholarly journals: considerations for authors, peer reviewers and editors. Rheumatol Int 2013;33:277–84. 10.1007/s00296-012-2582-2 [DOI] [PubMed] [Google Scholar]
- 23. Ilakovac V, Fister K, Marusic M, et al. Reliability of disclosure forms of authors' contributions. CMAJ 2007;176:41–6. 10.1503/cmaj.060687 [DOI] [PMC free article] [PubMed] [Google Scholar]
- 24. Ivanis A, Hren D, Sambunjak D, et al. Quantification of authors' contributions and eligibility for authorship: randomized study in a general medical journal. J Gen Intern Med 2008;23:1303–10. 10.1007/s11606-008-0599-8 [DOI] [PMC free article] [PubMed] [Google Scholar]
Associated Data
This section collects any data citations, data availability statements, or supplementary materials included in this article.
Supplementary Materials
bmjopen-2016-013898supp001.docx (32.7KB, docx)