

Abstract
Background and Aims Ultrathin sections of rice leaf blades observed two-dimensionally using a transmission electron microscope (TEM) show that the chlorenchyma is composed of lobed mesophyll cells, with intricate cell boundaries, and lined with chloroplasts. The lobed cell shape and chloroplast positioning are believed to enhance the area available for the gas exchange surface for photosynthesis in rice leaves. However, a cell image revealing the three-dimensional (3-D) ultrastructure of rice mesophyll cells has not been visualized. In this study, a whole rice mesophyll cell was observed using a focused ion beam scanning electron microscope (FIB-SEM), which provides many serial sections automatically, rapidly and correctly, thereby enabling 3-D cell structure reconstruction.
Methods Rice leaf blades were fixed chemically using the method for conventional TEM observation, embedded in resin and subsequently set in the FIB-SEM chamber. Specimen blocks were sectioned transversely using the FIB, and block-face images were captured using the SEM. The sectioning and imaging were repeated overnight for 200–500 slices (each 50 nm thick). The resultant large-volume image stacks (x = 25 μm, y = 25 μm, z = 10–25 μm) contained one or two whole mesophyll cells. The 3-D models of whole mesophyll cells were reconstructed using image processing software.
Key Results The reconstructed cell models were discoid shaped with several lobes around the cell periphery. The cell shape increased the surface area, and the ratio of surface area to volume was twice that of a cylinder having the same volume. The chloroplasts occupied half the cell volume and spread as sheets along the cell lobes, covering most of the inner cell surface, with adjacent chloroplasts in close contact with each other.
Conclusions Cellular and sub-cellular ultrastructures of a whole mesophyll cell in a rice leaf blade are demonstrated three-dimensionally using a FIB-SEM. The 3-D models and numerical information support the hypothesis that rice mesophyll cells enhance their CO2 absorption with increased cell surface and sheet-shaped chloroplasts.
Keywords: Chloroplast; focused ion beam scanning electron microscope; mesophyll cell, Oryza sativa L.; serial-sectioning electron microscopy; three-dimensional reconstruction; ultrastructure
INTRODUCTION
Rice (Oryza sativa L.) is one of the most important cereal crops in tropical and temperate areas of the world, and possesses high productivity compared with other C3 crops. For better understanding of photosynthesis, the rice leaf structure has previously been examined by many researchers. The chlorenchyma of rice leaves consists of relatively uniform layers of mesophyll cells without clear differentiation between the palisade and spongy tissues (Esau, 1977; Sage and Sage, 2009). The mesophyll cells in rice leaf blades are a unique shape; they appear oblong in longitudinal and paradermal sections, in contrast to their lobed-ellipsoid shape in transverse sections (Chonan, 1967; Sage and Sage, 2009). In addition, chloroplasts occupy most of the peripheral regions of rice mesophyll cells (Sage and Sage, 2009; Adachi et al., 2013). The lobed cell shape and chloroplast positioning are considered to enhance the gas exchange surface (Chonan, 1967; Sage and Sage, 2009; Adachi et al., 2013). However, there has been no discussion based on the whole-cell image with sub-cellular structure in this regard.
For observing the intracellular structure, a transmission electron microscope (TEM) has been employed. Because TEM observation requires the specimens to be sliced into ultrathin sections (approx. 0·1 μm thick), the transmission electron micrographs are two-dimensional (2-D). Although it is possible to infer three-dimensional (3-D) cell structures based on the 2-D images of several specimens sectioned in different orientations (e.g. using transverse, lateral and paradermal sections), a 3-D image of an identical cell would allow accurate determination of its ultrastructure.
Each micrograph obtained with a TEM consists of 2-D data; however, stacking the micrographs of serial sections provides 3-D volume data. Recently, several methods for reconstruction of 3-D structures from the micrographs of serial sections have been proposed (Hughes et al., 2014). A classical method is serial-sectioning transmission electron microscope (ssTEM) method, which was introduced in the 1950s (Birch-Andersen, 1955; Sjöstrand, 1958) and is still useful (Ota et al., 2016). However, ssTEM is a labour-intensive and time-consuming method (Denk and Horstmann, 2004). It involves difficulties in cutting and staining tens or hundreds of continuous sections without missing any, and requires laborious manual handling in taking the micrographs sequentially. Although ssTEM is reasonable for observing structures at relatively limited scale, such as part of an organelle, it is impractical to use this method for the whole cell, which would require processing hundreds of sections.
An alternative to the ssTEM approach has been developed recently using a scanning electron microscope (SEM). Although SEM is usually employed for surface observations, it is also useful for imaging of internal structures along with block-face imaging, which obtains images from flat cut surfaces of a sample block by detecting backscattered (or secondary) electrons based on the composition of electron-stained tissues. One of the established methods in this category uses a serial block-face scanning electron microscope (SBF-SEM) that integrates a microtome inside a field emission SEM (Denk and Horstmann, 2004; Hughes et al., 2014). SBF-SEM repeats the sectioning of the sample block with a diamond knife and the block-face images are obtained automatically in the same specimen chamber. This method provides a large volume of serial 2-D images and reconstructs 3-D structures more easily, quickly and correctly than the manual ssTEM method.
Another serial-sectioning SEM method uses a focused ion beam (FIB) instead of a microtome in a specimen chamber (FIB-SEM; Knott et al., 2008). The FIB system etches (mills) away atoms on the specimen surface with a gallium ion (Ga+) beam, and is a commonly used micro- and nano-machining tool in the semi-conductor industry and materials science. In the FIB-SEM observation, the FIB permits effective sectioning (removal of layers) of the specimen block in steps as fine as 5 nm. The FIB-SEM method was introduced in 2008 in the biological sciences for identifying synaptic contacts (Knott et al., 2008) and has been applied for 3-D analysis in animal tissues and cells (Ohta et al., 2012; Peddie and Collinson, 2014). Following its use in animal samples, FIB-SEM has also been used in plant tissues and cells (Lucas et al., 2012; House and Balkwill, 2013; Bhawana et al., 2014; Lütz-Meindl et al., 2016; Sviben et al., 2016); however, there are only a few reports showing 3-D reconstruction with segmentation: a root nodule of mung bean (Vigna radiata) (Lucas et al., 2012), green algae (Micrasterias and Nitella) (Lütz-Meindl et al., 2016) and coccolithophorid algae (Emiliana) (Sviben et al., 2016), and there has been no report for chlorenchyma in higher plants.
Here we examined rice leaves with FIB-SEM and reconstructed 3-D models for whole mesophyll cells, revealing that the intricate cell shape and the intracellular distribution of developed chloroplasts would enhance photosynthesis.
MATERIALS AND METHODS
Plant material and growth conditions
Caryopses of rice (Oryza sativa L. ‘Nipponbare’) were imbibed in a beaker containing distilled water in an incubation room at 30 ± 2 °C until the appearance of the white tip of the coleoptile. After imbibition, the caryopses were cultivated hydroponically for 25 d in a growth chamber on nutrient solution, as described by Mae and Ohira (1981). The cultivation was performed under controlled conditions of 28/20 °C (day/night), 14 h photoperiod and light intensity of 500 μmol m−2 s−1.
Sample fixation and embedding
The specimens were prepared from the uppermost fully expanded (fifth to seventh) leaves. Small segments (approx. 1 × 2 mm) excised from the middle portion of leaf blades were fixed in Karnovsky’s fixative (mixture of 4 % paraformaldehyde and 5 % glutaraldehyde) in 50 mm sodium phosphate buffer (pH 7·2) for 5 h. After being rinsed in the buffer for 2 h, the segments were post-fixed in 2 % osmium tetroxide in the same buffer for 12 h. The segments were rinsed with the buffer and distilled water, dehydrated in a graded acetone series (30, 50, 70, 90, 99 and 100 %), treated with propylene oxide and then embedded in Spurr’s resin (Spurr, 1969).
TEM observation
Ultrathin sections (100 nm thick) were cut with a diamond knife and placed on 200 mesh copper grids. The grids were double stained with 2 % uranyl acetate for 15 min, followed by lead citrate for 5 min. The specimens were then observed with a TEM (H-7500, Hitachi, Japan) at an accelerating voltage of 100 kV, and were photographed with a CCD camera (Advanced Microscopy Technique, USA) connected to the microscope.
FIB-SEM observation
The surfaces of the embedded leaf segments were exposed using a diamond knife on an ultramicrotome (Ultracut E, Leica, Germany). The resin blocks were subsequently trimmed to a cuboid (approx. 3 × 3 × 2 mm) and glued to the standard specimen stage for FIB-SEM; the leaf surface of the segment in the cuboid was placed vertically to the FIB column, and the transverse section of the leaf faced the SEM column (Fig. 1A, B). The specimens were coated with a thin layer of evaporated carbon with a carbon coater (CADE-EMT, Meiwafosis, Japan) to prevent electron charging. The serial electron micrographs were obtained with a FIB-SEM (MI-4000L, Hitachi, Japan), in which the SEM and the FIB columns were orthogonally arranged; the angle of the two columns was 90°. The fresh surfaces of the specimen were exposed using the FIB, and then the block-face images were captured with the SEM. Serial electron micrographs were obtained automatically by repetitive cutting with the FIB and image capturing with the SEM. The FIB was operated at an accelerating voltage of 30 kV, a beam current of 1·6 nA for milling to prepare and 1·2 nA for milling to cut repetitively. The pitch of FIB milling was set at 50 nm per step. The SEM settings were fixed as follows: accelerating voltage = 1·0 kV, working distance = 2 mm, dwell time = 30 μs per pixel, image size = 1000 × 1000 pixels, colour depth = 8 bit (256 greyscales), pixel size (magnification) = 25 nm per pixel and beam current = 10 pA (±10 %). The secondary electrons were detected with the upper detector in the SEM column. The backscattered electrons were also detected but were not used for imaging in this study. In each case, a single cycle of cutting and image capturing took 1·5–2·5 min.
Fig. 1.

Specimen block setting for FIB-SEM observation. (A) Side view of the setting image for FIB-SEM (MI-4000L, Hitachi). The FIB and SEM columns were arranged orthogonally. The sample (leaf segment) was set on the edge of the block. The FIB sectioned the leaf transversally in this study. (B) A top view from the SEM side of the specimen block set in the FIB-SEM. (C) Block-face image of the fresh surface exposed using the FIB and observed with the SEM.
3-D reconstruction
The resultant image stacks from the block-face imaging were processed using the software Fiji (http://fiji.sc/Fiji) (Schindelin et al., 2012); the greyscale of the images was inverted so that the SEM images resembled TEM images, the brightness and contrast were adjusted and then the slices were aligned. The processed image stacks were then compiled into 3-D models, by volume rendering or by surface rendering. To obtain orthogonal slice images, the volume rendering method was used with the Plugin ‘Volume Viewer’ of Fiji. To reconstruct the 3-D structure of a mesophyll cell, the region of cell walls, chloroplasts and nucleus in all the images (actual cross-sections) were segmented using the software ‘PaintTool SAI’ (ver.1, SYSTEMAX, Japan) (Fig. 2). Each component was painted with a specified colour manually and was saved in BMP format (colour depth = 24 bit). The colour-segmented image stacks were then processed and reconstructed to 3-D surface-rendering models using the software ‘Avizo’ (ver. 9.0, FEI, USA).
Fig. 2.
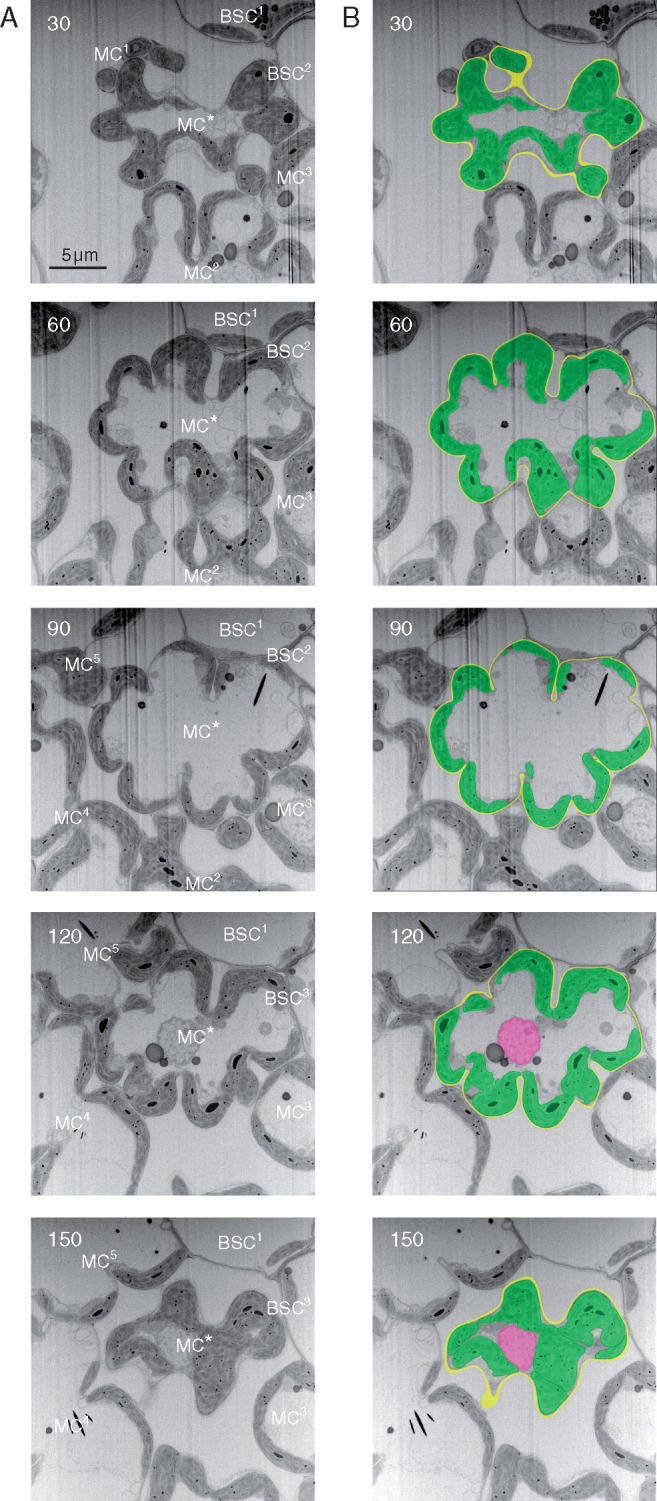
Serial images of transverse sections of a rice leaf blade and segmentation of a mesophyll cell. (A) Serial images observed with FIB-SEM and shown in inverted greyscale. BSC, bundle sheath cell; MC, mesophyll cells. The central MC* contacts five MCs and three BSCs. (B) Serial images shown in (A) were segmented manually – yellow, cell wall; green, chloroplast; magenta, nucleus. The number in each picture indicates the section number from the first cut of the cell (Fig. S3). Cutting interval: 50 nm. Total number of cuttings: 176.
RESULTS
The rice leaf blades were examined as block-face images using a FIB-SEM (Fig. 1). The leaf blade segments were fixed chemically and embedded in resin blocks, following the same method used in conventional TEM observations, without uranyl or lead staining (Supplementary Data Fig. S1). Because the block-face images had enough contrast (Fig. 1C), their greyscale-inverted images showed the cellular structures similar to TEM images (Supplementary Data Fig. S2). The organelles were also visualized at sub-organellar levels, e.g. thylakoids, grana and starch grains in the chloroplasts.
The leaf segment set on the block edge was observed with the SEM and was cut transversely by FIB milling, and the process was repeated (Fig. 1; Fig. S1). After setting the conditions for SEM observation and FIB milling, the machine was run automatically, and 200–500 slice images (area, 25 × 25 μm; interval, 50 nm) were obtained overnight (Supplementary Data Fig. S3; Video S1). Each image stack (x = 25 μm, y = 25 μm, z = 10–25 μm) contained one or two whole mesophyll cells.
After manual segmentation of the cell components in the resultant sections (Fig. 2; Supplementary Data Video S2), the 3-D surface model of a mesophyll cell was reconstructed based on the image stacks using the image processing software (Fig. 3; Video S2). For example, one serial image stack, volume-rendered as a cuboid (x = 20 μm, y = 20 μm, z = 9 μm) (Fig. 3A), contained one whole mesophyll cell (Fig. 3B). The mesophyll cell was discoid and had several lateral protuberances. The bumpy model showed various side views, indicating that the rice mesophyll cell had an intricate outer surface (Fig. 3C). The reconstructed models also revealed the inside of the cell, indicating the positional relationship of chloroplasts and the nucleus in the cell (Fig. 3D). The total number of chloroplasts was 13 in the mesophyll cell shown in Fig. 3, with the adjacent chloroplasts in close contact with each other (Fig. 3D, E). The shape of the chloroplasts fitted to the shape of the cell wall (Fig. 3D, E). The surface area and volume of the mesophyll cell components were calculated using the Fiji software (Table 1). In the mesophyll cell shown in Fig. 3, the volume of total chloroplasts (610 μm3) was half of the whole cell volume (1280 μm3), whereas the surface area of total chloroplasts (2090 μm2) was 1·7 times that of the whole cell (1213 μm2). The surface area to volume ratio of the mesophyll cell was 0·95 μm−1.
Fig. 3.

Three-dimensional (3-D) models of a rice mesophyll cell. (A) 3-D volume rendering of the image stack containing a whole rice mesophyll cell (x = 20 μm, y = 20 μm, z = 9 μm). (B) 3-D surface modelling of a rice mesophyll cell showing the concave–convex exterior of the cell wall. (C) Six different angle views of (B). The numbers indicate the section number from the first cut, corresponding to the numbers in Fig. 2. The mesophyll cell was discoid shape, having several lateral protuberances; the maximum length on the x- and y-axes was approximately twice that on the z-axis. (D) Slice view of the 3-D model of the rice mesophyll cell shown in (B) and (C). Chloroplasts (green) line almost all the inside surface of the cell wall (golden yellow), and the spherical nucleus (magenta) is located inside them. (E) Configuration of chloroplasts in the rice mesophyll cell shown in (B). Each chloroplast is displayed in a different colour. This cell contains 13 chloroplasts. Cutting interval = 50 nm. Total number of cuttings = 176.
Table 1.
Surface area, volume and the ratio of surface to volume (S/V) of the components in the single rice mesophyll cell shown in Fig. 3
| Surface area (μm2) | Volume (μm3) | S/V (μm−1) | |
|---|---|---|---|
| Chloroplasts | 2090 | 610 | 3·43 |
| Whole cell | 1213 | 1280 | 0·95 |
| Cuboid* | 755 | 1280 | 0·59 |
| Elliptic cylinder† | 692 | 1280 | 0·54 |
| Sphere‡ | 570 | 1280 | 0·45 |
The values were calculated with plugin ‘3D Object Counter’ of the software Fiji.
Values calculated for the cuboid having a length of 15·1 μm, a width of 12·7 μm and a height of 6·7 μm.
Values calculated for the cylinder having a major axis of 16·4 μm, a minor axis of 13·8 μm and a height of 7·2 μm.
Values calculated for the sphere having a daimeter of 13·5 μm.
Based on the resultant image stack without segmentation of the cell components, virtual cross-sections were also rendered with the image processing software, revealing the cellular structures (Fig. 4; Fig. S1; Videos S1, S3 and S4). A whole cell was examined from xy, xz and yz planes, and from every conceivable angle or depth (Video S1). Although the images in virtual cross-sections were not as sharp as in the actual cross-sections, the shape of organelles and their inner structures were sufficiently recognizable. In transverse sections (xy), the cell walls of mesophyll cells showed several invaginations, some of which reached one-third to half of the cell width, in depth (Fig. 4A;Fig. S2). In contrast, the longitudinal (yz) and paradermal (xz) virtual sections showed moderate cell constrictions without deep invaginations in the sections crossing near the centre of the cell (Fig. 4B, C), whereas the cell appeared as two or three separate cells in the longitudinal (yz) or paradermal (xz) virtual sections crossing the peripheral part of the cell (Fig. 4B', C'). The inside of the cell wall was lined with chloroplasts, except for the regions adhering to the neighbouring cells, and the chloroplasts stuck to the cell wall along the contour of constrictions or invaginations (Fig. 4; Videos S1 and S2). Sometimes the doughnut-shaped chloroplasts were observed in the actual and virtual cross-sections (Fig. 5A). The doughnut-shaped chloroplasts were also observed in the sliced views of the 3-D reconstructed model of the identical image stack (Fig. 5B), indicating that the chloroplasts assumed a bowl shape that fitted in a protuberance of the cell wall (Fig. 5C).
Fig. 4.

Orthogonal slice images of a mesophyll cell of a rice leaf blade. (A) One image (#065) in a sequence of 176 images for a whole mesophyll cell observed with a FIB-SEM. (B, C) Orthogonal slice images of the image stack, virtually imaged with plugin ‘Volume Viewer’ of the software Fiji. (B) yz-orthogonal slice image. The slice plane crosses the line marked B' shown in (A). (C) xz-orthogonal slice image. The slice plane crosses the line marked C' shown in (A). Asterisks indicate the identical mesophyll cell. Cutting interval = 50 nm. Total number of cuttings = 176.
Fig. 5.
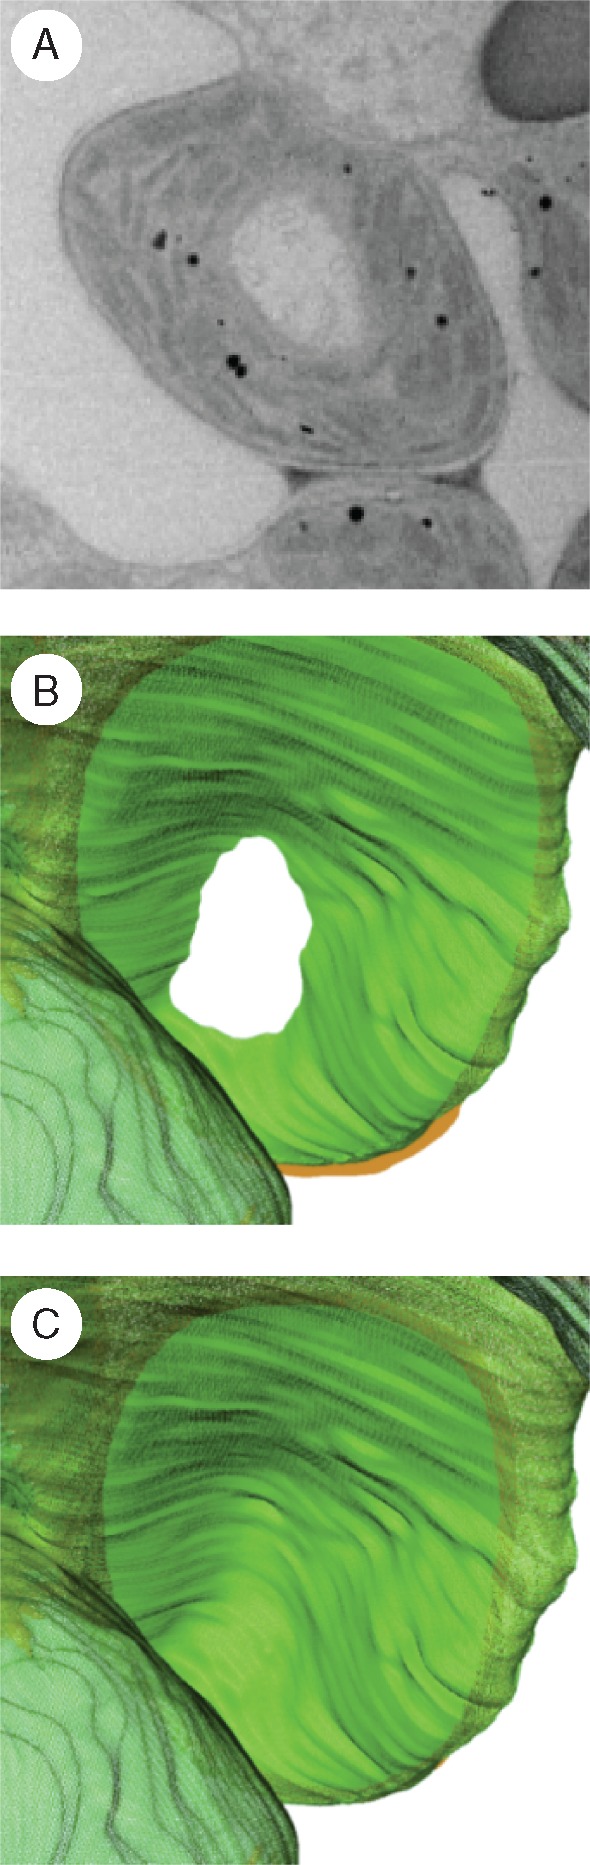
Close-up views of one lobe of the rice mesophyll cell. (A) Sliced view processed by volume-rendering methods showing a doughnut-shaped chloroplast. The cytoplasm is encircled by the chloroplast body containing thylakoid membranes. (B) Sliced view of the reconstructed 3-D model of the chloroplast showing the doughnut shape. The view shows the same region but at a different angle from (A). (C) Another sliced view of the 3-D model of the chloroplast showing the bowl shape. The view shows the same region as (B) but at a different slicing depth.
DISCUSSION
The FIB-SEM is one of the most powerful tools for observing the 3-D ultrastructure of plant cells. It enables us to obtain many serial sections automatically, rapidly and correctly. Because the FIB cuts the block at correct intervals in nanometre scale, the view of the virtual sections presents precisely reconstructed structures (Fig. 4; Video S1). Unlike TEM methods, section staining is unavailable in FIB-SEM, which repeats the sectioning and imaging in the specimen chamber. Previous studies have shown that FIB-SEM or SBF-SEM observation needs specific heavy metal staining: for example, en bloc staining with uranyl acetate or lead aspartate (Denk and Horstmann, 2004; Knott et al., 2008) and double osmium staining (Mikula et al., 2012; Starborg et al., 2013; Hughes et al., 2014) for enhancing the electron conductivity of the specimen and the contrast of block-face images. However, in the present study, the specimens without such staining methods provided images with enough contrast derived from the osmium tetroxide used for post-fixation (Fig. 1C; Fig. S2A). This could result from the use of orthogonally arranged FIB-SEM. The angle of the FIB and SEM column is generally 54° (Carl Zeiss, Germany) or 52° (FEI, The Netherlands); however, the FIB-SEM used in this study arranged the two columns at 90° for optimization of serial-sectioning SEM observations. The orthogonally arranged FIB-SEM system increases the resolution, and eliminates the aspect deformation and shift in the field of view during the imaging of serial sections (Kubota, 2015). SBF-SEM, which has also been used for 3-D analysis (Denk and Horstmann, 2004; Hughes et al., 2014), requires strong staining for observation of plant tissues. Because plant cells have large vacuoles that remain unstained with heavy metals, the specimen has low electron conductivity and accumulates electrons on the surfaces. Although this electron charging disturbs the block-face imaging, FIB-SEM suppresses it because of a positively charged gallium ion (Ga+) beam. For the above reasons, FIB-SEM observation for plant specimens without specific heavy metal staining is possible. Therefore, we can avoid staining contamination and simplify the preparation method. Furthermore, we can use the same specimens prepared for TEM observation.
The FIB-SEM provides hundreds of sectioning images that contain a lot of information about the cellular ultrastructure, and the image sequences provide virtual cross-sections at every conceivable angle or depth using the image processing software (Fig. 4; Video S1). We can observe the consecutive ultrastructure in the identical cell from end to end, including the areas that are frequently overlooked (see, for example, Fig. 4B', C'). Ultimately, the whole plant cell model is reconstructed based on the 3-D information at the ultrastructure level (Fig. 3). In addition, all the slices are cut at constant thickness; the serial image stacks possess accurate numerical voxel value for the 3-D reconstructed model (Table 1). With this background, we can now discuss the structure of rice mesophyll cells based on the 3-D model obtained using a FIB-SEM, with accurate areal and volumetric values (Table 1).
The rice mesophyll cell was observed to be discoid in shape, with several lobes around the cell periphery in the transverse (xy) plane (Figs 2 and 4A; Chonan, 1967; Sage and Sage, 2009). The lobed elliptic disc shape resembled a ratchet (Carolin et al., 1973; Sage and Sage, 2009). The cell shown in Fig. 3 consisted of eight lobes with four deep and four shallow constrictions (Fig. 3C). Owing to these constrictions, the ratio of surface to volume of the mesophyll cell was 1·8 times larger than that of an elliptic cylinder having the same volume and the same three side ratio as the mesophyll cell (maximum x, y, z length = 16·4, 13·8 and 7·2 μm) and was 2·1 times larger than that of a sphere having the same volume (diameter = 13·5 μm) (Table 1). This supports the theory that the mesophyll cells in rice increase the diffusive conductance of CO2 due to their complicated cell surfaces (Sage and Sage, 2009; Adachi et al., 2013). A previous study based on optical sectioning microscopy presented a simple model of the rice mesophyll cell and estimated its volume and surface (in the fifth leaf blade: volume = 1255 μm3, surface = 818 μm2) (Chonan, 1967). The estimated volume based on optical microscopy in the above-mentioned study was similar to the calculated volume based on FIB-SEM observation in the present study. However, the surface area of the previous model was smaller compared with that of the reconstructed model having complicated surfaces. It is considered that the 3-D reconstructed model indicates more precisely the ratio of surface area to volume (0·95 μm−1; Table 1) than the previous model (0·65 μm−1; Chonan, 1967).
Although it is difficult to evaluate the number of chloroplasts in one cell from several ultrathin sections observed with a TEM, the reconstructed whole cell models enable us to count them clearly. The numbers of chloroplasts in whole rice mesophyll cells are 13 (Fig. 3D, E), 14 (Video S3) and 17 (Video S4); these are less than the numbers reported in other C3 plants (76 ± 5 in Arabidopsis thaliana, Kinsman and Pyke, 1998). Despite being fewer in number, the chloroplasts occupied half of the mesophyll cell volume and lined most of the inner surface of the cell (Fig. 3; Table 1). The chloroplast occupancy on the cell periphery, in addition to the lobed cell shape, could promote CO2 absorption (Sage and Sage, 2009). In the 3-D model, each chloroplast spread along the lobed cell wall like a sheet, without narrow and long stroma-filled tubes called stromules (Hanson and Sattarzadeh, 2008); however, it sometimes possessed wide and short protuberances lacking thylakoid membranes, which were called chloroplast protrusions (Bourett et al., 1999; Hanson and Sattarzadeh, 2008). Such expanded chloroplast structures confine most of the mitochondria and peroxisomes to the interior regions of the peripheral cytoplasm (Figs 2 and 4; Fig. S2; Video S1), suggesting that chloroplasts act as barriers to refix the photorespired CO2 (Sage and Sage, 2009). In addition to expanded chloroplast structures, the ultrastructures observed in the sections sometimes show puzzling shapes, such as doughnut-shape chloroplasts (Fig. 5A). However, the 3-D reconstructed models help in interpreting the structures correctly; the doughnut shape is derived from the curvature of cell lobes (Fig. 5B, C). The doughnut shape also supports the view that chloroplasts in rice mesophyll cells have the sheet form along the lobes.
In conventional TEM observation, we must obtain good sections by chance from several cuttings. Therefore, we tend to focus our attention on the region near the centre of the cell to obtain representative images of the cell. With a FIB-SEM, however, we could observe a whole cell comprehensively, independently of the chance factor, and could understand the cell structure from the centre to the peripheral regions, which have often been overlooked (Fig. 4; Video S1). In addition, the FIB-SEM data with the correct z-step possessing numerical information have enabled us to calculate the volume and surface area at the ultrastructure levels (Table 1). Although confocal imaging could also present 3-D data, FIB-SEM could present more information compared with the former technique. Electron microscopy could achieve higher resolution than confocal imaging, and allows observation not only of fluorescence-labelled objects but also of anything with form. In this study, we segmented only the outlines of three components (cell wall, chloroplasts and nucleus) (Figs 2 and 3); however, the other organelles and sub-organelles are also observable in slice views of the volume-rendered image stacks (Fig. 4; Video S1). We have not yet been able to utilize fully the vast information contained in the hundreds of sections obtained with a FIB-SEM because of the difficulty of the segmentation; at present, automated segmentation of the object in electron micrographs is not enabled well, and manual segmentation demands a great deal of time and effort. By overcoming the segmentation, however, comprehensive and numerical 3-D information on cellular and sub-cellular ultrastructures would provide breakthroughs in plant anatomy.
SUPPLEMENTARY DATA
Supplementary data are available here and consist of the following. Figure S1: imaging protocol for 3-D reconstruction of a plant cell or organelles using FIB-SEM. Figure S2: a block-face image obtained using FIB-SEM and a conventional TEM image of rice mesophyll cells. Figure S3: all the images of serial sectioning with a FIB-SEM for a whole rice mesophyll cell. Video S1: all the actual transverse slices, virtual orthogonal slices and virtual free-angle slices of a whole rice mesophyll cell. Video S2: segmented slice images and the 3-D-reconstructed model of a whole rice mesophyll cell. Video S3: another whole rice mesophyll cell containing 14 chloroplasts. Video S4: another whole rice mesophyll cell containing 17 chloroplasts.
Supplementary Material
ACKNOWLEDGEMENTS
This work was supported by the Nagoya University microstructural characterization platform as a programme of the ‘Nanotechnology Platform’ of the Ministry of Education, Culture, Sports, Science and Technology (MEXT), Japan. In addition, this work was partially supported by the Japan Society for the Promotion of Science (JSPS) KAKENHI grant nos JP15H06273 (to T.O.), JP15H05613 (to K.Y.) and JP26292011 (to M.T.). We thank Dr Hiroshi Miyake for reviewing the manuscript.
LITERATURE CITED
- Adachi S, Nakae T, Uchida M, et al. 2013. The mesophyll anatomy enhancing CO2 diffusion is a key trait for improving rice photosynthesis. Journal of Experimental Botany 64: 1061–1072. [DOI] [PubMed] [Google Scholar]
- Bhawana, Miller JL, Cahoon AB.. 2014. 3D plant cell architecture of Arabidopsis thaliana (Brassicaceae) using focused ion beam–scanning electron microscopy. Applications in Plant Sciences 2: 1300090. [DOI] [PMC free article] [PubMed] [Google Scholar]
- Birch-Andersen A. 1955. Reconstruction of the nuclear sites of Salmonella typhimurium from electron micrographs of serial sections. Journal of General Microbiology 13: 327–329. [DOI] [PubMed] [Google Scholar]
- Bourett TM, Czymmek KJ, Howard RJ.. 1999. Ultrastructure of chloroplast protuberances in rice leaves preserved by high-pressure freezing. Planta 208: 472–479. [Google Scholar]
- Carolin RC, Jacobs SWL, Vesk M.. 1973. The structure of the cells of the mesophyll and parenchymatous bundle sheath of the Gramineae. Botanical Journal of the Linnean Society 66: 259–275. [Google Scholar]
- Chonan N. 1967. Studies on the photosynthetic tissues in the leaves of cereal crops: III. The mesophyll structure of rice leaves inserted at different levels of the shoot. Japanese Journal of Crop Science 36: 291–296. [Google Scholar]
- Denk W, Horstmann H.. 2004. Serial block-face scanning electron microscopy to reconstruct three-dimensional tissue nanostructure. PLoS Biology 2: e329. doi:10.1371/journal.pbio.0020329. [DOI] [PMC free article] [PubMed] [Google Scholar]
- Esau K. 1977. Anatomy of seed plants, 2nd edn.New York: John Wiley & Sons. [Google Scholar]
- Hanson MR, Sattarzadeh A.. 2008. Dynamic morphology of plastids and stromules in angiosperm plants. Plant, Cell & Environment 31: 646–657. [DOI] [PubMed] [Google Scholar]
- House A, Balkwill K.. 2013. FIB-SEM: an additional technique for investigating internal structure of pollen walls. Microscopy and Microanalysis 19: 1535–1541. [DOI] [PubMed] [Google Scholar]
- Hughes L, Hawes C, Monteith S, Vaughan S.. 2014. Serial block face scanning electron microscopy – the future of cell ultrastructure imaging. Protoplasma 251: 395–401. [DOI] [PubMed] [Google Scholar]
- Kinsman EA, Pyke KA.. 1998. Bundle sheath cells and cell-specific plastid development in Arabidopsis leaves. Development 125: 1815–1822. [DOI] [PubMed] [Google Scholar]
- Knott G, Marchman H, Wall D, Lich B.. 2008. Serial section scanning electron microscopy of adult brain tissue using focused ion beam milling. Journal of Neuroscience 28: 2959–2964. [DOI] [PMC free article] [PubMed] [Google Scholar]
- Kubota Y. 2015. New developments in electron microscopy for serial image acquisition of neuronal profiles. Microscopy 64: 27–36. [DOI] [PubMed] [Google Scholar]
- Lucas MS, Günthert M, Gasser P, Lucas F, Wepf R.. 2012. Bridging microscopes: 3D correlative light and scanning electron microscopy of complex biological structures. Methods in Cell Biology 111: 325–356. [DOI] [PubMed] [Google Scholar]
- Lütz-Meindl U, Luckner M, Andosch A, Wanner G.. 2016. Structural stress responses and degradation of dictyosomes in algae analysed by TEM and FIB-SEM tomography. Journal of Microscopy 263: 129–141. [DOI] [PubMed] [Google Scholar]
- Mae T, Ohira K.. 1981. The remobilization of nitrogen related to leaf and senescence in rice plants (Oryza sativa L.). Plant and Cell Physiology 22: 1067–1074. [Google Scholar]
- Mikula S, Binding J, Denk W.. 2012. Staining and embedding the whole mouse brain for electron microscopy. Nature Methods 9: 1198–1201. [DOI] [PubMed] [Google Scholar]
- Ohta K, Sadayama S, Togo A, Higashi R, Tanoue R, Nakamura K.. 2012. Beam deceleration for block-face scanning electron microscopy of embedded biological tissue. Micron 43: 612–620. [DOI] [PubMed] [Google Scholar]
- Ota S, Oshima K, Yamazaki T, et al. 2016. Highly efficient lipid production in the green alga Parachlorella kessleri: draft genome and transcriptome endorsed by whole-cell 3D ultrastructure. Biotechnology for Biofuels 9: 13. doi:10.1186/s13068-016-0424-2. [DOI] [PMC free article] [PubMed] [Google Scholar]
- Peddie CJ, Collinson LM.. 2014. Exploring the third dimension: volume electron microscopy comes of age. Micron 61: 9–19. [DOI] [PubMed] [Google Scholar]
- Sage TL, Sage RF.. 2009. The functional anatomy of rice leaves: implications for refixation of photorespiratory CO2 and efforts to engineer C4 photosynthesis into rice. Plant and Cell Physiology 50: 756–772. [DOI] [PubMed] [Google Scholar]
- Schindelin J, Arganda-Carreras I, Frise E, et al. 2012. Fiji: an open-source platform for biological-image analysis. Nature Methods 9: 676–682. [DOI] [PMC free article] [PubMed] [Google Scholar]
- Sjöstrand FS. 1958. Ultrastructure of retinal rod synopses of the guinea pig eye as revealed by three-dimensional reconstructions from serial sections. Journal of Ultrastructure Research 2: 122–170. [DOI] [PubMed] [Google Scholar]
- Spurr AR. 1969. A low-viscosity epoxy resin embedding medium for electron microscopy. Journal of Ultrastructure Research 26: 31–43. [DOI] [PubMed] [Google Scholar]
- Starborg T, Kalson NS, Lu Y, et al. 2013. Using transmission electron microscopy and 3View to determine collagen fibril size and three-dimensional organization. Nature Protocols 8: 1433–4148. [DOI] [PMC free article] [PubMed] [Google Scholar]
- Sviben S, Gal A, Hood MA, et al. 2016. A vacuole-like compartment concentrates a disordered calcium phase in a key coccolithophorid alga. Nature Communications 7: 11228. [DOI] [PMC free article] [PubMed] [Google Scholar]
Associated Data
This section collects any data citations, data availability statements, or supplementary materials included in this article.