Adolescence, defined by the World Health Organization (WHO) as the period of life between 10 and 19 years,1 is a period of remarkable growth. The rate of physical growth during adolescence is second only to that during the first year of life, and this physical growth occurs concomitantly with dramatic cognitive and psychosocial changes.2 Approximately 85% of the 1.2 billion adolescents worldwide live in developing countries, as defined by the country classifications of the United Nation’s Children’s Fund (UNICEF).3 For the purpose of this article, the term “developing countries” includes both “developing countries” and “least-developed countries” according to the UNICEF classification scheme. In many of these countries, stunting, underweight, and micronutrient deficiencies among adolescents frequently result from inadequate nutrition and infections during early childhood combined with a diet insufficient to meet the intense nutritional demands of rapid growth during adolescence. Adolescent pregnancy, which is common in many developing countries, exacts an additional nutritional toll. However, this undernutrition increasingly coexists with burgeoning overweight and obesity, necessitating a complex, multifactorial approach to alleviating the public health burden of worldwide adolescent malnutrition.
This article describes the magnitude of adolescent undernutrition in developing countries and highlights areas for intervention to prevent the harmful cycle of intergenerational undernutrition in which poor nutritional status in adolescence plays a pivotal role. The growing problem of overnutrition in developing countries is also described, with case studies from two countries serving as examples.
THE NUTRITIONAL STATUS OF ADOLESCENTS: AN OVERLOOKED PROBLEM
With a mortality rate lower than any other age group and relatively little morbidity, adolescents are typically not prioritized for public health interventions.3 As a group, adolescents also have less undernutrition than infants and preschool-aged children, historically making the establishment of standardized anthropometric definitions less of a pressing concern for young people this age.4 The rapidity of the adolescent growth spurt, differences in the timing of sexual maturation, and genetic factors all impose tremendous variability on adolescent height and weight, making maturational age and chronological age discordant and establishment of international standards for adolescent growth difficult.4 The consequent use of different definitions of underweight and overweight in studies evaluating adolescent nutritional status complicates assessment of the magnitude of adolescent malnutrition in developing countries and impairs meaningful comparisons.
A relationship between anthropometric cutoffs and functional consequences in adulthood, particularly with regard to cutoffs for overweight and obesity, has yet to be established, necessitating the use of statistically derived cutoffs. The two most used sets of anthropometric definitions and cutoffs for adolescent growth are (1) the 1995 WHO cutoffs for stunting, thinness, at risk for overweight, and obesity4 that were based on data collected by the National Center for Health Statistics (NCHS) in adolescents from the United States (Table 1), and (2) a series of age-specific cutoffs defined by the International Obesity Task Force (IOTF) in 2000 and 20075,6 that were based on data collected in Brazil, Great Britain, Hong Kong, the Netherlands, Singapore, and the United States. The IOTF cutoffs reflect centile curves that at age 18 years pass through the widely used adult body mass index (BMI) cutoffs of 25 and 30 to define overweight and obesity,5 respectively, or drawn through BMI cutoffs of 16, 17, and 18.5 to define thinness of grade 1, 2, and 3.6 These centile curves were averaged for each survey to produce gender and age-specific cutoffs for children aged 2 to 18 years.
Table 1.
Recommended cut-off values and original sources of reference data for adolescents4
| Indicator | Anthropometric variable | Cut-off values |
|---|---|---|
| Stunting or low height-for-age | Height-for-age | <3rd percentile or <−2 Z-scores |
| Thinness or low BMI-for-age | BMI-for-age | <5th percentile |
| At risk for overweight | BMI-for-age | ≥85th percentile |
| Obese | BMI-for-age | ≥85th percentile BMI and |
| TRSKF-for-age | ≥90th percentile TRSKF and | |
| SSKF-for-age | ≥90th percentile SSKF |
SSKF, subscapular skinfold thickness; TRSKF, triceps skinfold thickness
UNDERNUTRITION
A series of 11 cross-sectional studies coordinated by the International Center for Research on Women (ICRW) between 1990 and 1994 highlighted key issues in adolescent nutrition in developing countries.7 These studies—conducted in Ecuador, Mexico, Guatemala (2 studies), Jamaica, Nepal, India, Philippines (2 studies), Benin, and Cameroon—revealed that stunting, underweight, and iron deficiency anemia were widespread among adolescents.
Stunting
Stunting, or impaired linear growth, in adolescents represents long-term nutritional deficiency. The consequences of stunting in adolescence include greater risk of obstetric complications, including obstructed labor in females, and diminished physical capacity among adolescents of both sexes.7
The prevalence of stunting, defined in the ICRW studies as height-for-age less than the 5th percentile of the NCHS/WHO 1995 reference data, was high in 9 of the 11 studies, ranging from 26%–65%.7 Kurtz reports that the pattern of height-for-age was remarkably similar among girls in the 9 countries in which stunting was prevalent, in that the mean height of girls did not improve across the 8 years of adolescence for which data were collected.7 Data from Nepal8 and Ecuador9 typify this pattern (Fig 1). In Nepal, the mean height of girls was near the 5th percentile of the NCHS curve at 10 and 18 years of age and less than the 5th percentile slightly between ages 11 and 15 years. The mean height of adolescent girls in Ecuador was slightly greater than the 5th percentile at age 10, but dropped to the 5th percentile by age 18 years.
Fig 1.
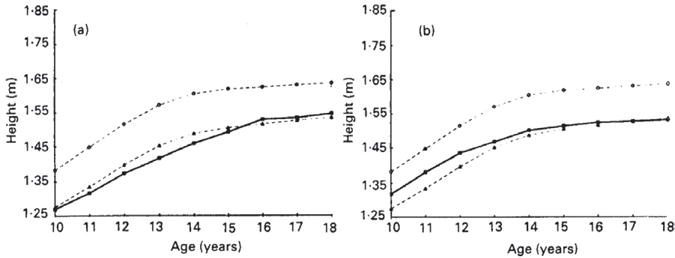
Height of adolescent girls by age in the (a) Nepal and (b) Ecuador studies within the Nutrition of Adolescent Girls Research Program of the International Center for Research on Women. (●), 50th Percentile of the National Center for Health Statistics (NCHS) reference data (Hammill et al. 1979); (■), adolescent data from Nepal or Ecuador; (▲), 5th percentile of the NCHS reference data. Kurtz K. Adolescent nutritional status in developing countries. Proc Nut Soc. 1996; 55:321–331
More recent surveys suggest that stunting remains prevalent in developing countries throughout the world, with a prevalence of 12.1% among Kenyan schoolgirls ages 12 to 16 years,10 approximately 15% among Pakistani boys and girls 11 to 14 years of age,11 and 67.3% and 57.8% among Nigerian boys and girls aged 15 to 18 years,12 respectively. All of these studies defined stunting as height-for-age less than 2 standard deviations less than the 1995 WHO/NCHS reference median, a more stringent definition than that used in the ICRW studies. In contrast to the findings in the ICRW studies in Nepal and Ecuador, the prevalence of stunting apparently declines with age across the adolescent years in some recent studies without intervention.10,13 For example, the cross-sectional study in Kenyan schoolgirls revealed that the prevalence of stunting declined from approximately 20% among 12-year-olds to 2% among 16-year-olds, as the mean height-for-age z-score converged toward the US reference median (Fig 2).10 Similarly, the mean height of a cohort of Senegalese children aged 1 to 5 years who had a nearly 30% prevalence of stunting came within 2 cm of the WHO/NCHS reference median for height when that cohort reached early adulthood (18–23 years), with no formal intervention.13
Fig 2.
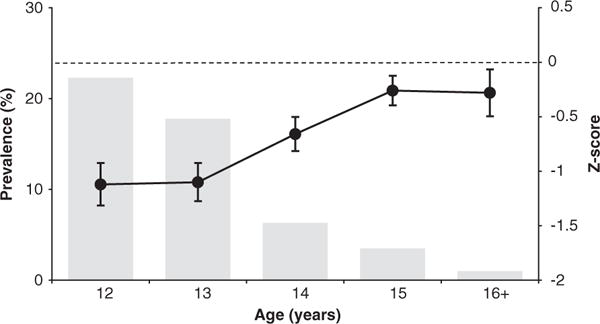
Measures of linear growth by age in 934 adolescent schoolgirls from western Kenya. From Leenstra T, Petersen L, Kariuki S, Oloo A, Kager P, ter Kuile F. Prevalence and severity of malnutrition and age at menarche; cross-sectional studies in adolescent schoolgirls in western Kenya. Eur J Clin Nutr. 2005;59:41–48
The decline in stunting prevalence in the Kenyan survey was concurrent with an average delay in menarche of 1.5 to 2 years compared to the NCHS/US reference curve.10 This finding led researchers to conclude that although stunting was common among young adolescent girls, the maturational delay permitted prolonged growth and eventual attainment of greater height. The debate over whether stunted young adolescents can regain linear height and “catch up” to their optimal height is not resolved, but the proposed mechanism for catch-up growth is that which the authors of the Kenyan study proposed.14,15 Approximately 20% of adult height is gained during adolescence, with the most gained at a rapid rate during a period of 1 to 2 years preceding the early stages of sexual maturation, typically marked by menarche in females or attainment of adult voice in males,4 at which time the growth rate slows. In undernourished populations, menarche or the onset of puberty is often delayed, permitting a longer period of growth and perhaps more time for “catch-up growth.”14,16 Conversely, when the environment of the stunted individual changes, as when families migrate from rural to urban areas13 or in the case of internationally adopted children,17 catch-up growth may be so rapid as to hasten the onset of puberty, thus shortening the period of most rapid growth and limiting adult height.
Food interventions aimed at alleviating adolescent stunting may not spur height gain beyond increases that occur naturally during the adolescent growth spurt and may in fact promote excess weight gain in populations in which concurrent underweight is not prevalent.14 Instead, the prevention of adolescent stunting ideally begins with intervention much earlier in development, as stunting among adolescents reflects chronic undernourishment, likely beginning with inadequate nutrition during the first 2 to 3 years of life.14 At this age, food scarcity and inadequate nutrient intake limit growth, and frequent infections and diarrhea cause malabsorption of critical nutrients. Young children respond well to food interventions, which serve to optimize not only height, but also permit full cognitive development and attainment of complete physical capacity.14 Aside from food interventions, promotion of breastfeeding and the intake of nutrient-dense weaning foods and prevention of infectious diseases through the use of clean water are key in optimizing the nutritional status and growth of young children,14 with this optimized early growth critical for the prevention of impaired linear growth in adolescence.
Thinness or Underweight
The 1995 WHO expert committee identified BMI-for-age less than the 5th percentile as the best indicator for thinness in adolescence.4 Although the term “underweight” is often used to describe thinness in adolescents with low BMI-for-age, the indicator of weight-for-age that is typically used to define underweight in young children is not meaningful in this age group because weight changes dramatically with height during adolescence and height is largely determined by genetic factors. The use of various definitions makes assessment of the public health burden and targeting of interventions challenging. However, patterns of thinness among adolescents in developing countries can be described based on the ICRW studies and other more recent research. These patterns include a declining prevalence of thinness and increasing BMI throughout adolescence in both boys and girls, although boys typically have a greater prevalence of thinness than girls.
The ICRW studies found thinness (BMI-for-age <5th percentile defined by NCHS/WHO reference data) to be highly prevalent in only 3 countries: India (53%), Nepal (36%), and Benin (23%).7 Observed patterns in mean BMI in Nepal and Ecuador are illustrative of the gender differences often found in developing countries. The mean BMI of girls in Nepal was at approximately the 5th percentile of the reference curve at age 10, but increased to the 50th percentile between ages 15 and 18 years (Fig 3).8 In Ecuador, the mean BMI of girls was at the 50th percentile of the reference at age 10 and increased well above that by age 18.9 These increases in BMI across adolescence occurred despite the absence of concurrent gains in girls’ height-for-age relative to the reference (see Fig 1). Boys’ mean BMI remained lower in relation to the reference curve in Nepal and Ecuador, staying at the 5th percentile from 10 to 16 years and then rising in late adolescence (Fig 4). Ecuadorian boys tracked at the 50th percentile throughout adolescence (see Fig 4).
Fig 3.
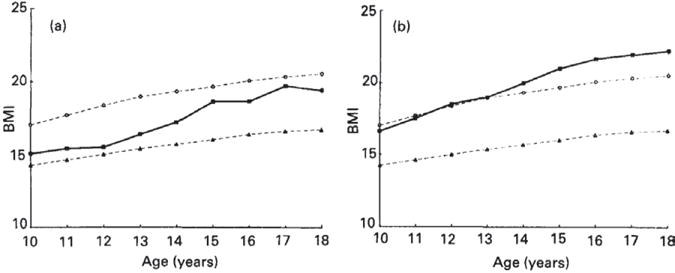
BMI of adolescent girls by age in the (a) Nepal and (b) Ecuador studies within the Nutrition of Adolescent Girls Research Program of the International Center for Research on Women. (●), 50th Percentile of the National Center for Health Statistics (NCHS) reference data (Hammill et al. 1979); (■), adolescent data from Nepal or Ecuador; (▲), 5th percentile of the NCHS reference data. Kurtz K. Adolescent nutritional status in developing countries. Proc Nut Soc. 1996;55:321–331
Fig 4.
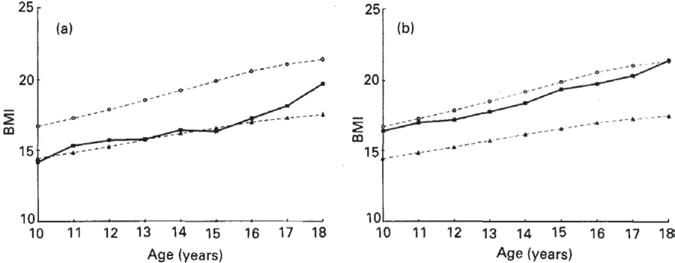
BMI of adolescent boys by age in the (a) Nepal and (b) Ecuador studies within the Nutrition of Adolescent Girls Research Program of the International Center for Research on Women. (●), 50th Percentile of the National Center for Health Statistics (NCHS) reference data (Hammill et al. 1979); (■), adolescent data from Nepal or Ecuador; (▲), 5th percentile of the NCHS reference data. Kurtz K. Adolescent nutritional status in developing countries. Proc Nut Soc. 1996;55:321–331
The declining prevalence of thinness with age among adolescent girls is in part the result of the gain in body fat that occurs after menarche. Data from the study of Kenyan schoolgirls clearly demonstrates this relationship, finding that the prevalence of thinness among Kenyan schoolgirls aged 12 to 18 years was 15.6%, but this prevalence declined significantly with age and degree of sexual maturation.10 The odds of thinness decreased significantly with increases in maturity rating, as assessed by the Tanner scale for breast development, and post-menarchal girls were 85% less likely than pre-menarchal girls to be thin.
Despite the reported low prevalence of thinness among adolescents in the ICRW studies, recent surveys suggest that thinness or underweight persists as a public health problem among adolescents in developing countries. The wide range of definitions for adolescent thinness again makes assessment of patterns difficult, but recent Demographic and Health Surveys (DHS, 2002–2007) revealed that “underweight” (BMI < 18.5) was prevalent among adolescent girls in sub-Saharan Africa and South Asia. Among the countries that participated in this survey, the prevalence of underweight in girls aged 15 to 19 years ranged from 27% to 47% (Fig 5).3 Using the same definition, Ogechi et al found that more than 20% of Nigerian boys and girls were underweight.12
Fig 5.
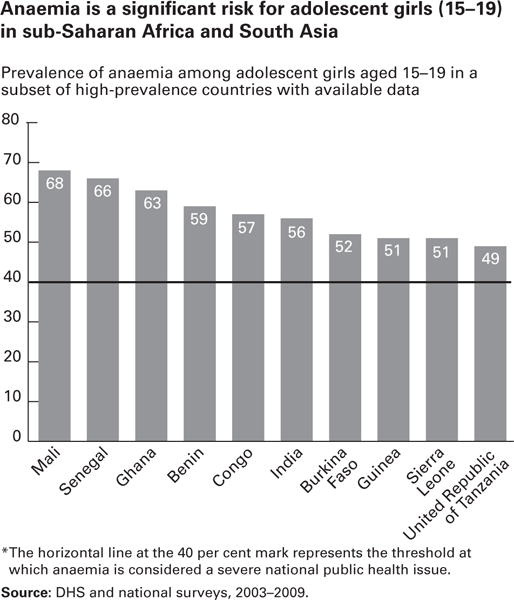
UNICEF. Adolescence: An age of opportunity. State of the World’s Children. February 2011
Ogechi et al further found that underweight was associated with diets high in carbohydrates, low in fat, and inadequate in protein, particularly among boys.12 Protein-rich foods are expensive in developing countries, and their frequent consumption is often limited to adolescents from the wealthiest families, as demonstrated in a recent study of the nutritional status and intake of adolescent Bangladeshi girls.18 Using a 7-day food frequency questionnaire, Alam et al found that girls of the highest asset quintile ate fish or meat 2.1 days per week more than girls in the lowest asset quintile and consumed eggs/milk 2 days per week more. Indeed, food insecurity (lack of access to food to meet nutritional demands) at both the household and individual levels is an important determinant of adolescent undernutrition in many developing countries and has been linked with other adverse outcomes, including psychological stress, impaired cognition, and increased school absenteeism.19,20
Finally, infection with intestinal helminths, which is associated with unclean water and unhygienic living conditions, also contributes to underweight in adolescents. Studies of government schools in Ogun State, Nigeria, revealed that in many schools tap water was not available, sanitation of latrines was poor, soap for hand washing was not present, and garbage was lying around school grounds.21 Such unsanitary conditions contributed to the high prevalence of helminth infections, with 54.9% of school children in the urban government school and 63.5% of children in the rural government school infected with Ascaris lumbricoides, Trichuris trichiura, Taenia species, and/or hookworm. These helminths can affect nutritional status through several mechanisms, including impairment of appetite and growth and, in the case of hookworm, via intestinal blood loss leading to iron deficiency.22
The link between intestinal helminths and poor nutritional status has been shown in several studies, including a recent study in Nigeria in which 32.9% of malnourished pupils (experiencing stunting, wasting, and/or underweight) versus 25.4% of nonmalnourished students attending public primary schools in Osun State were found to be infected with intestinal helminths.23 Hookworm infection, in particular, was significantly associated with underweight, wasting, and stunting, whereas Trichuris was a risk factor for stunting. Similarly, in a cross-sectional sample of 1113 individuals from Brazil,24 hookworm and Ascaris infections were prevalent among individuals aged 10 to 19 years, impacting 76.4% and 57.8% of adolescents, respectively. In combined multivariate regression analysis including children and adolescents aged 6 months to 19 years, Ascaris infection was associated with greater odds of stunting, low lean mass, and low fat mass.
Iron Deficiency
Iron deficiency is the most common nutritional deficiency worldwide.25 The rapid growth of the adolescent period, and the accompanying increases in lean body mass, blood volume, and red cell mass, exact a large toll on iron stores, making adolescence a period of peak risk for iron deficiency in both boys and girls. Adequate iron is critical in adolescence because it helps ensure full cognitive function and optimal physical performance and better prepares girls for future pregnancy.26 A recent Lancet article highlighted the long-term consequences of iron deficiency in adolescence, identifying iron-deficiency anemia as the 8th leading cause of disability-adjusted life years (DALYs) among boys aged 10 to 14 years and the 7th leading cause among girls aged 10 to 14 years.27
Because iron deficiency is the most common cause of anemia, the prevalence of anemia is typically used at the population level as an indicator of iron deficiency. The prevalence of anemia among adolescent girls aged 15 to 19 ranged from 49% to 68% in representative countries of sub-Saharan Africa and South Asia included in recent DHS and national surveys conducted between 2003 and 2009 (Fig 6),3 indicating that little has affected anemia prevalence among adolescents on a global scale since the ICRW studies (1990–1994). Anemia was in fact found to be the most significant nutritional problem experienced by adolescents in ICRW countries, with a prevalence of 55% in India, 58% in Guatemala, 55% in India, 42% in Nepal, and 32% in Cameroon.7
Fig 6.
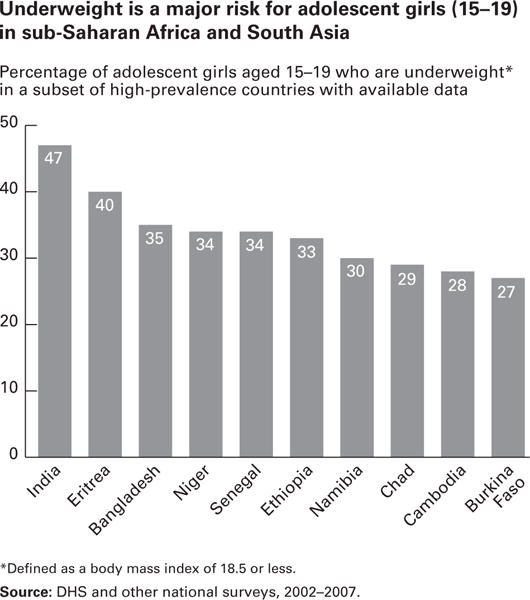
UNICEF. Adolescence: An age of opportunity. State of the World’s Children. February 2011
Both boys and girls are at risk for iron deficiency during adolescence. In boys, the iron requirement climbs rapidly from 10 to 15 mg/day during the adolescent growth spurt, but any iron deficiency during this period of rapid growth and sexual maturation can be quickly corrected as the rate of growth slows and the need for iron diminishes.28 Iron requirements also increase during adolescent growth in girls from 8 to 15 mg/day, but in contrast to boys, this increased need does not diminish following the period of rapid growth as menstruation necessitates additional dietary iron.28
In addition to the increased physiologic requirements for iron exacted by growth and menstruation, infectious diseases such as malaria and hookworm can also affect iron absorption, use, and loss in adolescents, and frequently contribute to iron deficiency in this age group. Malaria-related inflammation downregulates iron absorption at the gut level and also impairs its flux out of storage compartments, hindering its incorporation into red blood cells.29 Iron deficiency resulting from hookworm typically results from direct intestinal blood loss caused by this parasite.30
Although adolescents often don’t receive intervention priority, iron supplementation is an effective strategy for reducing anemia in this age group. The WHO recommends 3 months of preventative iron supplementation of 60 mg iron per day be given to adolescents living in areas where the population prevalence of anemia is greater than 40%.31 Daily dietary iron supplementation of adolescent girls has been shown to improve mood and the ability to concentrate in school.32 Perhaps more logistically feasible, weekly iron supplementation has also proven to be effective in reducing anemia prevalence in many developing countries.33,34 Many recent studies have further found that multiple micronutrient supplementation of adolescent girls may improve not only iron status and reduce anemia prevalence,35 but may have beneficial effects on the status of other micronutrients, including riboflavin, vitamin A, and vitamin C.36
OVERNUTRITION
Along with the problems of adolescent undernutrition, many developing countries also struggle with increasing adolescent overweight and obesity. In contrast to the more gradual process of urbanization in industrialized Western nations, the growth of large cities has occurred much more rapidly in developing countries.37 In 2009, around 50% of the world’s 1.2 billion adolescents lived in urban areas, and this proportion is predicted to grow to 70% by 2050, with the most rapid increases in developing countries (Fig 7).3 The impetus for this massive move to urban areas varies by country, but the driving forces can be dichotomized into “push factors” (eg, natural disasters, war, economic disasters, famine) and “pull factors” (eg, marriage, desire for better education or housing, job opportunities).37 The nutritional effect of this large-scale urbanization, often coined the “nutrition transition,” is that as people assume a more sedentary lifestyle, have more ready access to snack or street foods, and reduce consumption of more traditional foods, the prevalence of overweight and obesity increases substantially. Although the rise in overweight and obesity among adolescents in developing countries undergoing rapid urban growth has been described in several countries, including Brazil,38 China,39 Vietnam,40 Sudan,41 and Botswana,42,43 the phenomenon is particularly well exemplified in South Africa44–46 and India.47–50
Fig 7.
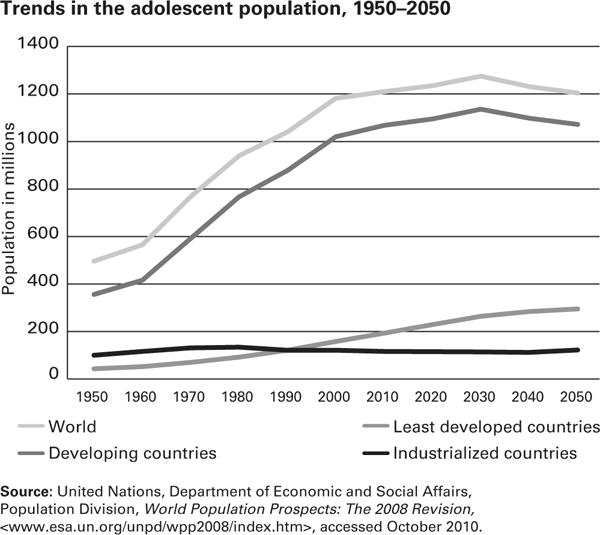
UNICEF. Adolescence: An age of opportunity. State of the World’s Children. February 2011
South Africa
South Africa has undergone rapid urbanization since the 1950s and struggles with the dual problem of coexisting undernutrition and overnutrition. The 2002 South African Youth Risk Behaviour Survey documented a combined prevalence of overweight and obesity of 21% among 13- to 19-year-olds, with a much higher prevalence among girls (25%) than boys (7%).51 National electrification of South Africa in the past few years, an increased number of televisions in homes, and a resulting reduction of physical activity among youth, have likely contributed to this prevalent overnutrition, which has recently been observed in both urban and rural areas of the country.44
In the Agincourt area of rural northeast South Africa, prevalent stunting among young children coexists with the growing problem of overnutrition among adolescents. Among youth aged 13 to 19 years in this area, the prevalence of combined overweight and obesity presented in a 2010 study was 16% among girls and 4% among boys.44 Similarly, 16% of girls and 1% of boys had a high waist circumference, potentially indicating increased risk of metabolic disease. Because this study took place in a rural, impoverished area, the setting is not identical to that typically observed in nutrition transition countries undergoing rapid urbanization. However, some components are similar. The study site was a former apartheid homeland area with plots too small for subsistence agriculture. Consequently, people in the region rely on purchased food, which may lead to less food and undernutrition among those with limited financial resources, or cheaper energy-dense food and overnutrition among those with a bit more money.
A 2011 follow-up study of predictors of weight status and central obesity among adolescents aged 10 to 20 years living in the Agincourt area identified key child, maternal, and household factors.45 Obesity increased with age and pubertal development and was much higher in girls than in boys. Potential explanations for this gender difference include more physical activity among boys and physiologic differences in fat and muscle gain. Further, cultural differences may play a role, as a larger body was observed as more beautiful among South African female adolescents in one study.52 Maternal age was associated with central obesity among adolescents. The authors postulated that this relationship may be the result of less knowledge of the adverse effects of obesity among older mothers or the possibility that older mothers may monitor their child’s behavior less, potentially affecting eating and physical activity patterns. Finally, socioeconomic status of the household, as assessed by an asset survey, was related to the odds of overweight and obesity, with a 2-fold higher odds observed among participants of the highest versus lowest socioeconomic status tertile.45
India
Extremes of undernutrition and overnutrition in India parallel the country’s extremes of poverty and wealth. Numerous studies have found that overweight and obesity are significantly more prevalent among adolescents of higher socioeconomic status and among those in urban versus rural areas.47–50 Various definitions and cutoffs for overweight and obesity further complicate assessment of the problem. Using Indian-specific BMI cutoffs, Gupta et al47 tracked secular trends in the prevalence of obesity and overweight among Indian adolescents aged 14 to 17 living in urban areas and found that the prevalence of obesity rose significantly from 9.8% in 2006 to 11.7% in 2007. In accordance with other studies, the authors reported that high socioeconomic status, predominantly assessed as attendance at private versus government-funded school, was associated with an increasing trend in overweight and obesity. However, unlike other studies, adolescent males rather than females were more likely to be overnourished. The authors pose that this finding may be because of a heightened concern over appearance among female, but not among male adolescents.
Further exploring the predictors of adolescent overweight and obesity in 12- to 17-year-old urban adolescents in Hyderabad, India, Laxmaiah et al48 found that adolescents who watched more than 3 hours per day of television were nearly twice as likely, and those of high socioeconomic were more than 4 times as likely, to be overweight or obese. Regularly playing outdoor games more than 6 hours per week or doing household activities more than 3 hours per day were associated with a lower prevalence of overweight and obesity.
Finally, a literature review of 11 studies evaluating the nutritional status of Indian school children (6–18 years) from middle- and high-income households highlighted the fact that micronutrient undernutrition can coexist with obesity and overweight.49 In these 11 studies, which utilized various cut-offs to define overnutrition, the prevalence of overweight ranged widely from 8.5% to 29.0% and the prevalence of obesity ranged between 1.5% to 7.5%. Concurrent with this overnutrition, the prevalence of anemia ranged from 19% to 88%, and deficiencies of folate (nearly 100%), riboflavin, niacin, vitamin C, vitamin A, and vitamin B12 were also reported to be common (40–60% prevalence for each) in one study included in the review.
A LINK BETWEEN UNDERNUTRITION AND OVERNUTRITION?
In addition to environmental factors contributing to the increasing prevalence of overweight and obesity in many countries undergoing the nutrition transition, it is possible that the childhood undernutrition, prevalent in many of these countries, may predispose individuals to obesity and associated chronic diseases later in life. A wide body of literature describes how poor fetal and childhood developmental programming, including intrauterine growth restriction and childhood stunting, can lead to obesity and chronic disease later in life, particularly if an individual shifts from an environment of deprivation to one of relatively more wealth and abundance.
Although seemingly unrelated, the nutritional problems of undernutrition and over-nutrition among adolescents in developing countries are intricately woven together in an intergenerational cycle of malnutrition. As described by a United Nations Standing Committee on Nutrition in 2000 and depicted in Figure 8,28 a malnourished mother is more likely to have inadequate pregnancy weight gain, contributing to inadequate fetal nutrition and a low birth weight infant. Low birth weight infants in developing countries are often born into environments where proper nutrition, health care, and sanitation are lacking and infectious disease is prevalent. Consequently the young child experiences stunted growth and, remaining in the same environment, becomes a stunted adolescent. If an adolescent who is stunted or consumes an inadequate diet becomes pregnant, she is at higher risk of delivering a low birth weight infant, and the cycle begins again. However, if the environment of the child who was low birth weight or experienced stunted growth changes to one with more ready access to food, greater wealth, and less physical activity, the risk of obesity and associated chronic disease later in life may be elevated.
Fig 8.
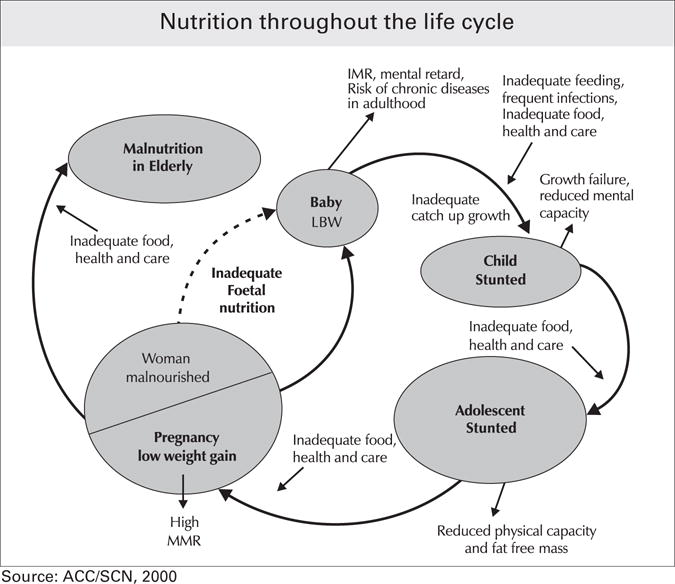
World Health Organization. Adolescent nutrition: a review of the situation in selected South-East Asian countries. 2006. Available at: http://www.searo.who.int/EN/Section13/Section38_11624.htm. Accessed April 14, 2012
CONCLUSIONS
Several intervention points exist where this cycle of intergenerational malnutrition could be disrupted. One is to promote growth and improve nutritional status in early childhood, through food supplementation programs, breastfeeding promotion, and nutritional guidance during weaning, along with control of infectious disease. Another is to increase awareness of the benefits of postponing the age of marriage so that women enter into pregnancy with optimal nutritional status and have a lower risk of pregnancy complications. Roughly 16 million adolescent girls aged 15 to 19 years give birth each year, representing about 11% of all births worldwide.53 Ninety-five percent of these births to adolescent mothers occur in low- and middle-income countries.53 Pregnancy exacts a profound nutritional toll on an adolescent girl, increasing her requirement for both macronutrients and micronutrients. The increased nutritional needs of the mother are in direct competition with those of the fetus, particularly if the mother is still growing herself.54 Increasing evidence also suggests that intrauterine growth restriction can increase the risk for obesity and chronic disease in adulthood,55 while maternal hemoglobin can affect infant hemoglobin concentration for up to 12 months after birth.56
Intervention at any of these generational stages would result in improved nutritional status and health of adolescents. Improving the nutritional status of adolescents not only breaks the vicious cycle of intergenerational malnutrition, but it also optimizes the individual talents, skills, and potential of this critical group, increasing quality of life and the productivity of nations.
References
- 1.World Health Organization. Maternal, newborn, child and adolescent health. Adolescent development page. Available at: http://www.who.int/maternal_child_adolescent/topics/adolescence/dev/. Accessed April 13, 2012.
- 2.Cordeiro L, Lamstein S, Mahmud Z, Levinson F. Adolescent malnutrition in developing countries: a close look at the problem and at two national experiences. SCN News. (31) Late 2005 – Early 2006. [Google Scholar]
- 3.UNICEF. Adolescence: an age of opportunity. State of the World’s Children. 2011 Feb; [Google Scholar]
- 4.WHO Expert Committee. Adolescents. In: WHO, editor. Physical status: The use and interpretation of anthropometry. Geneva, Switzerland: 1995. pp. 263–311. [Google Scholar]
- 5.Cole T, Bellizzi M, Flegal K, Dietz W. Establishing a standard definition for child overweight and obesity worldwide: international survey. BMJ. 2000;320:1240–1243. doi: 10.1136/bmj.320.7244.1240. [DOI] [PMC free article] [PubMed] [Google Scholar]
- 6.Cole T, Flegal K, Nicholis D, Jackson A. Body mass index cut offs to define thinness in children and adolescents: international survey. BMJ. 2007;335:194. doi: 10.1136/bmj.39238.399444.55. article first published online Jun 25. [DOI] [PMC free article] [PubMed] [Google Scholar]
- 7.Kurtz K. Adolescent nutritional status in developing countries. Proc Nut Soc. 1996;55:321–331. [PubMed] [Google Scholar]
- 8.Regmi S, Adhikari R. Nutrition of Adolescent Girls Research Program. 6. Washington, D.C.: International Center for Research on Women; 1994. A study on the factors influencing nutritional status of adolescent girls in Nepal. [Google Scholar]
- 9.de Grijalva Y, de Grijalva I. Nutrition of Adolescent Girls Research Program. 11. Washington, D.C.: International Center for Research on Women; 1994. Improving nutritional practices of Ecuadorian adolescents. [Google Scholar]
- 10.Leenstra T, Petersen L, Kariuki S, Oloo A, Kager P, ter Kuile F. Prevalence and severity of malnutrition and age at menarche; cross-sectional studies in adolescent schoolgirls in western Kenya. Eur J Clin Nutr. 2005;59:41–48. doi: 10.1038/sj.ejcn.1602031. [DOI] [PubMed] [Google Scholar]
- 11.Jafar T, Qadri Z, Islam M, Hatcher J, Bhutta Z, Chaturvedi N. Rise in childhood obesity with persistently high rates of undernutrition among urban school-aged Indo-Asian children. Arch Dis Child. 2008;93:373–378. doi: 10.1136/adc.2007.125641. [DOI] [PMC free article] [PubMed] [Google Scholar]
- 12.Ogechi P, Akhakhia I, Ugwunna A. Nutritional status and energy intake of adolescents in Umuahia Urban, Nigeria. Pakistan Journal of Nutrition. 2007;6:641–646. [Google Scholar]
- 13.Coly A, Milet J, Diallo A, et al. Preschool stunting, adolescent migration, catch-up growth, and adult height in young Senegalese men and women of rural origin. J Nutr. 2006;136:2414–2420. doi: 10.1093/jn/136.9.2412. [DOI] [PubMed] [Google Scholar]
- 14.Kurtz K. Adolescent Growth. UN system archives. Available at: http://www.unsystem.org/SCN/archives/scnnews11/ch04.htm. Accessed April 14, 2012.
- 15.Delisle H, Chandra-Mouli V, de Benoist B. Should adolescents be specifically targeted for nutrition in developing countries? To address which problems and how? Available at: http://www.idpas.org/pdf/1803ShouldAdolescentsBeTargeted.pdf. Accessed April 14, 2012.
- 16.Kulin H, Bwibo N, Mutie D, Santner B. The effect of chronic childhood malnutrition on pubertal growth and development. Am J Clin Nutr. 1982;36:527–536. doi: 10.1093/ajcn/36.3.527. [DOI] [PubMed] [Google Scholar]
- 17.Proos L. Growth and development of Indian children adopted in Sweden. Indian J Med Res. 2009;130:646–650. [PubMed] [Google Scholar]
- 18.Alam N, Roy S, Ahmed T, Ahmed A. Nutritional status, dietary intake, and relevant knowledge of adolescent girls in rural Bangladesh. J Health Popul Nutr. 2010;28:86–94. doi: 10.3329/jhpn.v28i1.4527. [DOI] [PMC free article] [PubMed] [Google Scholar]
- 19.Belachew T, Hadley C, Lindstrom D, Gebremariam A, Lachat C, Kolsteren P. Food insecurity, school absenteeism and educational attainment of adolescents in Jimma Zone Southwest Ethiopia: a longitudinal study. Nutr J. 2011;10:29. doi: 10.1186/1475-2891-10-29. [DOI] [PMC free article] [PubMed] [Google Scholar]
- 20.Hamelin A, Habicht J, Beaudry M. Food insecurity: consequences for the household and broader social implications. J Nutr. 1999;129:525S–528S. doi: 10.1093/jn/129.2.525S. [DOI] [PubMed] [Google Scholar]
- 21.Ekpo U, Odoemene S, Mafina C, Sam-Wobo S. Helminthiasis and hygiene conditions of schools in Ikenne, Ogun State, Nigeria. PLoS Neglected Tropical Diseases. 2008;2:e146. doi: 10.1371/journal.pntd.0000146. [DOI] [PMC free article] [PubMed] [Google Scholar]
- 22.World Bank Publications. Adolescent nutrition. Available at: http://web.worldbank.org/WBSITE/EXTERNAL/TOPICS/EXTHEALTHNUTRITIONANDPOPULATION/EXTNUTRITION/0,,contentMDK:20206757,menuPK:483704,pagePK:148956,piPK:216618,theSitePK:282575,00.html. Accessed April 14, 2012.
- 23.Oninla S, Onayade A, Owa J. Impact of intestinal helminthiasis on the nutritional status of primary-school children in Osun state, south-western Nigeria. Ann Trop Med Parasitol. 2010;104:583–594. doi: 10.1179/136485910X12851868779786. [DOI] [PubMed] [Google Scholar]
- 24.Jardim-Botelho A, Brooker S, Geiger S. Age patterns in undernutrition and helminth infection in a rural area of Brazil. Trop Med Int Health. 2008;13:454–467. doi: 10.1111/j.1365-3156.2008.02022.x. [DOI] [PMC free article] [PubMed] [Google Scholar]
- 25.World Health Organization. Micronutrient deficiencies: iron deficiency anaemia. Available at: http://www.who.int/nutrition/topics/ida/en/. Accessed April 14, 2012.
- 26.Lynch S. The potential impact of iron supplementation during adolescence on iron status in pregnancy. J Nutr. 2000;130(Suppl 2S):448S–451S. doi: 10.1093/jn/130.2.448S. [DOI] [PubMed] [Google Scholar]
- 27.Gore F, Bloem P, Patton G, et al. Global burden of disease in young people aged 10–24 years: a systematic analysis. Lancet. 2011;277:2093–2102. doi: 10.1016/S0140-6736(11)60512-6. [DOI] [PubMed] [Google Scholar]
- 28.World Health Organization. Adolescent nutrition: a review of the situation in selected South-East Asian countries. 2006 Available at: http://www.searo.who.int/EN/Section13/Section38_11624.htm. Accessed April 14, 2012.
- 29.Nweneka C, Doherty C, Cox S, Prentice A. Iron delocalisation in the pathogenesis of malarial anaemia. Trans R Soc Trop Med Hyg. 2010;104:175–184. doi: 10.1016/j.trstmh.2009.08.007. [DOI] [PubMed] [Google Scholar]
- 30.Stephenson L. Helminth parasites, a major factor in malnutrition. World Health Forum. 1994;15:169–172. [PubMed] [Google Scholar]
- 31.World Health Organization. Iron deficiency anaemia: assessment, prevention, and control. A guide for programme managers. 2001 Available at: http://whqlibdoc.who.int/hq/2001/WHO_NHD_01.3.pdf. Accessed April 14, 2012.
- 32.Ballin A, Berar M, Rubinstein U, Kleter Y, Hershkovitz A, Meytes D. Iron state in female adolescents. Am J Dis Child. 1992;146:803–805. doi: 10.1001/archpedi.1992.02160190035015. [DOI] [PubMed] [Google Scholar]
- 33.Deshmukh P, Garg B, Bharambe M. Effectiveness of weekly supplementation of iron to control anemia among adolescent girls of Nashik, Maharashtra, India. J Health Popul Nutr. 2008;26:74–78. [PMC free article] [PubMed] [Google Scholar]
- 34.Kotecha P, Nirupam S, Karkar P. Adolescent girls’ anaemia control programme, Gujarat, India. Indian J Med Res. 2009;130:584–589. [PubMed] [Google Scholar]
- 35.Ahmed F, Khan M, Akhtaruzzaman M, et al. Effect of long-term intermittent supplementation with multiple micronutrients compared with ion-and-folic acid supplementation on Hb and micronutrient status of non-anaemic adolescent schoolgirls in rural Bangladesh. Br J Nutr. 2012;16:1–10. doi: 10.1017/S0007114511006908. [DOI] [PubMed] [Google Scholar]
- 36.Ahmed F, Khan M, Akhtaruzzaman M, et al. Long-term intermittent multiple micronutrient supplementation enhances hemoglobin and micronutrient status more than iron1folic acid supplementation in Bangladeshi rural adolescent girls with nutritional anemia. J Nutr. 2010;140:1879–1886. doi: 10.3945/jn.109.119123. [DOI] [PubMed] [Google Scholar]
- 37.Godfrey R, Julien M. Urbanisation and health. Clin Med. 2005;5:137–141. doi: 10.7861/clinmedicine.5-2-137. [DOI] [PMC free article] [PubMed] [Google Scholar]
- 38.Kac G, Velasquez-Melendez G, Schlussel M, Segall-Correa A, Silva A, Perez-Escamilla R. Severe food insecurity is associated with obesity among Brazilian adolescent females. Public Health Nutr. 2012;17:1–7. doi: 10.1017/S1368980011003582. [DOI] [PubMed] [Google Scholar]
- 39.Cui Z, Dibley M. Trends in dietary energy, fat, carbohydrate and protein intake in Chinese children and adolescents from 1991 to 2009. Br J Nutr. 2012;16:1–8. doi: 10.1017/S0007114511006891. [DOI] [PMC free article] [PubMed] [Google Scholar]
- 40.Tang H, Dibley M, Sibbritt D. Gender and socio-economic differences in BMI of secondary high school students in Ho Chi Minh City. Asia Pac J Clin Nutr. 2007;16:74–83. [PubMed] [Google Scholar]
- 41.Nagwa M, Elhussein A, Azza M, Abdulhadi N. Alarming high prevalence of overweight/obesity among Sudanese children. Eur J Clin Nutr. 2011;65:409–411. doi: 10.1038/ejcn.2010.253. [DOI] [PubMed] [Google Scholar]
- 42.Wrotniak B, Malete L, Maruapula S, et al. Association between socioeconomic status indicators and obesity in adolescent students in Botswana, an African country in rapid nutrition transition. Pediatr Obes. 2012;7:e9–e13. doi: 10.1111/j.2047-6310.2011.00023.x. [DOI] [PubMed] [Google Scholar]
- 43.Maruapula S, Jackson J, Holsten J, et al. Socio-economic status and urbanization are linked to snacks and obesity in adolescents in Botswana. Public Health Nutr. 2011;14:2260–2267. doi: 10.1017/S1368980011001339. [DOI] [PubMed] [Google Scholar]
- 44.Kimani-Murage E, Kahn K, Pettifor J, et al. The prevalence of stunting, overweight and obesity, and metabolic disease risk in rural South African children. BMC Public Health. 2010;10:158. doi: 10.1186/1471-2458-10-158. [DOI] [PMC free article] [PubMed] [Google Scholar]
- 45.Kimani-Murage E, Kahn K, Pettifor J, Tollman S, Klipstein-Grobusch K, Norris S. Predictors of adolescent weight status and central obesity in rural South Africa. Public Health Nutr. 2011;14:1114–1122. doi: 10.1017/S1368980011000139. [DOI] [PMC free article] [PubMed] [Google Scholar]
- 46.Kruger R, Kruger H, MacIntyre U. The determinants of overweight and obesity among 10- to 15-year-old school children in the North West Province, South Africa – the THUSA BANA (Transition and Health during Urbanisation of South Africans; BANA, children) study. Public Health Nutr. 2005;9:351–358. doi: 10.1079/phn2006849. [DOI] [PubMed] [Google Scholar]
- 47.Gupta D, Shah P, Misra A, et al. Secular trends in prevalence of overweight and obesity from 2006–2009 in urban Asian Indian adolescents aged 14–17 years. PLoS One. 2011;6:e17221. doi: 10.1371/journal.pone.0017221. [DOI] [PMC free article] [PubMed] [Google Scholar]
- 48.Laxmaiah A, Nagalla B, Vijayaraghavan K, Nair M. Factors affecting prevalence of overweight among 12- to 17-year-old urban adolescents in Hyderabad, India. Obesity. 2007;6:1384–1390. doi: 10.1038/oby.2007.165. [DOI] [PubMed] [Google Scholar]
- 49.Srihari G, Eilander A, Muthayya S, Kurpad A, Seshadri S. Nutritional status of affluent Indian school children: what and how much do we know? Indian Pediatr. 2007;44:204–213. [PubMed] [Google Scholar]
- 50.Stigler M, Arora M, Dhavan P, Shrivastav R, Reddy K, Perry C. Weight-related concerns and weight-control behaviors among overweight adolescents in Delhi, India: a cross-sectional story. Int J Behav Nutr Phys Act. 2011;8:9. doi: 10.1186/1479-5868-8-9. [DOI] [PMC free article] [PubMed] [Google Scholar]
- 51.Reddy S, Resnicow K, James S, Kambaran N, Omardien R, Mbewu A. Underweight, overweight and obesity among South African adolescents: results of the 2002 National Youth Risk Behaviour Survey. Public Health Nutr. 2008:1–5. doi: 10.1017/S1368980008002656. [DOI] [PubMed] [Google Scholar]
- 52.McHiza Z, Goedecke J, Lambert E. Intra-familial and ethnic effects on attitudinal and perceptual body image: a cohort of South African mother-daughter dyads. BMC Public Health. 2011;11:433. doi: 10.1186/1471-2458-11-433. [DOI] [PMC free article] [PubMed] [Google Scholar]
- 53.World Health Organization. Maternal, newborn, child and adolescent health. Adolescent pregnancy. Available at: http://www.who.int/maternal_child_adolescent/topics/maternal/adolescent_pregnancy/en/index.html. Accessed April 14, 2012.
- 54.Stang J. Physical and Psychosocial Growth and Development of Adolescents. In: Guidelines for Adolescent Nutrition Services; Story M, Stang J, Alton I, editors. Leadership, Education and Training Program in Maternal and Child Nutrition. University of Minnesota; Minneapolis, MN: Expected Released May 2003; updated May 2011. [Google Scholar]
- 55.Barker D. The origins of the developmental origins theory. J Intern Med. 2007;261:412–417. doi: 10.1111/j.1365-2796.2007.01809.x. [DOI] [PubMed] [Google Scholar]
- 56.Miller MF, Stoltzfus RJ, Mbuya N. Total body iron in HIV-positive and HIV-negative Zimbabwean newborns strongly predicts anemia throughout infancy and is predicted by maternal hemoglobin concentration. J Nutr. 2003;133:3461–3468. doi: 10.1093/jn/133.11.3461. [DOI] [PubMed] [Google Scholar]


