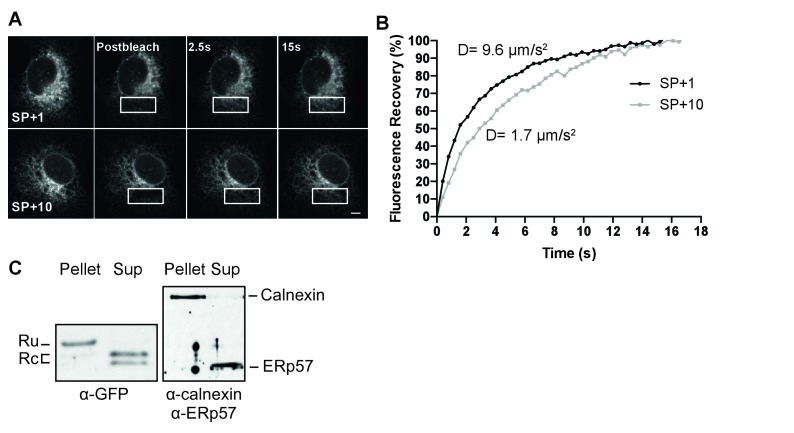
Figure 4. The uncleaved signal peptide acts as a signal anchor.
(A) FRAP analysis of gp160 signal-peptide constructs as in Figure 2. Cos-7 cells expressing SP+1 and SP+10 GFP reporters were subjected to FRAP analysis. A small region of interest (white outlined box) was photobleached with intense laser light and imaged with low laser light to visually (A) and quantitatively (B) compare mobilities and fluorescence-intensity recovery rates. (A) Both reporters are mobile and unbleached reporters diffuse into the photobleached region of interest. Scale bar = 10 μm. (B) Plot of representative fluorescence recoveries into the photobleach region of interest reveals that SP+10 is slower to recover. Number of cells analyzed, diffusion constants and, statistical values can be found in Figure 4—source data 1. (C) Western Blot analysis of pellet and supernatant (sup) fractions from a carbonate extraction of cells expressing SP+10. Split band for GFP in Sup is likely due to fragmentation (Wei et al., 2015). Blots in panel C are representative of at least two independent experiments (biological replicates).

