

Abstract
Objectives
The objectives of this study were to estimate trends in the prevalence of infections in nursing home (NH) residents using 2006 – 2013 Minimum Data Set (MDS) data, estimate the number of all infections in 2013, and evaluate differences in trends between MDS versions 2.0 and 3.0.
Design
Retrospective study.
Setting
NHs in the United States.
Participants
All NH residents with a quarterly or annual MDS assessment in 2006 – 2013 (n=30,366,807 assessments).
Measurements
MDS 2.0 and 3.0 quarterly and annual assessment data (2006–2013) from over 15,000 NHs were used to estimate the 7-day prevalence of multidrug-resistant organism (MDRO) infection, pneumonia, septicemia, viral hepatitis, and wound infection and 30-day prevalence of urinary tract infection (UTI). Admission assessments were excluded. Annual infection counts were estimated using 2013 data. Changes in the prevalence of reported infections over time and differences in trends between MDS 2.0 and 3.0 were examined using tests of linear trends.
Results
In 2013, there were an estimated 1.13 to 2.68 million infections in NH residents. UTI and pneumonia were the most commonly reported infections in every quarter ranging from 5.6 – 8.1% and 1.4 – 2.5%, respectively. Prevalence of all infections increased in 2006 – 2010 (P-values <0.01). In 2011 – 2013, prevalence of UTI, MDRO, and wound infections decreased and viral hepatitis increased (P-values <0.0001). Between MDS 2.0 and 3.0, the prevalence of UTI, MDRO, and wound infections decreased and the prevalence of viral hepatitis increased (P-values <0.0001).
Conclusion
Infections are a major and persistent problem in NHs. While MDS data are useful for identifying trends in infection prevalence, revisions in definitions need to be accounted for when evaluating trends over time. Additional research is needed to identify factors that contribute to changes in infection prevalence.
Keywords: nursing homes, long term care, infections, minimum data set
Introduction
Healthcare-associated infections (HAIs) are a leading cause of morbidity and mortality among nursing home (NH) residents in the US. In 2000, it was estimated that between 1.6 – 3.8 million occurred annually among the approximately 1.5 million NH residents.1 However, these estimates were based on small cross-sectional studies conducted in the 1970’s to 1990’s. Using 2004 National Nursing Home Survey data, Dwyer et al. estimated that 12% of residents had an infection at the time of the survey.2 In light of these data, there has been increasing focus on infections that occur in NHs. In 2013, the US Department of Health and Human Services updated the National Action Plan to Prevent HAIs: Road Map to Elimination to address HAIs that occur in long-term care (LTC) settings and recommended that baseline HAI incidence data be obtained.3 In 2012, the CDC launched the National Healthcare Safety Network (NHSN) LTC facility component that uses standardized HAI definitions for web-based infection surveillance. As of December 2016, almost 12% of the 15,700 NHs across the country had enrolled.4 And in 2016, the Centers for Medicare & Medicaid Services revised the requirements for LTC facilities; by November 2019 all facilities will be required to have an infection prevention and control program with a trained infection preventionist and that includes antibiotic stewardship and infection surveillance.5
In the US, recording resident health using the Minimum Data Set (MDS) is federally mandated for all residents of Medicare- or Medicaid-certified nursing facilities. Assessments are required at admission, quarterly, and upon significant change in status to broadly measure resident acuity level and functional status. The MDS serves as a source of information for reimbursement purposes as well as to assess individual resident needs, track changes in clinical status, and develop individualized care plans. The uses of MDS data have expanded since its introduction in 19906,7 and studies assessing item reliability and validity have, overall, supported using these data to evaluate resident outcomes.8–14 Indeed, a number of studies have used MDS data to measure infection-related outcomes including the presence of venous ulcers,15 pneumonia,16 urinary tract infection (UTI),11,17,18 human immunodeficiency virus,19 Clostridium difficile infection (CDI),20–23 and antibiotic resistance.20,24
In the absence of a widely adopted national infection surveillance system, the MDS currently provides the most comprehensive source of data to evaluate national infection trends in NH residents; however, revisions pose a potential problem for the development of trend estimates. The most recent version, MDS 3.0, was implemented in 2010 and includes significant changes in clinical items from MDS 2.0, which have been described elsewhere.25,26 A national test of MDS 3.0 items was conducted in 71 NHs and demonstrated very good to excellent reliability between research and facility nurse assessments and the items tended to perform better than equivalent MDS 2.0 items.27,28 In addition, items in MDS 3.0 that measure cognition, behavior, and mood where found to have improved validity compared with MDS 2.0 items.28–30 With the increasing focus on infections in NH settings and the need to assess baseline infection outcomes, the objectives of this study were to (1) estimate trends in the prevalence of specific infections in NH residents in the US from 2006 through 2013, (2) estimate the prevalence of all infections in NH residents in 2013, and (3) evaluate differences in infection trends between MDS 2.0 and 3.0.
Methods
Sample and setting
Routinely scheduled annual and quarterly MDS 2.0 (2006 Quarter [Q] 1 – 2010 Q3) and MDS 3.0 (2010 Q4 – 2013 Q4) NH resident assessment data were used. Admission assessments were excluded to reduce the likelihood of including infections present on admission to the NH. For most items, resident status is captured during a look-back period that varies depending upon the item (e.g., 7, 14, or 30 days). Infections that occur outside the MDS look-back period for routine quarterly and annual assessments do not consistently trigger significant change in status assessments because they might not meet all of the criteria.31 Therefore, infection prevalence was determined based on the routinely scheduled assessments. The MDS infection items evaluated were: antibiotic resistant infection/multidrug-resistant organisms (MDRO), pneumonia, septicemia, UTI, viral hepatitis, and wound infection. Additionally, infection items in the MDS 2.0 and 3.0 were examined and compared based on definition, look-back period, and response coding (see Appendix for detailed description).
Estimation of infection prevalence and evaluation of trends
To be consistent with MDS infection definition look-back periods, measures of prevalence were defined as 7-day prevalence for each quarter with the exception of UTI, which has a 30-day look-back period and, therefore, 30-day prevalence was estimated. Assessment-level linear regression models were used to estimate reported infection prevalence per quarter and, separately, to identify prevalence trends over time. Robust standard errors, clustered at the NH level, were calculated to account for correlation within facilities.
Using the most recent data available (2013 Q4), the total number of resident assessments during that quarter, and estimates of 7-day prevalence (30-day prevalence for UTI), we estimated the total number of infections in 2013. We extrapolated the data to approximate the number of infections that are not captured in the MDS because the routine assessments are performed quarterly and the look-back periods are 7 and 30 days. These extrapolations were calculated assuming two infection durations: 1 week and 1 month.
Tests of linear trends over time were used to assess changes in infection prevalence over the MDS 2.0 and 3.0 periods, separately. We specified models that allowed for the shift from MDS 2.0 to 3.0 by including a separate intercept and time trend for MDS 3.0, and we tested for shifts (i.e., changes in the intercept) and differences in the time trends during the two periods. To account for the transition from MDS 2.0 to 3.0, and potential problems associated with the implementation of definitional changes and variations in data collection and reporting, the first four quarters of MDS 3.0 data (i.e., 2010 Q4 – 2011 Q3) were considered a “transitional period” and were not included in our analyses of trends.
A post hoc analysis was conducted to evaluate trends in indwelling urinary catheter use given its potential contribution to changes in UTI. The indwelling catheter item has a 14-day and 7-day look-back period on the MDS 2.0 and 3.0, respectively. Prevalence and tests of linear trends were estimated as described above for infections. All analyses were conducted in Stata, Version 12.0 (College Station, TX) and a significance level of 0.05 was set a priori. The institutional review boards at Columbia University Medical Center and RAND Corporation approved the study and a waiver of consent was obtained.
Results
Infection prevalence
MDS data from 32 quarters (15,122 – 15,228 NHs per quarter; n = 30,366,807 assessments total) were used to calculate the prevalence of reported infections. In 2013, there were an estimated 1.13 to 2.68 million infections in NH residents (Table 1). Table 2 summarizes the number of NHs, residents, assessments, and the infection prevalence for the fourth quarter of each year of the study period. Because some residents had more than one assessment within a calendar quarter, the number of assessments per quarter exceeded the number of residents. UTI was the most common infection in all time periods, followed by pneumonia; 30-day prevalence of UTI ranged from 5.6 – 8.1% and 7-day prevalence of pneumonia ranged from 1.4 –2.5%, across all 32 quarters.
Table 1.
Estimated Number of Infections in United States Nursing Homes in 2013
| Count of infections
|
||
|---|---|---|
| Infection type | Assuming 1 month duration | Assuming 1 week duration |
|
|
||
| UTI | 660,553 | 660,553 |
| Pneumonia | 1,071,603 | 247,293 |
| MDRO | 394,131 | 90,953 |
| Wound infection | 287,203 | 66,278 |
| Septicemia | 142,314 | 32,842 |
| Viral hepatitis | 125,523 | 28,967 |
| Total | 2,681,327 | 1,126,886 |
Note: MDRO = multidrug-resistant organism infection; UTI = urinary tract infection.
Table 2.
Infection Prevalence in Minimum Data Set Versions 2.0 and 3.0 in Quarter 4, 2006 – 2013
| Year, Quarter | Number of NHs | Number of residents | Number of assessments | % of assessments with diagnosis*
|
|||||
|---|---|---|---|---|---|---|---|---|---|
| UTI | Pneumonia | MDRO | Wound infection | Septicemia | Viral hepatitis | ||||
|
MDS 2.0
| |||||||||
| 2006 Q4 | 15,185 | 916,688 | 968,086 | 7.75 | 1.46 | 0.94 | 1.04 | 0.19 | 0.06 |
| 2007 Q4 | 15,169 | 903,980 | 957,141 | 7.94 | 1.48 | 1.03 | 1.07 | 0.19 | 0.06 |
| 2008 Q4 | 15,145 | 886,705 | 947,551 | 8.07 | 1.61 | 1.12 | 1.09 | 0.20 | 0.07 |
| 2009 Q4 | 15,149 | 875,927 | 940,696 | 7.86 | 1.62 | 1.10 | 1.09 | 0.19 | 0.08 |
|
MDS 3.0 | |||||||||
| 2010 Q4 | 15,168 | 930,111 | 987,659 | 6.21 | 1.92 | 0.79 | 0.64 | 0.28 | 0.14 |
| 2011 Q4 | 15,205 | 928,533 | 1,000,527 | 7.12 | 2.09 | 0.84 | 0.65 | 0.27 | 0.17 |
| 2012 Q4 | 15,202 | 919,951 | 996,952 | 6.31 | 2.07 | 0.78 | 0.57 | 0.27 | 0.21 |
| 2013 Q4 | 15,210 | 908,985 | 990,519 | 5.56 | 2.08 | 0.77 | 0.56 | 0.27 | 0.24 |
Note: NH = nursing home; UTI = urinary tract infection; MDRO = multidrug-resistant organism infection; MDS = Minimum Data Set; Q = quarter.
Estimates are the 7-day prevalence for each infection type except for urinary tract infection, which are the 30-day prevalence.
Infection trends over time
Table 3 and the Figure show trends in reported infections over time. Based on the MDS 2.0 data, from 2006 to 2010 there were increases in the prevalence of all infection types (P-values <0.01), with the greatest annual increase in infections for MDRO and UTI (0.049 and 0.046 percentage points per year, respectively). Based on the 2011 to 2013 MDS 3.0 data, there were decreases in UTI, MDRO, and wound infections over time and the prevalence of viral hepatitis increased (P-values <0.0001). The greatest annual change in infection was seen for UTI, with a 0.82 decrease per year. The prevalence of indwelling catheter use ranged from 5.1 – 5.5% across all 32 quarters and there was a 0.041 per year percentage point decrease across the study period (P-value <0.0001; data not shown).
Table 3.
Infection Trends in Minimum Data Set Versions 2.0 and 3.0
| Infection type | MDS 2.0 (2006 Q1 – 2010 Q3) Linear Trend | MDS 3.0 (2011 Q4 – 2013 Q4) Linear Trend | MDS 2.0 and 3.0 Difference in Trend | |||
|---|---|---|---|---|---|---|
|
| ||||||
| Annual change in % | P-value | Annual change in % | P-value | Annual change in % | P-value | |
| UTI | 0.046 | <0.0001 | −0.820 | <0.0001 | −0.866 | <0.0001 |
| Pneumonia | 0.028 | <0.0001 | 0.009 | 0.51 | −0.019 | 0.21 |
| MDRO | 0.049 | <0.0001 | −0.037 | <0.0001 | −0.086 | <0.0001 |
| Wound infection | 0.013 | 0.0001 | −0.038 | <0.0001 | −0.050 | <0.0001 |
| Septicemia | 0.003 | 0.01 | −0.002 | 0.56 | −0.006 | 0.19 |
| Viral hepatitis | 0.008 | <0.0001 | 0.036 | <0.0001 | 0.028 | <0.0001 |
Note: MDS = Minimum Data Set; Q = quarter; MDRO = multidrug-resistant organism infection; UTI = urinary tract infection.
Figure. Infection trends among residents in US nursing homes, 2006 – 2013.
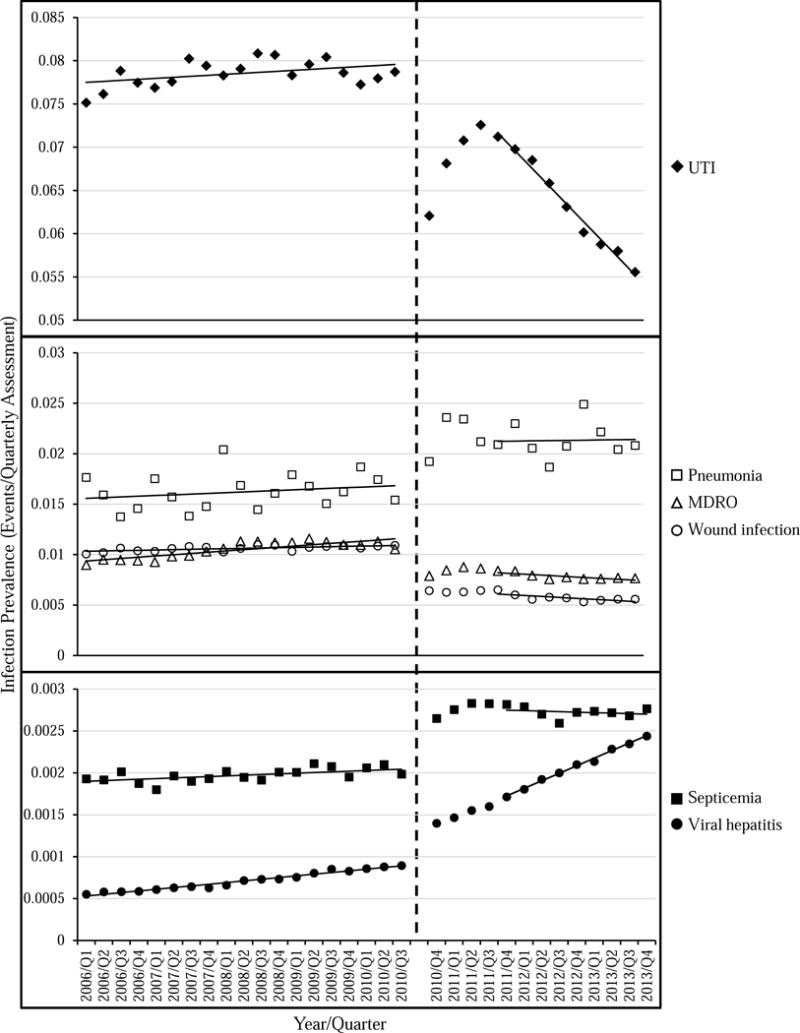
Trends in the 7-day infection prevalence (30-day prevalence for UTI) among residents in US nursing homes from 2006 through 2013. Observed prevalence values are denoted by symbols and trends are shown as solid lines (the first four quarters of MDS 3.0 data were excluded from the trend analyses). The vertical dashed line represents implementation of MDS 3.0. Note the y-axis scale varies across panels. UTI = urinary tract infection; MDRO = multidrug-resistant organism; Q = quarter.
There were differences in infection trends between MDS 2.0 and 3.0. UTI, MDRO, and wound infections decreased (−0.866, −0.086, and −0.050 percentage points per year, respectively; P-values <0.0001) and viral hepatitis increased (0.028 percentage points, P-values <0.0001), after accounting for potential shifts in infection measures attributable to the revised MDS 3.0. A detailed summary and comparison of infection items in the MDS 2.0 and 3.0 are in the Appendix. Key changes in the revised MDS 3.0 were the definition of UTI, which included more specific signs or symptoms as well as evidence that the resident received UTI treatment, and the look-back period for active diagnoses (which includes the infections evaluated here). In MDS 2.0, active diagnosis items had only a single look-back period; equivalent items in the MDS 3.0 had two look-back periods: (1) a 60-day disease identification period and (2) a 7-day active diagnosis period (30-day for UTI) to determine if the diagnosis is active.
Discussion
In this comprehensive and nationally representative report we estimated that during 2013 there were between 1.13 and 2.68 million infections in NH residents. While this estimate is slightly lower than previous ones from before 2000 (1.6 to 3.8 million), it demonstrates that infections in US NHs are still a frequent and persistent problem.1 Between 2006 and 2010, increases in reported prevalence were identified for all six infections evaluated; however, between 2011 and 2013, only the prevalence of viral hepatitis increased and UTI, MDROs, and wound infections decreased. Our finding that UTI and pneumonia were the most commonly reported infections is consistent with a previous NH survey conducted in 2004.2 Furthermore, similar to the findings presented here, significant increases in the annual prevalence of antibiotic-resistant bacteria and CDI were identified using MDS data from 2000 – 200420 and, in a separate study, the quarterly prevalence of MDRO infection decreased from October 2010 to December 2011.24
Viral hepatitis was the only infection with increasing prevalence across the entire study period. Centers for Disease Control and Prevention (CDC) reports of hepatitis outbreaks in LTC from 1998 to 2013 show that almost all outbreaks were related to hepatitis B virus acquisition resulting from patient-to-patient transmission due to breaches in infection control guidelines during assisted blood glucose monitoring.32,33 Furthermore, the CDC recently augmented hepatitis C virus screening recommendations to include those born between 1945 and 1965.34 The MDS does not distinguish between hepatitis virus types so it is uncertain what drove the observed increases, however, they likely reflect outbreaks, an increasing burden of chronic hepatitis C virus infection in aging populations, increased surveillance as well as a cumulative effect of these chronic infections.35–37
We identified shifts in the prevalence of all infections in the transition from MDS 2.0 to 3.0, and these shifts are likely a reflection of definitional changes. Unlike in the MDS 2.0, for an infection to be recorded in the MDS 3.0 both a documented diagnosis in the previous 60 days and a determination that the diagnosis is still active in the last 7 days (30 days for UTI) is required. Because disease diagnoses are subject to this 60-day identification look-back period as well as to the shorter active diagnosis status period, this would likely result in a change in the identification and recording of infections in the MDS 3.0. Additionally, some items included in both versions of the MDS had different definitions or response coding. Therefore, observed trends between MDS 2.0 and 3.0 likely reflect definitional changes as well as true shifts in trends.
Of particular importance is the finding that UTI decreased following implementation of the revised definitions. While both sets of criteria required significant laboratory findings, MDS 3.0 criteria include more specific signs or symptoms as well as evidence that the resident received UTI treatment (see Appendix). UTI is repeatedly identified as the most commonly reported infection in NH populations2,11,38; however, their diagnosis and treatment are often challenging.39 Based on our results, implementation of more stringent UTI criteria in MDS 3.0 resulted in lower measured prevalence, suggesting that MDS 3.0 might have greater utility in correctly identifying patients with symptomatic UTI. However, because of the high prevalence of asymptomatic bacteriuria in NHs, it is possible that the prevalence estimates for UTI are still overestimated.39 Also notable was the downward trend in indwelling catheter use in the MDS 3.0 data. Presence of an indwelling catheter is a major risk factor for UTI among NH residents40 and the decline in indwelling catheter use likely contributed to the decline in UTI identified here. However, the decrease in indwelling catheter use was much smaller than for UTI and, furthermore, most UTI in NHs occur among residents without indwelling catheters.17 Together, this suggests that additional factors contributed to the decrease in UTI prevalence.
The MDS infection definitions are not consistent with the CDC-recommended HAI surveillance definitions for LTC.41 Furthermore, a national survey of 990 NHs conducted in 2014 reported there was substantial variation in how facilities define and track infections.42 There is a need in these settings for harmonization of surveillance definitions and methods of data collection and, as more facilities join NHSN LTC, it will be necessary to monitor the reliability and validity of reported data. However, until better data are available, the MDS provides the best and most comprehensive data to track infection trends.
This study had several limitations. First, it is possible that infections that required hospitalization and then re-admission were not captured because MDS admission assessments were excluded from the analysis to increase the likelihood that the results represent infections acquired in NHs (because MDS assessments record active diagnoses). Therefore, infections that occurred prior to the first quarterly assessment were excluded. Infections that require hospitalization are not readily identifiable using MDS data. Furthermore, although we accounted for the most common infections, the MDS does not have items for all infection types included in previous prevalence estimates (e.g., acute gastroenteritis). Overall, this likely resulted in an underestimate of infection prevalence. Second, infection prevalence estimates were based on routine assessments and did not account for infections that occurred outside of the 7-day (30-day for UTI) look-back period. Therefore, these estimates cannot be interpreted as quarterly infection prevalence, which would be expected to be higher depending upon the duration of the infection. We addressed this in the count of infections in 2013 by assuming that infections lasted 1 week or 1 month. Finally, although MDS coordinators receive training and are provided with guidelines and resources to help them complete assessments in an accurate and consistent manner, differences in how MDS data are collected and reported across facilities are likely to exist and might further compromise the interpretation of the results.43 Despite these limitations, our findings demonstrate that MDS data are useful for identifying trends in infection prevalence over time.
Conclusion
We identified substantial changes in the reported prevalence of all NH infections evaluated, and, to some extent those changes were likely attributable to definitional changes in the revised MDS 3.0. Furthermore, we demonstrated the utility of MDS data for evaluating infection trends in NH residents; however, MDS revisions need to be considered when evaluating trends over this time period. Harmonization of definitions used for infection surveillance and data collection is needed. Additional research should evaluate best practices for infection prevention as well as identify factors that contribute to changes in infection trends such as state and federal HAI reporting policies.
Supplementary Material
Acknowledgments
We thank Jasmine Travers and Ragnhildur Bjarnadottir for their assistance in reviewing the MDS definition information.
Funding source: This work was supported by the National Institute of Nursing Research at the National Institutes of Health (grant number R01 NR013687). CCC received support from the National Institute of Nursing Research (grant numbers T32 NR013454, F31 NR015176, and T32 NR014205) and the Eastern Nursing Research Society and Council for the Advancement of Nursing Science. The content is solely the responsibility of the authors and does not necessarily represent the official views of the National Institutes of Health. The study sponsor had no role in the design or conduct of the study; in the collection, analysis, or interpretation of the data; in the writing of the manuscript; or in the decision to submit the manuscript for publication.
Footnotes
Publisher's Disclaimer: This is a PDF file of an unedited manuscript that has been accepted for publication. As a service to our customers we are providing this early version of the manuscript. The manuscript will undergo copyediting, typesetting, and review of the resulting proof before it is published in its final citable form. Please note that during the production process errors may be discovered which could affect the content, and all legal disclaimers that apply to the journal pertain.
Conflicts of interest: None.
References
- 1.Strausbaugh LJ, Joseph CL. The burden of infection in long-term care. Infect Control Hosp Epidemiol. 2000 Oct;21(10):674–679. doi: 10.1086/501712. [DOI] [PubMed] [Google Scholar]
- 2.Dwyer LL, Harris-Kojetin LD, Valverde RH, et al. Infections in long-term care populations in the United States. J Am Geriatr Soc. 2013 Mar;61(3):342–349. doi: 10.1111/jgs.12153. [DOI] [PubMed] [Google Scholar]
- 3.US Department of Health and Human Services. National Action Plan to Prevent Health Care–Associated Infections: Road Map to Elimination. 2013 http://www.health.gov/hai/pdfs/hai-action-plan-ltcf.pdf. Accessed December 2014.
- 4.Centers for Disease Control and Prevention. NHSN e-News, December 2016. 2016 https://www.cdc.gov/nhsn/pdfs/newsletters/nhsn-nl-dec-2016.pdf. Accessed January 20, 2016.
- 5.Center for Medicare and Medicaid Services. Medicare and Medicaid Programs; Reform of Requirements for Long-Term Care Facilities. https://www.federalregister.gov/documents/2016/10/04/2016-23503/medicare-and-medicaid-programs-reform-of-requirements-for-long-term-care-facilities. Accessed January 30, 2017. [PubMed]
- 6.Hawes C, Morris JN, Phillips CD, et al. Development of the nursing home Resident Assessment Instrument in the USA. Age Ageing. 1997 Sep;26(Suppl 2):19–25. doi: 10.1093/ageing/26.suppl_2.19. [DOI] [PubMed] [Google Scholar]
- 7.Morris JN, Hawes C, Fries BE, et al. Designing the national resident assessment instrument for nursing homes. Gerontologist. 1990 Jun;30(3):293–307. doi: 10.1093/geront/30.3.293. [DOI] [PubMed] [Google Scholar]
- 8.Gambassi G, Landi F, Peng L, et al. Validity of diagnostic and drug data in standardized nursing home resident assessments: potential for geriatric pharmacoepidemiology. SAGE Study Group. Systematic Assessment of Geriatric drug use via Epidemiology. Med Care. 1998 Feb;36(2):167–179. doi: 10.1097/00005650-199802000-00006. [DOI] [PubMed] [Google Scholar]
- 9.Mor V, Angelelli J, Jones R, et al. Inter-rater reliability of nursing home quality indicators in the U.S. BMC Health Serv Res. 2003 Nov 4;3(1):20. doi: 10.1186/1472-6963-3-20. [DOI] [PMC free article] [PubMed] [Google Scholar]
- 10.Mor V, Intrator O, Unruh MA, Cai S. Temporal and Geographic variation in the validity and internal consistency of the Nursing Home Resident Assessment Minimum Data Set 2.0. BMC Health Serv Res. 2011;11:78. doi: 10.1186/1472-6963-11-78. [DOI] [PMC free article] [PubMed] [Google Scholar]
- 11.Stevenson KB, Moore JW, Sleeper B. Validity of the minimum data set in identifying urinary tract infections in residents of long-term care facilities. J Am Geriatr Soc. 2004 May;52(5):707–711. doi: 10.1111/j.1532-5415.2004.52206.x. [DOI] [PubMed] [Google Scholar]
- 12.Toth AM, Bliss DZ, Savik K, Wyman JF. Validating MDS data about risk factors for perineal dermatitis by comparing with nursing home records. J Gerontol Nurs. 2008 May;34(5):12–18. doi: 10.3928/00989134-20080501-10. [DOI] [PMC free article] [PubMed] [Google Scholar]
- 13.Wu N, Mor V, Roy J. Resident, nursing home, and state factors affecting the reliability of Minimum Data Set quality measures. Am J Med Qual. 2009 May-Jun;24(3):229–240. doi: 10.1177/1062860609332510. [DOI] [PubMed] [Google Scholar]
- 14.Zhang NJ, Paek SC, Wan TT. Reliability estimates of clinical measures between Minimum Data Set and Online Survey Certification and Reporting data of US nursing homes. Med Care. 2009 Apr;47(4):492–495. doi: 10.1097/mlr.0b013e31818c014b. [DOI] [PubMed] [Google Scholar]
- 15.Wipke-Tevis DD, Rantz MJ, Mehr DR, et al. Prevalence, incidence, management, and predictors of venous ulcers in the long-term-care population using the MDS. Adv Skin Wound Care. 2000 Sep-Oct;13(5):218–224. [PubMed] [Google Scholar]
- 16.Langmore SE, Skarupski KA, Park PS, Fries BE. Predictors of aspiration pneumonia in nursing home residents. Dysphagia. 2002 Fall;17(4):298–307. doi: 10.1007/s00455-002-0072-5. [DOI] [PubMed] [Google Scholar]
- 17.Castle N, Engberg JB, Wagner LM, Handler S. Resident and Facility Factors Associated With the Incidence of Urinary Tract Infections Identified in the Nursing Home Minimum Data Set. J Appl Gerontol. 2015 May 5; doi: 10.1177/0733464815584666. [DOI] [PubMed] [Google Scholar]
- 18.D’Agata E, Loeb MB, Mitchell SL. Challenges in assessing nursing home residents with advanced dementia for suspected urinary tract infections. J Am Geriatr Soc. 2013 Jan;61(1):62–66. doi: 10.1111/jgs.12070. [DOI] [PMC free article] [PubMed] [Google Scholar]
- 19.Buchanan RJ, Wang S, Huang C. Profiles of nursing home residents with HIV. J Health Care Poor Underserved. 2002 Aug;13(3):379–391. doi: 10.1353/hpu.2010.0698. [DOI] [PubMed] [Google Scholar]
- 20.Crnich CJ, Safdar N, Robinson J, Zimmerman D. Longitudinal trends in antibiotic resistance in US nursing homes, 2000–2004. Infect Control Hosp Epidemiol. 2007 Aug;28(8):1006–1008. doi: 10.1086/518750. [DOI] [PubMed] [Google Scholar]
- 21.Friedman HS, Navaratnam P, Reardon G, et al. A retrospective analysis of clinical characteristics, hospitalization, and functional outcomes in residents with and without Clostridium difficile infection in US long-term care facilities. Curr Med Res Opin. 2014 Jun;30(6):1121–1130. doi: 10.1185/03007995.2014.895311. [DOI] [PubMed] [Google Scholar]
- 22.Zarowitz BJ, Allen C, O’Shea T, Strauss ME. Risk Factors, Clinical Characteristics, and Treatment Differences Between Residents With and Without Nursing Home- and Non-Nursing Home-Acquired Clostridium difficile Infection. J Manag Care Spec Pharm. 2015 Jul;21(7):585–595. doi: 10.18553/jmcp.2015.21.7.585. [DOI] [PMC free article] [PubMed] [Google Scholar]
- 23.Zilberberg MD, Shorr AF, Wang L, et al. Development and Validation of a Risk Score for Clostridium difficile Infection in Medicare Beneficiaries: A Population-Based Cohort Study. J Am Geriatr Soc. 2016 Jun 13; doi: 10.1111/jgs.14236. [DOI] [PubMed] [Google Scholar]
- 24.Kahvecioglu D, Ramiah K, McMaughan D, et al. Multidrug-Resistant Organism Infections in US Nursing Homes: A National Study of Prevalence, Onset, and Transmission across Care Settings, October 1, 2010–December 31, 2011. Infect Control Hosp Epidemiol. 2014 Oct;35(Suppl 3):S48–55. doi: 10.1086/677835. [DOI] [PubMed] [Google Scholar]
- 25.Levine JM, Roberson S, Ayello EA. Essentials of MDS 3.0 section M: skin conditions. Adv Skin Wound Care. 2010 Jun;23(6):273–284. doi: 10.1097/01.ASW.0000363555.60973.bc. [DOI] [PubMed] [Google Scholar]
- 26.Saliba D, Jones M, Streim J, et al. Overview of significant changes in the Minimum Data Set for nursing homes version 3.0. J Am Med Dir Assoc. 2012 Sep;13(7):595–601. doi: 10.1016/j.jamda.2012.06.001. [DOI] [PubMed] [Google Scholar]
- 27.Saliba D, Buchanan J. Development & Validation of a Revised Nursing Home Assessment Tool: MDS 3.0 Contract No. 500-00-0027/Task Order #2. Baltimore, MD: Centers for Medicare & Medicaid Services; 2008. [Google Scholar]
- 28.Saliba D, Buchanan J. Making the investment count: revision of the Minimum Data Set for nursing homes, MDS 3.0. J Am Med Dir Assoc. 2012 Sep;13(7):602–610. doi: 10.1016/j.jamda.2012.06.002. [DOI] [PubMed] [Google Scholar]
- 29.Saliba D, Buchanan J, Edelen MO, et al. MDS 3.0: brief interview for mental status. J Am Med Dir Assoc. 2012 Sep;13(7):611–617. doi: 10.1016/j.jamda.2012.06.004. [DOI] [PubMed] [Google Scholar]
- 30.Saliba D, DiFilippo S, Edelen MO, et al. Testing the PHQ-9 interview and observational versions (PHQ-9 OV) for MDS 3.0. J Am Med Dir Assoc. 2012 Sep;13(7):618–625. doi: 10.1016/j.jamda.2012.06.003. [DOI] [PubMed] [Google Scholar]
- 31.Centers for Medicare and Medicaid Services. MDS 3.0 RAI Manual. http://www.cms.gov/Medicare/Quality-Initiatives-Patient-Assessment-Instruments/NursingHomeQualityInits/MDS30RAIManual.html. Accessed September 2012.
- 32.Thompson ND, Perz JF, Moorman AC, Holmberg SD. Nonhospital health care-associated hepatitis B and C virus transmission: United States, 1998–2008. Ann Intern Med. 2009 Jan 6;150(1):33–39. doi: 10.7326/0003-4819-150-1-200901060-00007. [DOI] [PubMed] [Google Scholar]
- 33.Centers for Disease Control and Prevention. Healthcare-Associated Hepatitis B and C Outbreaks Reported to the Centers for Disease Control and Prevention (CDC) in 2008–2013. http://www.cdc.gov/hepatitis/Outbreaks/PDFs/HealthcareInvestigationTable.pdf. Accessed May 2014.
- 34.Smith BD, Morgan RL, Beckett GA, et al. Recommendations for the identification of chronic hepatitis C virus infection among persons born during 1945–1965. MMWR Recomm Rep. 2012 Aug 17;61(RR-4):1–32. [PubMed] [Google Scholar]
- 35.Augustine S, Bonomo RA. Taking stock of infections and antibiotic resistance in the elderly and long-term care facilities: A survey of existing and upcoming challenges. Eur J Microbiol Immunol (Bp) 2011 Sep;1(3):190–197. doi: 10.1556/EuJMI.1.2011.3.2. [DOI] [PMC free article] [PubMed] [Google Scholar]
- 36.Centers for Disease Control and Prevention. Surveillance for Viral Hepatitis – United States. 2013 https://www.cdc.gov/hepatitis/statistics/2013surveillance/commentary.htm. Accessed February 3, 2017.
- 37.Chien NT, Dundoo G, Horani MH, et al. Seroprevalence of viral hepatitis in an older nursing home population. J Am Geriatr Soc. 1999 Sep;47(9):1110–1113. doi: 10.1111/j.1532-5415.1999.tb05236.x. [DOI] [PubMed] [Google Scholar]
- 38.Rummukainen ML, Makela M, Noro A, et al. Assessing prevalence of antimicrobial use and infections using the minimal data set in Finnish long-term care facilities. Am J Infect Control. 2013 Apr;41(4):e35–37. doi: 10.1016/j.ajic.2012.09.007. [DOI] [PubMed] [Google Scholar]
- 39.Nace DA, Drinka PJ, Crnich CJ. Clinical uncertainties in the approach to long term care residents with possible urinary tract infection. J Am Med Dir Assoc. 2014 Feb;15(2):133–139. doi: 10.1016/j.jamda.2013.11.009. [DOI] [PubMed] [Google Scholar]
- 40.Rowe TA, Juthani-Mehta M. Urinary tract infection in older adults. Aging health. 2013 Oct;9(5) doi: 10.2217/ahe.13.38. [DOI] [PMC free article] [PubMed] [Google Scholar]
- 41.Stone ND, Ashraf MS, Calder J, et al. Surveillance definitions of infections in long-term care facilities: revisiting the McGeer criteria. Infect Control Hosp Epidemiol. 2012 Oct;33(10):965–977. doi: 10.1086/667743. [DOI] [PMC free article] [PubMed] [Google Scholar]
- 42.Herzig CT, Stone PW, Castle N, et al. Infection Prevention and Control Programs in US Nursing Homes: Results of a National Survey. J Am Med Dir Assoc. 2016 Jan;17(1):85–88. doi: 10.1016/j.jamda.2015.10.017. [DOI] [PMC free article] [PubMed] [Google Scholar]
- 43.Straker JK, Bailer AJ. A review and characterization of the MDS process in nursing homes. J Gerontol Nurs. 2008 Oct;34(10):36–44. doi: 10.3928/00989134-20081001-01. [DOI] [PubMed] [Google Scholar]
Associated Data
This section collects any data citations, data availability statements, or supplementary materials included in this article.