

Abstract
Objective:
As limitations in activities of daily living are major components of many stroke outcome scales, we examined how well activity limitations predicted subjective well-being among stroke survivors in a nationally representative survey.
Methods:
Individuals with a self-reported history of stroke were identified from the National Health and Aging Trends Study. Subjective well-being (primary outcome) was assessed with a validated 7-item measure (higher = greater well-being) assessing emotions (cheerful, bored, full of life, and upset) and self-realization (purpose in life, self-acceptance, and environmental mastery). Activity limitations were defined by the receipt of help in any of 11 activities of daily living/instrumental activities of daily living. Multivariable linear regression assessed predictors of well-being including medical, physical, cognitive, psychological, and environmental factors.
Results:
A total of 738 stroke survivors age 65 or older were included (57% female, 9% African American, 6% Hispanic). Activity limitations were modestly associated with well-being after adjusting for demographic characteristics and availability of assistance (estimate −0.49, 95% confidence interval −0.61 to −0.37). However, in the fully adjusted model (R2 = 0.28), neither activity limitations nor physical capacity was associated with subjective well-being. Predictors of lower well-being in the final model included depressive symptoms, chewing/swallowing problems, pain that limited activity, and restricted participation in valued life activities. Income and executive function were modestly associated with improved well-being, while comorbidities and communication technology access were not associated.
Conclusions:
Activity limitations were not associated with stroke survivors' subjective well-being after adjustment for other factors. While some predictors of well-being after stroke were identified, the determinants of well-being remained largely unexplained.
Stroke outcomes reported in clinical trials typically focus on functional impairments or activity limitations as measured by scales such as the NIH Stroke Scale, modified Rankin Scale, Barthel Index, or Glasgow Outcome Scale.1,2 This focus is entirely appropriate when testing therapies designed to reduce neurologic disability. However, this focus does not fully capture the breadth of stroke outcomes, as patients with similar activity limitations may have different outcomes in other domains. Obtaining a more complete picture of stroke outcomes can help to better inform patients and families about what to expect and assist in developing interventions to improve stroke survivorship.
Although depressive symptomology among stroke survivors has been well-described,3 subjective well-being, defined as “optimal psychological functioning and experience,”4 has received only limited attention in the stroke literature. The concept of subjective well-being includes both hedonic (pleasurable emotions) and eudaimonic (self-actualization) components. Recognizing the potential for mismatch between overall well-being and functional or activity limitations is important regardless of the direction of mismatch: whether a patient has relatively mild functional impairment but severe psychological sequelae, or a patient may be unable to ambulate but has otherwise adapted and reports high well-being.
We therefore investigated the relationship between activity limitations and well-being in a cohort of community-dwelling stroke survivors in a nationally representative sample. Project goals were to (1) determine the association between activity limitations and subjective well-being after stroke and (2) determine other predictors of subjective well-being and the degree to which these attenuate or strengthen the relationship between activity limitations and well-being.
METHODS
Study population and eligibility.
We performed a cross-sectional analysis using data from the National Health and Aging Trends Study (NHATS). NHATS is a longitudinal study of a nationally representative sample of community-dwelling Medicare beneficiaries age 65 and older in the United States with intentional oversampling of non-Hispanic black individuals and the oldest old.5 Participants for this study were identified from NHATS (wave 1, year 2011) as eligible for the current study if they responded “yes” to the question: “Please tell me if a doctor ever told you that you had a stroke.” Individuals who could not complete the interviews (for example, due to dementia or speech/hearing impairments) had a proxy complete the surveys, although these individuals were not eligible for the current study as they did not undergo the well-being assessment.
Primary outcome measure: Subjective well-being.
The primary outcome measure was a previously validated scale of subjective well-being.6 This 7-item measure is based on established hedonic and eudaimonic domains of well-being,7 and includes measure of both emotions (2 positive and 2 negative items) and self-realization (3 items). The 4 emotional domain questions were “During the last month, how often did you feel (cheerful/full of life/upset/bored),” with 5 response options ranging from never (0 points) to every day (4 points). Similarly, 3 items addressing self-realization were asked (“My life has meaning and purpose”; “I feel confident and good about myself”; and “I like my living situation very much”), with response options scored on a scale ranging from agree not at all (0) to agree a lot (2). Negative items were reverse coded such that higher numeric scores indicated greater well-being, with the total possible well-being score ranging from 0 to 22. While there has been debate about the number of dimensions of well-being,4,7 factor analysis of this scale has confirmed a unidimensional construct.6,8
Primary independent variable: Activity limitations.
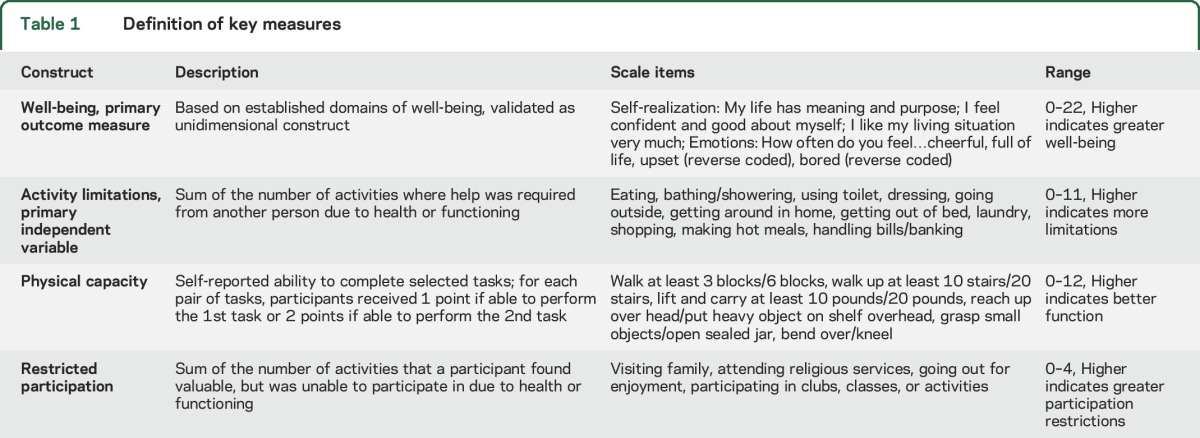
Our primary analysis relied on a summary activity limitations index generated by summing the number of self-care, mobility, and household activities (table 1) where help from another person was required due to health or functioning (range 0–11). The included activities were based on a previously validated multiple-category assessment of activity limitations.6,9 Scenarios where an individual received help with a household activity, but did not require help due to health or functioning (for example, if a respondent's spouse always did the laundry), would not have been considered an activity limitation. Since the relationship between the activity index and well-being could be confounded by availability of assistance from friends and family, we also assessed the availability of help with 3 indicators: (1) marital status (married or living with a partner vs not), (2) number of adult children living in the household, and (3) social network size. Social network size was assessed by counting the number of individuals (other than the spouse/partner and coresiding adult children) who were adult children, who lived with the respondent, or who were a confidant of the respondent (that is, the respondent named them as one of the people they talked with most often about important things over the last year).
Table 1.
Definition of key measures
Other symptoms or indicators of functional status.
Using self-reported measures of physical capacity, a validated summary physical capacity index (range 0–12) was generated, with included domains shown in table 1.6,9 Cognition was assessed with a word recall task (scored 0–20, analyzed as continuous variable) and executive function as measured by a clock-drawing task (scored 0–5, analyzed as a continuous variable), with higher scores indicating better cognition for each measure. Swallowing difficulties were assessed with a question to determine if a participant had chewing or swallowing difficulties in the last month that led to difficulty eating. Hearing or vision difficulties were assessed with questions about difficulty carrying on a conversation in a quiet room or seeing well enough to read newspaper print. Speech difficulties were assessed with a question about whether the participant had difficulty making himself or herself understood when talking. Pain was classified into 3 levels: (1) never bothered by pain in the last month; (2) bothered by pain that did not limit activities; and (3) bothered by pain that limited activities.
Other potential predictors of well-being.
A restricted participation index was created by summing the number of activities that an individual valued as somewhat or very important, but were unable to participate in due to health or functioning, from the following list of 4 items: visiting in person with friends or family; attending religious services; participating in clubs, classes, or other organized activities; and going out for enjoyment.10 A comorbidity index was generated as the sum of NHATS reported comorbidities (range 0–8). Depressive symptoms were assessed with the Patient Health Questionnaire-2, with individuals scoring ≥3 out of a possible 6 points classified as having depressive symptoms.11 Income was self-reported and categorized into income quintiles. For individuals with missing data, the mean of 5 NHATS imputed values was used to assign income quintile. Access to communication technology was assessed by summing the response of questions about whether respondents (1) had a working cell phone; (2) had one phone other than cell phone; (3) communicated by e-mail or text in the last month; or (4) went online for any other reason besides e-mail or texting in the last month.
Statistical analysis.
Characteristics of the study population were described with mean and SD for continuous variables and proportions for categorical variables. A series of linear regression models were generated to allow an understanding of how the relationship between activity limitations (linear) and well-being changed as additional factors were added. Model 1, the demographics/availability model, included activity limitations and demographics including age (categorical), sex (male as reference), and race-ethnicity (white as reference). Availability of help was also included to account for possible confounding using 3 separate variables: married or living with a partner (yes vs no), number of adult children living in the household (linear), and social network size (linear). Model 2, the symptoms/capacity model, incorporated a broader definition of symptoms or functional limitations, and therefore physical capacity index, cognition, pain, and measures assessing difficulty with swallowing/chewing, speech, hearing, or vision were added to the variables present in model 1. Model 3, the fully adjusted model, included other prespecified potential predictors of well-being, including income, number of comorbid illnesses, restricted participation in valued activities, technology access, and depressive symptoms. Models were adjusted for NHATS survey design using analytic weights and strata to produce nationally representative estimates. Nonlinear forms were explored for activity limitations, physical capacity index, and restricted participation with quadratic terms or quantiles. In addition, to explore whether a more nuanced definition of activity limitations may change our understanding of the relationship between activities and well-being, we explored modeling activity limitations as 11 separate multiple-category variables.6,9 There was no major improvement in model fit and no change in the primary conclusions with these alternative modeling strategies compared to treating the primary variables of interest as linear. Post hoc sensitivity analyses were conducted to address possible overlap between depressive symptoms and subjective well-being, including (1) model 3 excluding depressive symptoms as a predictor; and (2) model 3 restricted to individuals without depressive symptoms. Statistical analysis was performed using Stata Statistical Software, Release 14 (StataCorp., College Station, TX).
Standard protocol approvals, registrations, and participant consents.
The study protocol was reviewed by the University of Michigan Medical Institutional Review Board and was deemed to be not regulated as it relied on a publicly available, deidentified dataset.
RESULTS
A total of 892 NHATS participants self-reported a history of stroke; 154 of those were ineligible due to interview completion by proxy, leaving 738 participants in the current analysis. Descriptive characteristics of the population are shown in table 2. The mean well-being score was 16.0 (SD 3.9), and the mean number of activity limitations was 2.0 (SD 2.9).
Table 2.
Descriptive characteristics of the population
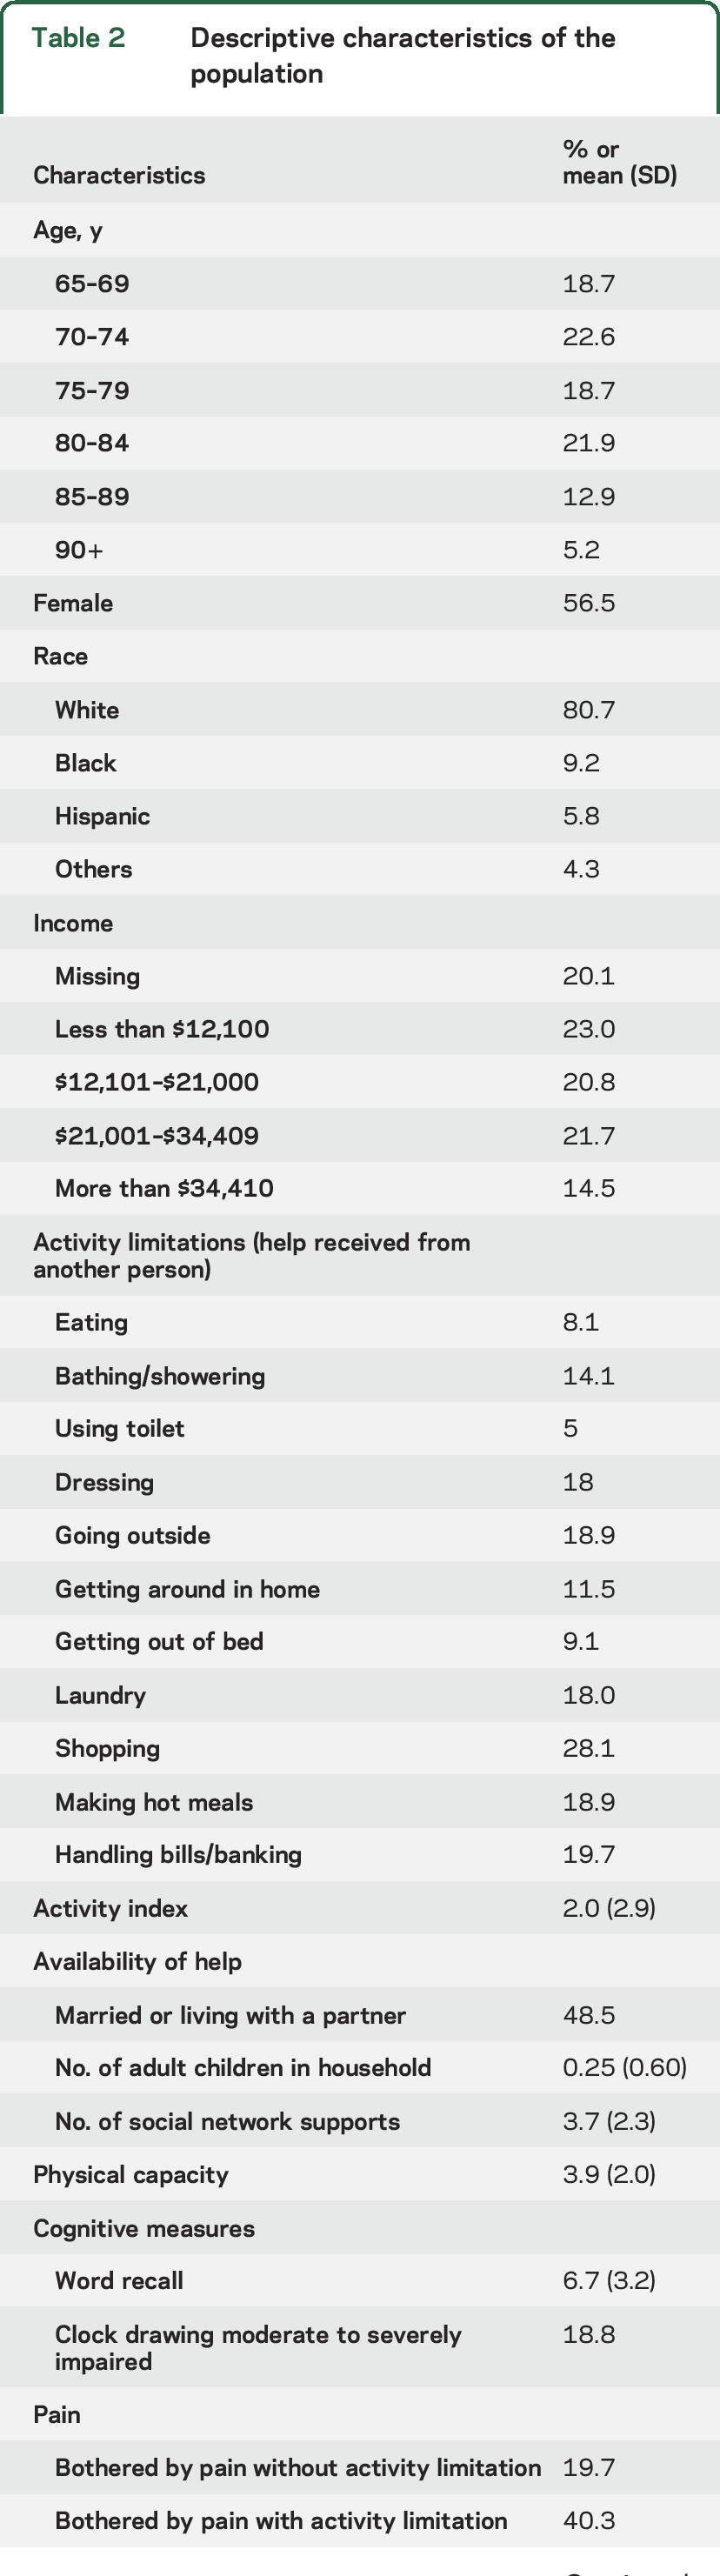
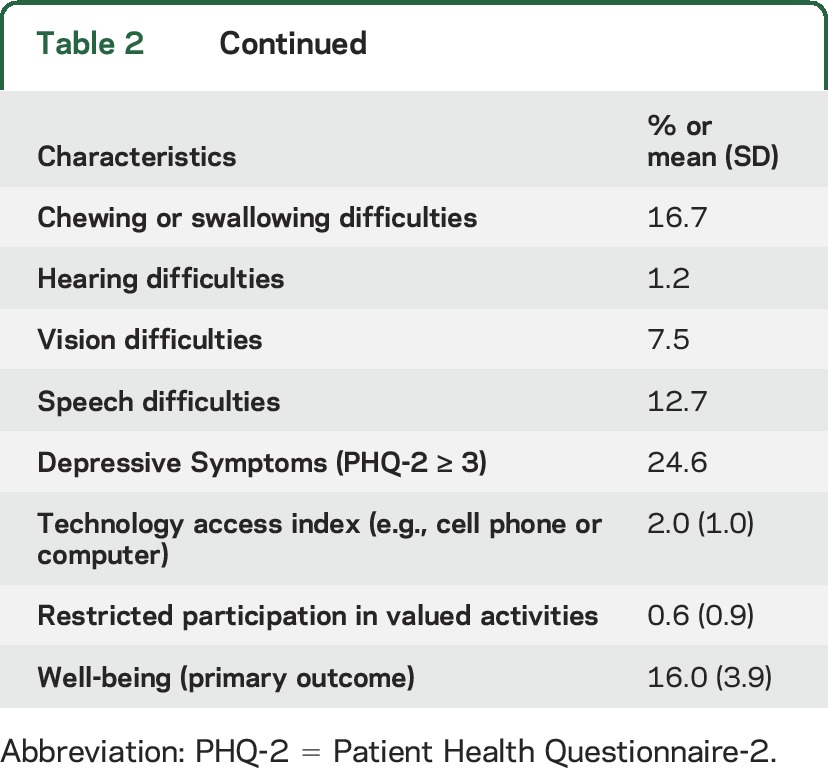
Table 3 shows the results from the linear regression models examining predictors of well-being. Increasing activity limitations were associated with a modest decrease in well-being when adjusted for demographics and availability of assistance in model 1, with about a one-half point decrease in the well-being score for each additional activity limitation (β= −0.49, 95% confidence interval −0.61, −0.37, p < 0.001). However, model 1 (demographics/availability) explained very little of the overall variability in well-being based on an R2 value of 0.14.
Table 3.
Predictors of well-being after stroke
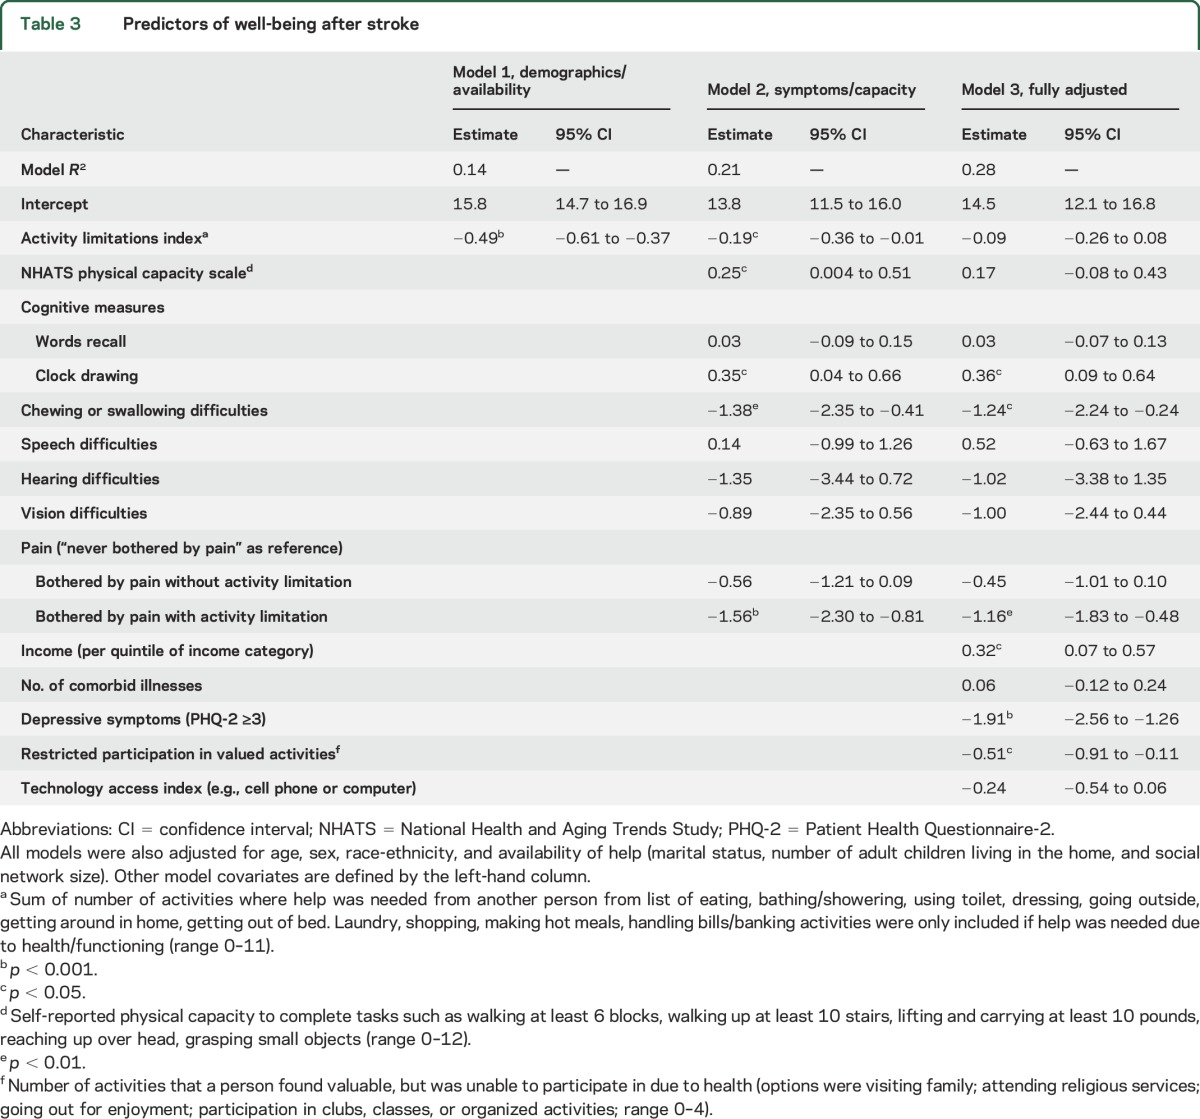
When additional measures of symptoms and physical and cognitive capacity were added in model 2 (symptoms/capacity model), the association of activity limitations with well-being was attenuated (table 3). Other predictors of better well-being in model 2 included greater physical capacity and better clock drawing scores, while chewing/swallowing problems and pain that limited activity were associated with decreased well-being.
In the final fully adjusted model (model 3, table 3), activity limitations were not associated with well-being. The model R2 remained modest at 0.28, indicating that less than a third of the variability in well-being was explained by the included covariates. Chewing/swallowing difficulties and pain that limited activity remained associated with a large decrease in well-being, with each of these factors having a more than 1-point decrease in well-being when present. Better clock drawing score was associated with higher well-being—more than 2 points on the well-being score separated those whose drawing was unrecognizable as a clock from those who produced an accurate clock depiction. Similarly, higher incomes were also associated with greater well-being. An individual in the top income quintile had a well-being score almost 2 points higher than those in the lowest income quintile, on average. Restricted participation in valued activities was also associated with decreased well-being but physical capacity score was not. Depressive symptoms were associated with an almost 2-point decline in well-being. Sensitivity analyses addressing possible overlap between depressive symptoms and well-being indicated no change in the conclusions about the relationship between well-being and activity limitations, physical capacity, or restricted participation (table e-1 at Neurology.org).
DISCUSSION
In this large nationwide sample of older stroke survivors, we found that activity limitations were not predictive of subjective well-being after adjustment for other factors such as pain, depressive symptoms, and restricted participation in valued activities. This finding is important, given that the most commonly used stroke outcome measures largely focus on activity limitations, and it suggests that these outcome measures may be insensitive to important drivers of self-reported well-being.
Recent efforts have sought to address this conceptual problem by developing scales that assess more global stroke outcomes. However, many of these measures, including Stroke-Specific Quality of Life Scale12 and the Stroke Impact Scale,13,14 are still fairly heavily weighted toward domains assessing physical impairments or functional abilities.1 Considerable effort has also gone into development and validation of patient-reported outcomes including the NIH Patient-Reported Outcome Measurement Information System (PROMIS)15 and Neuro-QoL measures.16,17 Hopefully, increased use of these and other patient-reported outcomes will allow a more comprehensive assessment of stroke outcomes beyond just functional status in future clinical trials and epidemiologic studies. However, a critical challenge in efforts to optimize outcome assessment after stroke is the fact that much of the variability in well-being remained unexplained despite the extensive list of predictors we examined. More work will be needed in the future to better understand predictors of subjective well-being in stroke survivors.
One potential explanation for the lack of association between activity limitations and subjective well-being is the possibility that stroke survivors have adapted to their activity limitations. The process of resetting one's expectations after disability, which is termed a response shift,18,19 is important to consider when examining patient-reported outcomes. Awareness of this possibility of response shift could also be an important target in rehabilitative efforts in order to maximize self-perceived well-being or quality of life.18 If response shift is common in stroke survivors, it may be important to account for this phenomenon when counseling patients and families early after stroke. We were not able to assess whether response shift occurred directly in this study, as our data collection occurred at a single time point and we did not have data available on time from stroke to well-being assessment. Future longitudinal studies exploring well-being before and after stroke will be better positioned to assess response shift in stroke survivors.
We identified several predictors of well-being that could serve as future intervention targets. Pain that limited activity and depressive symptoms were both strongly associated with reduced well-being, while better performance on the clock drawing task was associated with improved well-being. Although the evidence for specific therapies for executive dysfunction after stroke is currently limited,20 the association of the clock drawing task with well-being would support ongoing efforts to further develop rehabilitation strategies that target cognitive function.21 The magnitude of effect we observed for pain and depressive symptoms was on the order of one-fourth to one-half of an SD in the well-being measure, commonly considered to be a small to medium effect size.22 The importance of pain and depression after stroke has been increasingly recognized,3,23,24 and additional efforts are needed to optimize treatment. While some overlap between symptoms of depression and the psychological construct of subjective well-being is possible, sensitivity analyses (table e-1) confirmed that our conclusions about the relationship between activity limitations and subjective well-being were robust regardless of how depressive symptoms were analyzed.
Restricted participation in valued activities was also an important predictor of reduced well-being. The importance of assessing community and social participation in addition to function or activity limitations is emphasized in the 2002 WHO International Classification of Functioning Disability and Health.25 There is a growing literature on the importance of participation after stroke,26–29 and continued focus on maximizing participation in valued activities as a goal of rehabilitation is warranted. Studies in nonstroke populations have used various methods of rating the relative importance of different valued life activities.30,31 A list of most-valued activities could serve as a roadmap for where to focus rehabilitative efforts or adaptive technology for stroke survivors. Reviewing such a list with patients and families also has potential use in advance care planning,32 or when making values-sensitive treatment decisions such as use of life-sustaining treatments after stroke. More work would be needed on how best to integrate such a list of valued activities into routine clinical care of stroke patients, but there is the potential for such an approach to improve the patient-centeredness of care.
A prior analysis of from the Canadian Study on Health and Aging also assessed well-being among community-dwelling stroke survivors, though they separately analyzed 6 distinct dimensions of well-being rather than treating well-being as a single construct.33 Similar to our findings, they found that restrictions in basic self-care activities of daily living (e.g., dressing, grooming) were largely not associated with well-being, and the amount of variability explained by their models was relatively low for the majority of domains of well-being.
This work has limitations. As stroke diagnosis was by self-report, we were unable to verify the stroke diagnosis and had no detailed data on stroke characteristics such as subtype, severity, or time between stroke and the well-being assessment. Because this was a community-dwelling stroke population and individuals requiring a proxy were excluded, this study population may represent a milder subset of the overall population of stroke survivors. We are also uncertain if the reported functional limitations are due to direct effects of the stroke or other health conditions. The use of the activity index is limited by greater relative emphasis on activities of daily living rather than instrumental activities of daily living, though this is a common limitation of many stroke outcome scales. The activity index may be confounded by the availability of help, as the items are defined by receiving help from another person. We accounted for this by adjusting for the availability of help in all models, though this assessment was limited to counts of the number of people available, which may not reflect the quality of social support. While income was modestly associated with well-being, this finding should be interpreted with caution due to the amount of missing income data (20%) and the fact that income may not be the best marker of available financial resources in this population of older adults.
We found that limitations in daily activities had only modest association with subjective well-being among stroke survivors and this association was no longer significant after consideration of other factors. Addressing pain, depressive symptoms, and inability to participate in valued activities may be targets to improve well-being among survivors. Importantly, much of what determined well-being remained unexplained despite inclusion of multiple factors, and more research is needed on determinants of well-being after stroke and how to best address discrepancies among physical impairments, activity limitations, and well-being.
Supplementary Material
GLOSSARY
- NHATS
National Health and Aging Trends Study
Footnotes
Supplemental data at Neurology.org
AUTHOR CONTRIBUTIONS
Dr. Zahuranec: study concept and design, wrote initial draft of manuscript, interpretation of data. Dr. Skolarus: study concept and design, interpretation of data, drafting/revising the manuscript for content, obtaining funding. Dr. Feng: statistical analysis, drafting/revising manuscript for content. Dr. Freedman: study concept/design, analysis/interpretation of data, revision of manuscript for important content, obtained funding, study supervision. Dr. Burke: study concept and design, analysis/interpretation of data, drafting/revising the manuscript for content, obtaining funding.
STUDY FUNDING
Study funded by NIH grants R01MD008879 and U01AG032947. NIH staff participated in discussions about the design and conduct of NHATS. The NIH had no role in the design or conduct of this analysis; interpretation of the data; or preparation, review, or approval of the manuscript.
DISCLOSURE
D. Zahuranec is funded by NIH grants R01AG051827 and R01NS091112 and has received research support from NIH grant K23AG038731 and Medtronic. L. Skolarus is supported by NIH grants K23NS073685 and R01MD008879. She has also received hotel accommodations from the American Academy of Neurology and the American Neurologic Association for their national meeting. She received research support from the Blue Cross Blue Shield of Michigan Foundation and receives research support from the University of Michigan for stroke-related research. C. Feng reports no disclosures relevant to the manuscript. V. Freedman is funded by NIH grants R01MD008879 and U01AG032947. J. Burke is funded by NIH grants K08NS082597 and R01MD008879. Go to Neurology.org for full disclosures.
REFERENCES
- 1.Ali M, Fulton R, Quinn T, Brady M. How well do standard stroke outcome measures reflect quality of life? A retrospective analysis of clinical trial data. Stroke 2013;44:3161–3165. [DOI] [PubMed] [Google Scholar]
- 2.Schellinger PD, Bath PM, Lees KR, et al. Assessment of additional endpoints for trials in acute stroke: what, when, where, in who? Int J Stroke 2012;7:227–230. [DOI] [PubMed] [Google Scholar]
- 3.Towfighi A, Ovbiagele B, El Husseini N, et al. Poststroke depression: a scientific statement for healthcare professionals from the American Heart Association/American Stroke Association. Stroke 2017;48:e30–e43. [DOI] [PubMed] [Google Scholar]
- 4.Springer KW, Hauser RM. An assessment of the construct validity of Ryff's scales of psychological well-being: method, mode, and measurement effects. Social Sci Res 2006;35:1080–1102. [Google Scholar]
- 5.Kasper JD, Freedman VA. National Health and Aging Trends Study User Guide: Rounds 1, 2, 3, 4 & 5 Beta Release [online]. Available at: nhats.org/scripts/documents/NHATS_User_Guide_R1R2R3R4R5_Beta_Release_2016_07_11_16.pdf. Accessed August 11, 2016. [Google Scholar]
- 6.Freedman VA, Kasper JD, Spillman BC, et al. Behavioral adaptation and late-life disability: a new spectrum for assessing public health impacts. Am J Public Health 2014;104:e88–e94. [DOI] [PMC free article] [PubMed] [Google Scholar]
- 7.Ryff CD. Happiness is everything, or is it? Explorations on the meaning of psychological well-being. J Personal Social Psychol 1989;57:1069–1081. [Google Scholar]
- 8.Kim K, Lehning AJ, Sacco P. Assessing the factor structure of well-being in older adults: findings from the national health and aging trends study. Aging Ment Health 2015;20:1–9. [DOI] [PubMed] [Google Scholar]
- 9.Freedman VA, Kasper JD, Cornman JC, et al. Validation of new measures of disability and functioning in the National Health and Aging Trends Study. J Gerontol A Biol Sci Med Sci 2011;66:1013–1021. [DOI] [PMC free article] [PubMed] [Google Scholar]
- 10.Skolarus LE, Burke JF, Brown DL, Freedman VA. Understanding stroke survivorship: expanding the concept of poststroke disability. Stroke 2014;45:224–230. [DOI] [PMC free article] [PubMed] [Google Scholar]
- 11.Kroenke K, Spitzer RL, Williams JB. The Patient Health Questionnaire-2: validity of a two-item depression screener. Med Care 2003;41:1284–1292. [DOI] [PubMed] [Google Scholar]
- 12.Williams LS, Weinberger M, Harris LE, Clark DO, Biller J. Development of a stroke-specific quality of life scale. Stroke 1999;30:1362–1369. [DOI] [PubMed] [Google Scholar]
- 13.Lin KC, Fu T, Wu CY, Hsieh YW, Chen CL, Lee PC. Psychometric comparisons of the Stroke Impact Scale 3.0 and Stroke-Specific Quality of Life Scale. Qual Life Res 2010;19:435–443. [DOI] [PubMed] [Google Scholar]
- 14.Duncan PW, Bode RK, Min Lai S, Perera S. Rasch analysis of a new stroke-specific outcome scale: the Stroke Impact Scale. Arch Phys Med Rehabil 2003;84:950–963. [DOI] [PubMed] [Google Scholar]
- 15.National Institutes of Health. Intro to PROMIS: HealthMeasures Website [online]. Available at: healthmeasures.net/explore-measurement-systems/promis/intro-to-promis. Accessed August 11, 2016. [Google Scholar]
- 16.Sangha RS, Caprio FZ, Askew R, et al. Quality of life in patients with TIA and minor ischemic stroke. Neurology 2015;85:1957–1963. [DOI] [PMC free article] [PubMed] [Google Scholar]
- 17.Gershon RC, Lai JS, Bode R, et al. Neuro-QOL: quality of life item banks for adults with neurological disorders: item development and calibrations based upon clinical and general population testing. Qual Life Res 2012;21:475–486. [DOI] [PMC free article] [PubMed] [Google Scholar]
- 18.Howard JS, Mattacola CG, Howell DM, Lattermann C. Response shift theory: an application for health-related quality of life in rehabilitation research and practice. J Allied Health 2011;40:31–38. [PubMed] [Google Scholar]
- 19.Ahmed S, Mayo NE, Wood-Dauphinee S, Hanley JA, Cohen SR. Response shift influenced estimates of change in health-related quality of life poststroke. J Clin Epidemiol 2004;57:561–570. [DOI] [PubMed] [Google Scholar]
- 20.Chung CS, Pollock A, Campbell T, Durward BR, Hagen S. Cognitive rehabilitation for executive dysfunction in adults with stroke or other adult non-progressive acquired brain damage. Cochrane Database Syst Rev 2013;20:CD008391. [DOI] [PMC free article] [PubMed] [Google Scholar]
- 21.Poulin V, Korner-Bitensky N, Bherer L, Lussier M, Dawson DR. Comparison of two cognitive interventions for adults experiencing executive dysfunction post-stroke: a pilot study. Disabil Rehabil 2017;39:1–13. [DOI] [PubMed] [Google Scholar]
- 22.Sullivan GM, Feinn R. Using effect size: or why the p value is not enough. J Grad Med Educ 2012;4:279–282. [DOI] [PMC free article] [PubMed] [Google Scholar]
- 23.Holloway RG, Arnold RM, Creutzfeldt CJ, et al. Palliative and end-of-life care in stroke: a statement for healthcare professionals from the American Heart Association/American Stroke Association. Stroke 2014;45:1887–1916. [DOI] [PubMed] [Google Scholar]
- 24.Harrison RA, Field TS. Post stroke pain: identification, assessment, and therapy. Cerebrovasc Dis 2015;39:190–201. [DOI] [PubMed] [Google Scholar]
- 25.World Health Organization. International Classification of Functioning, Disability and Health (ICF) [online]. Available at: who.int/classifications/icf/en/. Accessed February 14, 2017. [Google Scholar]
- 26.Wolf TJ, Chuh A, Floyd T, McInnis K, Williams E. Effectiveness of occupation-based interventions to improve areas of occupation and social participation after stroke: an evidence-based review. Am J Occup Ther 2015;69:6901180060p1–6901180060p11. [DOI] [PMC free article] [PubMed] [Google Scholar]
- 27.Jellema S, van der Sande R, van Hees S, Zajec J, Steultjens EM. Nijhuis-van der Sanden MW. Role of environmental factors on resuming valued activities poststroke: a systematic review of qualitative and quantitative findings. Arch Phys Med Rehabil 2016;97:991–1002. [DOI] [PubMed] [Google Scholar]
- 28.de Graaf JA, van Mierlo ML, Post MW, Achterberg WP, Kappelle LJ, Visser-Meily JM. Long-term restrictions in participation in stroke survivors under and over 70 years of age. Disabil Rehabil 2017:1–9. Epub ahead of print. [DOI] [PubMed] [Google Scholar]
- 29.Bergstrom A, Guidetti S, Tham K, Eriksson G. Association between satisfaction and participation in everyday occupations after stroke. Scand J Occup Ther 2016:1–10. Epub ahead of print. [DOI] [PubMed] [Google Scholar]
- 30.Ditto PH, Druley JA, Moore KA, Danks JH, Smucker WD. Fates worse than death: the role of valued life activities in health-state evaluations. Health Psychol 1996;15:332–343. [DOI] [PubMed] [Google Scholar]
- 31.Karel MJ, Mulligan EA, Walder A, Martin LA, Moye J, Naik AD. Valued life abilities among veteran cancer survivors. Health Expect 2016;19:679–690. [DOI] [PMC free article] [PubMed] [Google Scholar]
- 32.Ditto PH, Jacobson JA, Smucker WD, Danks JH, Fagerlin A. Context changes choices: a prospective study of the effects of hospitalization on life-sustaining treatment preferences. Med Decis Making 2006;26:313–322. [DOI] [PubMed] [Google Scholar]
- 33.Clarke P, Marshall V, Black SE, Colantonio A. Well-being after stroke in Canadian seniors: findings from the Canadian Study of Health and Aging. Stroke 2002;33:1016–1021. [DOI] [PubMed] [Google Scholar]
Associated Data
This section collects any data citations, data availability statements, or supplementary materials included in this article.