Abstract
Purpose
Magnetic resonance imaging (MRI) and positron emission tomography–computed tomography (PET-CT) are important imaging techniques in multiple myeloma (MM). We conducted a prospective trial in patients with MM aimed at comparing MRI and PET-CT with respect to the detection of bone lesions at diagnosis and the prognostic value of the techniques.
Patients and Methods
One hundred thirty-four patients received a combination of lenalidomide, bortezomib, and dexamethasone (RVD) with or without autologous stem-cell transplantation, followed by lenalidomide maintenance. PET-CT and MRI were performed at diagnosis, after three cycles of RVD, and before maintenance therapy. The primary end point was the detection of bone lesions at diagnosis by MRI versus PET-CT. Secondary end points included the prognostic impact of MRI and PET-CT regarding progression-free (PFS) and overall survival (OS).
Results
At diagnosis, MRI results were positive in 127 of 134 patients (95%), and PET-CT results were positive in 122 of 134 patients (91%; P = .33). Normalization of MRI after three cycles of RVD and before maintenance was not predictive of PFS or OS. PET-CT became normal after three cycles of RVD in 32% of the patients with a positive evaluation at baseline, and PFS was improved in this group (30-month PFS, 78.7% v 56.8%, respectively). PET-CT normalization before maintenance was described in 62% of the patients who were positive at baseline. This was associated with better PFS and OS. Extramedullary disease at diagnosis was an independent prognostic factor for PFS and OS, whereas PET-CT normalization before maintenance was an independent prognostic factor for PFS.
Conclusion
There is no difference in the detection of bone lesions at diagnosis when comparing PET-CT and MRI. PET-CT is a powerful tool to evaluate the prognosis of de novo myeloma.
INTRODUCTION
Whole body low-dose computed tomography (CT) is considered the novel standard procedure for the diagnosis of lytic disease in patients with multiple myeloma (MM), but magnetic resonance imaging (MRI) and positron emission tomography (PET)-CT using [18F]fluorodeoxyglucose (FDG) are also reliable imaging techniques to detect bone lesions and bone involvement at diagnosis.1 These two methods were recently incorporated into the new criteria required for the definition of MM.2 In addition, both MRI and PET-CT have been shown to be of prognostic value for progression-free survival (PFS) and/or overall survival (OS) at diagnosis, but also during follow-up.1 In a large series of patients treated with frontline autologous stem-cell transplantation (ASCT), Bartel et al3 showed that the number of focal lesions (FLs) evaluated by MRI at baseline was a strong predictor of event-free survival and that the number of FLs detected at baseline by FDG PET-CT retained a prognostic value for OS. In addition, the suppression of PET FLs at the time of the first transplantation was also a strong predictor of OS.3 These data were confirmed by Zamagni et al4 in patients treated with tandem ASCT after thalidomide and dexamethasone induction. Nevertheless, few trials have prospectively compared MRI and PET-CT in the setting of frontline intensive therapy programs, including proteasome inhibitors and immunomodulatory drugs. The IFM/DFCI 2009 study prospectively evaluated the combination of eight cycles of lenalidomide, bortezomib, and dexamethasone (RVD) versus RVD plus ASCT, followed by lenalidomide maintenance.5 Within this clinical trial, a subgroup of patients was enrolled into the prospective ancillary IMAJEM study aimed at comparing MRI and FDG PET-CT at diagnosis after three cycles of RVD and before maintenance.
PATIENTS AND METHODS
Patients
All patients enrolled into the IMAJEM trial were included in the IFM/DFCI study. Inclusion and exclusion criteria for the IFM/DFCI 2009 study have been reported.5 Selected centers from the Intergroupe Francophone du Myelome enrolled consecutive patients into the IMAJEM study. These patients had to provide informed consent allowing the assessments of both whole-body PET-CT and MRI of the spine and pelvis at the time of diagnosis, after three cycles of RVD, and before maintenance therapy. The protocol was approved by the institutional ethics committee of the coordinating center (University Hospital, Nantes, France). The trial was registered at ClinicalTrials.gov (NCT01309334).
End Points
The primary end point of the study was to compare MRI of the spine and pelvis versus whole-body PET-CT regarding the detection of bone lesions at diagnosis. Secondary end points were the prognostic impact of MRI and PET-CT at diagnosis, after three cycles of induction therapy with RVD, and before maintenance therapy, that is, the influence of MRI negativity and PET-CT negativity on PFS and OS.
PET-CT Assessment
PET-CT images were acquired in each center according to local protocol. All patients fasted for at least 4 hours before FDG injection. Blood glucose levels measured before administering FDG preferably had to be ≤ 150 mg/dL, but ≤ 200 mg/dL was allowed. No insulin was administered within 2 hours preceding the injection. No oral contrast was given. Patients could receive a mild oral sedative before the FDG injection. Water was given orally during the FDG uptake phase. Whole-body imaging (top of the head to the feet, arms alongside the body) was performed 60 to 80 minutes after the intravenous injection of 3 to 7 MBq/kg FDG. For each examination, the low-dose CT was immediately followed by PET acquisition.
After anonymization, PET-CT images were reviewed on a dedicated workstation (Imagys, Keosys, France) by two experienced readers (C.B.M. and F.K.B.) blinded to the results of clinical and biologic data, MRI analyses, and treatment arm. At baseline, criteria to define PET-CT positivity included at least one of the following:
One or more FL defined as the presence of areas of focally increased tracer uptake within bones (more intense compared with normal bone marrow [BM] background uptake), with or without any underlying lytic lesion, and present on at least two consecutive slices, excluding uptake corresponding to osteoarticular benign pathologies. The SUVmax of the hottest FL was recorded.
A diffuse BM involvement defined as a homogeneous uptake in the axial and appendicular skeleton higher than liver uptake or as a heterogeneous uptake regardless of the intensity of uptake.
Extramedullary disease (EMD) defined as FDG-avid tissue that, according to CT examination, was not contiguous to bone and arose in soft tissue.
After three courses of RVD and before maintenance, a normalization of PET-CT was defined as: residual uptake greater than or equal to liver activity in FLs, BM, and EMD. All other PET-CT results were considered positive, excluding increasing FDG uptake related to bone reconstruction or related to the use of hematopoietic growth factors.
MRI Assessment
MRI images of the spine and pelvis were acquired using a whole-body MRI scanner. Standard protocol included T1-weighted turbo spin echo (TSE), T2-weighted short T1 inversion recovery (STIR) with fat suppression, and contrast-enhanced T1-weighted TSE with fat suppression magnetic resonance (MR) sequences. The whole spine was explored in sagittal views with or without axial views, and the pelvis was explored in coronal and axial views. Typical MM bone lesions at diagnosis appeared as hypointense T1-weighted TSE, hyperintense T2-weighted STIR, or hyperintense contrast T1-weighted TSE FLs. Other aspects included similar MR patterns with diffuse BM infiltration or a salt-and-pepper aspect with a heterogeneous BM signal resulting from multiple micronodules. Number and size of such FLs (considered if ≥ 5 mm diameter) were registered.
Response to treatment on MRI implies the normalization of diffuse involvement or a decrease in the size and/or number of FLs. Complete remission was considered in case of the disappearance of all FLs and a homogeneous BM hypointense signal on the T2-weighted STIR sequence. The absence of modifications in size or signal defined nonresponders, and increases in size or new lesions defined progressive disease. MR images were centrally reviewed by two experienced radiologists (F.C. and E.F.).
Definition of Response and Relapse
Response to treatment and disease progression were assessed according to the International Uniform Response Criteria.6 BM samples were collected before maintenance for minimal residual disease (MRD) measurement by seven-color flow cytometry (sensitivity level, 10−4).7
Statistical Analysis
The sample size was determined assuming that MRI of the spine and pelvis was able to detect myeloma lesions in 70% of patients and whole-body PET-CT was able to detect myeloma lesions in 85% of patients. We assumed an overall discordance rate of 45%, 30% in favor of PET-CT and 15% in favor of MRI. With the inclusion of 155 patients, the study had at least 80% statistical power to demonstrate this difference of discordance rate between MRI and PET-CT, with a significance level of .05. Agreements and disagreements in detecting bone lesions between MRI and PET-CT at diagnosis were summarized in a two-way table, and the proportions of patients with detected bone lesions were compared using the McNemar test.
The analysis of the normalization of each imaging technique after three cycles of RVD or before maintenance treatment was performed in patients with an abnormal image at diagnosis. The impact of normalization on PFS or OS was studied at both time points using landmark analysis–rational with patients with an event or last follow-up before the time point being excluded. An event was defined as progression in case of PFS or death for OS, whichever occurred first. Time-to-event was calculated from the date of each time point (after three cycles of RVD or before maintenance) up to the date of the event or the date of the last follow-up. Survival rates were calculated in the groups of patients with and without normalization using the Kaplan-Meier method, curves were compared using the log-rank test, and the normalization effect was expressed through the hazard ratio (HR) estimate with a 95% CI derived from a univariable Cox model. The few patients who had no imaging at each time point were considered abnormal at that time.
Prognostic analyses of PFS or OS were performed in all patients with the Cox model using fixed covariates for evaluations performed at inclusion and time-dependent covariates for those evaluated either after three cycles or before maintenance, namely, evaluation by imaging technique and response to treatment. Time-to-event was calculated from the date of inclusion up to either the date of event or the date of last follow-up. The univariable analysis for PFS and OS on the entire patient population included the following variables: gender, age, calcium level, creatinine level, hemoglobin level, platelet count, lactate dehydrogenase level, albumin level, International Staging System stage, cytogenetic abnormalities at diagnosis (17p and/or t[4.14]), EMD defined by PET-CT at diagnosis, response after three cycles of induction, response before maintenance, MRI normality after three cycles of RVD and before maintenance, and PET-CT normality after three cycles of RVD and before maintenance. First, all variables without missing data were included in the multivariable analysis. Second, responses were also included. Forward selection was used with a likelihood ratio test. According to the number of events observed in our study (34 progressions and nine deaths all related to disease progression) and to the rule of thumb (at least five to 10 events per variable studied), no more than four and two variables were entered into the PFS and OS models, respectively. The effect of a prognostic factor was expressed through the HR estimate with a 95% CI.
In the subgroup of patients with MRD evaluations before maintenance, exploratory analyses were performed. Concordance between MRD and PET-CT imaging evaluations was presented in a two-way table. The level of agreement between the two evaluations was expressed by kappa statistics. The impact of a normal evaluation on PET-CT and of a negative MRD evaluation on PFS or OS at the time point before maintenance was studied using landmark analysis–rational, as in the study of normalization of the evaluation by image technique. In addition, to assess whether the two factors were independently associated with an event, a Cox model with only these two factors and their interaction was applied using backward selection through a likelihood ratio test. No additional complicated prognostic analyses were performed because of the exploratory nature of these data obtained on a subsample.
RESULTS
IFM/DFCI 2009 Trial
Seven hundred patients were randomly assigned to receive either RVD (arm A) or RVD plus ASCT (arm B).5 PFS was significantly prolonged in the transplantation group (median, 50 months v 36 months, respectively), whereas OS was similar in the two arms. MRD was not detectable in 65% of patients in the RVD group versus 79% of patients in the transplantation group (P < .001), and PFS was prolonged in patients with MRD-negative versus MRD-positive disease (HR, 0.33; P < .001).
IMAJEM Trial
Patient characteristics.
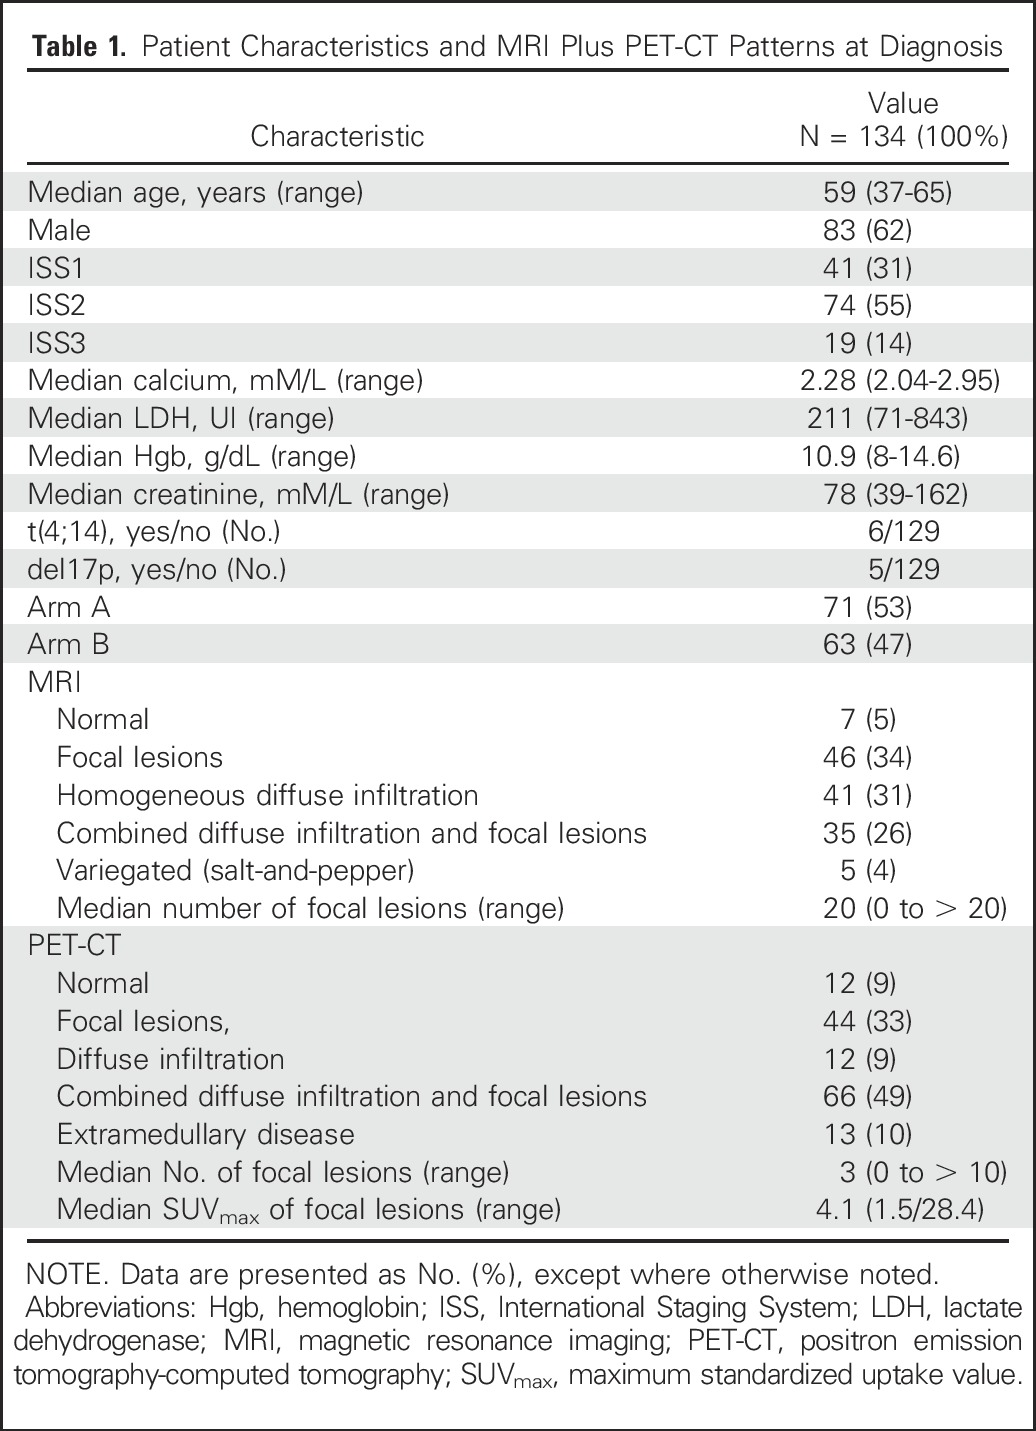
A total of 155 patients from 18 centers were enrolled, but MRI and PET-CT were performed at the three predefined time points (at diagnosis, after three cycles of RVD, and before maintenance) in 134 patients only (Fig 1). Patient characteristics, which were similar to those of the patients enrolled in the IFM/DFCI 2009 trial, and the MRI and PET-CT patterns are listed in Table 1.
Fig. 1.
CONSORT diagram for IMAJEM trial. ASCT, autologous stem-cell transplantation; MRI, magnetic resonance imaging; PET-CT, positron emission tomography-computed tomography; RVD, lenalidomide, bortezomib, and dexamethasone.
Table 1.
Patient Characteristics and MRI Plus PET-CT Patterns at Diagnosis
Primary end point: comparison of MRI versus PET-CT regarding the detection of bone lesions at diagnosis.
The agreements and disagreements in the detection of bone lesions at diagnosis between the two techniques are presented in Appendix Table A1 (online only). Disagreements occurred in 11 patients with detected lesions on MRI but not on PET-CT and in six patients with detected lesions on PET-CT, but not on MRI, leading to a nonsignificant difference in bone lesion detection by MRI and PET-CT (P = .33). The observed proportions of patients with a positive detection of bone lesions at diagnosis were 127 of 134 (95%) for MRI and 122 of 134 (91%) for PET-CT.
Secondary end points: prognostic impact of MRI and PET-CT for PFS and OS.
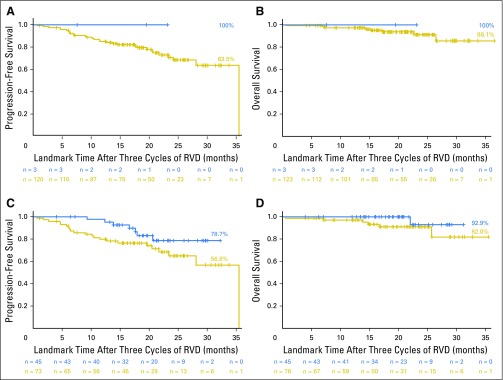
After three cycles of induction therapy with RVD, the rate of normalization of MRI was low (3%). This normalization was not predictive of PFS (Fig 2A; P = .42) or OS (Fig 2B; P = .67). PET-CT became negative after three cycles of RVD in 32% of the patients with a positive evaluation at baseline, and PFS was improved among them (30-month PFS, 78.7% with PET-CT normalization v 56.8% otherwise; P = .08; Fig 2C). Normalization of PET-CT after three cycles of RVD did not significantly affect OS (P = .16; Fig 2D).
Fig 2.
Progression-free survival (PFS) and overall survival (OS) according to normalization of magnetic resonance imaging (MRI) and positron emission tomography-computed tomography (PET-CT) after three cycles of induction therapy. (A) PFS, MRI normalized versus positive (P = .42). (B) OS, MRI normalized versus positive (P = .67). (C) PFS, PET-CT normalized versus positive (P = .08). (D) OS, PET-CT normalized versus positive (P = .16).
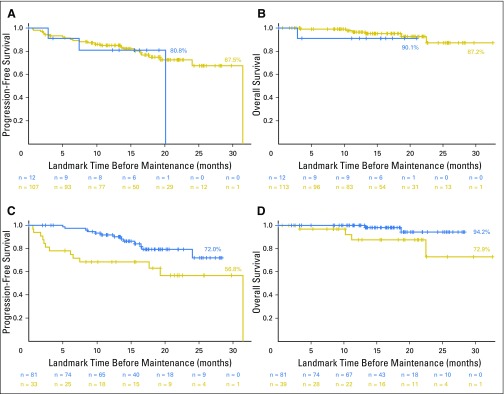
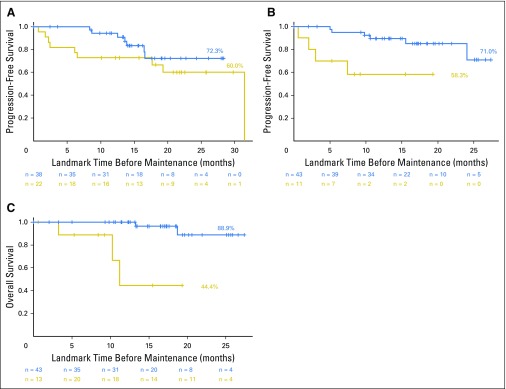
Before maintenance, MRI became normal in 11% of patients with positive results at baseline; however, this did not significantly affect PFS (P = .52; Fig 3A) or OS (P = .62; Fig 3B). PET-CT normalization before maintenance was described in 62% of the patients positive at baseline (58% in arm A with RVD and 75% in arm B with RVD plus ASCT). This was associated with better PFS (P = .011; Fig 3C) and OS (P = .033; Fig 3D). Normalization of PET-CT resulted in a 2-year OS rate of 94.2% versus 72.9% for patients without normalization of their PET-CT scan before maintenance. This was a significant prognostic factor for PFS (P = .004; Fig 4B) and OS (P < .001; Fig 4C) in arm B, but not in arm A (eight cycles of RVD; P = .22; Fig 4A for PFS).
Fig 3.
Progression-free survival (PFS) and overall survival (OS) according to normalization of magnetic resonance imaging (MRI) and positron emission tomography-computed tomography (PET-CT) before maintenance therapy. (A) PFS, MRI normalized versus positive (P = .52). (B) OS, MRI normalized versus positive (P = .62). (C) PFS, PET-CT normalized versus positive (P = .011). (D) OS, PET-CT normalized versus positive (P = .033).
Fig 4.
Progression-free survival (PFS) and overall survival (OS) according to normalization of PET-CT before maintenance therapy in arm A and arm B. (A) PFS, PET-CT normalized versus positive in arm A (eight cycles of lenalidomide, bortezomib, and dexamethasone; P = .22). (B) PFS, PET-CT normalized versus positive in arm B (lenalidomide, bortezomib, and dexamethasone plus frontline autologous stem-cell transplantation; P = .004). (C) OS, PET-CT normalized versus positive in arm B (P < .001).
The prognostic influence of each factor is listed in Appendix Table A2 (online only). Multivariable analyses of PFS and OS are listed in Table 2. A normal PET-CT before maintenance and the absence of EMD at diagnosis were independently associated with longer PFS. The absence of EMD at diagnosis and the absence of cytogenetic abnormalities were independent predictors of better OS.
Table 2.
Multivariable Analyses

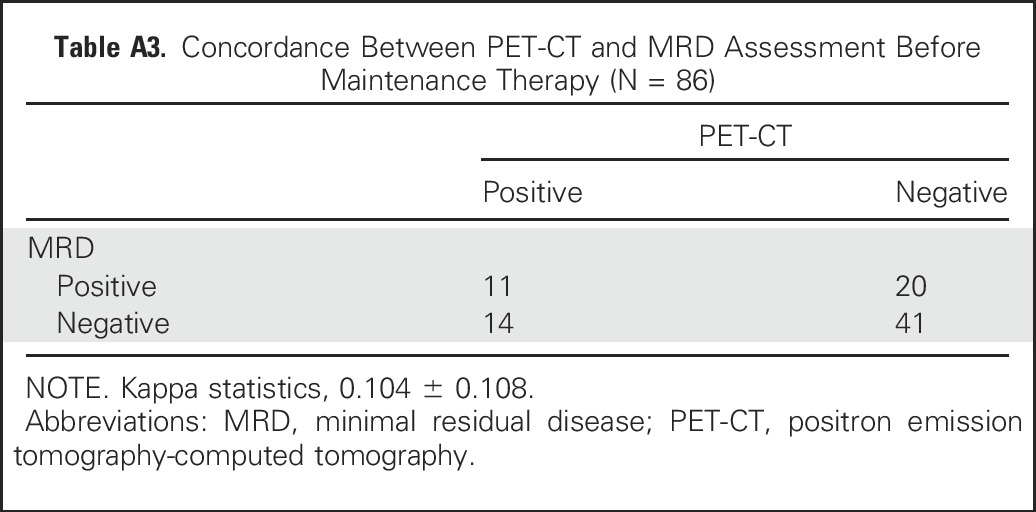
Eighty-six of 134 patients were evaluated for both PET-CT and MRD assessed by seven-color flow cytometry before maintenance. The concordance between these two tests was low (kappa = 0.105 ± 0.108; Appendix Table A3, online only). PFS was higher for the group of patients with both a normalized PET-CT and a negative MRD before maintenance versus patients with either PET positivity and/or MRD positivity before maintenance (3-year PFS, 86.8% v 52.9%, respectively; P = .05; Fig 5). When using a Cox model to analyze the impact of normalized PET-CT, negative MRD, and their interaction, the only remaining factor was the interaction (P = .06), indicating that these two tools may be complementary in predicting patient outcome.
Fig 5.
Progression-free survival for patients with negative positron emission tomography-computed tomography and negative minimal residual disease by flow cytometry before maintenance (41 of 86; 48%) versus others (45 of 86; 52%; P = .05).
DISCUSSION
MRI and PET-CT are important imaging methods in MM to detect bone lesions and bone involvement at diagnosis. It is currently accepted that MRI and PET/CT perform equally well in detecting FLs, but that MRI is better at detecting diffuse disease.1,8-12 Each technique has its own limitations and advantages.1 Our study, which was part of a recently conducted prospective clinical trial to assess RVD with or without ASCT, clearly shows the high detection rates of both methods. They detect lesions in more than 90% of patients, without any clear superiority of one technique over the other. The patterns of MRI and PET-CT positivity found in our patients at diagnosis are in agreement with previous findings.1-4,8-12 Of note, we did not use entire-body MRI or diffusion-weighted imaging MRI, which may increase sensitivity, but nevertheless, our positivity rate of 95% demonstrates the value of performing MRI of the spine and pelvis in patients with symptomatic MM at diagnosis.
The second important finding of our study is the lack of effectiveness of MRI during follow-up to assess prognosis. The low number of MRI normalizations after three cycles of RVD and before maintenance did not allow a prediction of outcome. The resolution of FLs in responding patients may take several months, and the sensitivity of MRI for the detection of remission may be reduced because of false-positive results of nonviable lesions.1,3,13 In this setting, novel MRI techniques, such as diffusion-weighted imaging MRI1,14 or dynamic contrast-enhanced MRI1,15 might be superior for the definition of response, but this has to be demonstrated in large studies.
Thus, for the better evaluation of prognosis, a metabolic technique, such as PET-CT, seems to be more appropriate. Indeed, our study shows the prognostic value of PET-CT normalization with a trend early during the treatment course and after three cycles of RVD, and a clearly significant effect before maintenance, with a strong correlation to PFS and OS. These findings were previously described by Bartel et al3 in the Total Therapy treatment scheme at the time of the first transplantation and by Zamagni et al4 in a tandem ASCT program after thalidomide-dexamethasone induction. Usmani et al16 also reported that PET-CT performed on day 7 postinduction (more than three FLs) could predict OS and might be exploited to guide early therapeutic changes. In our series, as observed in other reports,4 EMD defined by PET-CT at baseline was an independent prognostic factor for both PFS and OS.
It is important to stress that one of the major limitations of PET-CT is the lack of standardization. The criteria of response differ from one study to the other. Recently, novel criteria for the interpretation of PET-CT images were proposed.17 A collaborative effort from European Cooperative groups is under way to define a consensus analysis of PET-CT.
To our knowledge, this is the first time that the results of PET-CT and MRD were compared in a clinical trial. Results should be interpreted with caution because of the relatively small number of patients included in this exploratory analysis; however, we found that discrepancies were observed when comparing MRD negativity by flow and PET-CT negativity. The results suggest that these two techniques may be complementary for the definition of response, as recently proposed by the International Myeloma Working Group.18 The fact that patients with both PET-CT–negative and MRD-negative results have longer PFS compared with those who have a positive result with either technique may be of upmost importance for future treatment strategies. The double negativity of both MRD and PET-CT might become a valid end point in future trials.
In conclusion, no difference was observed in the detection of bone lesions at diagnosis when comparing whole-body PET-CT with MRI of the spine and pelvis. Whole-body PET-CT is a powerful tool to evaluate the prognosis of patients treated with triplet combinations with or without ASCT. In addition, PET-CT may be complementary to flow cytometry for MRD assessment.
Appendix
Table A1.
Agreements and Disagreements in the Detection of Bone Lesions Between MRI and PET-CT at Diagnosis
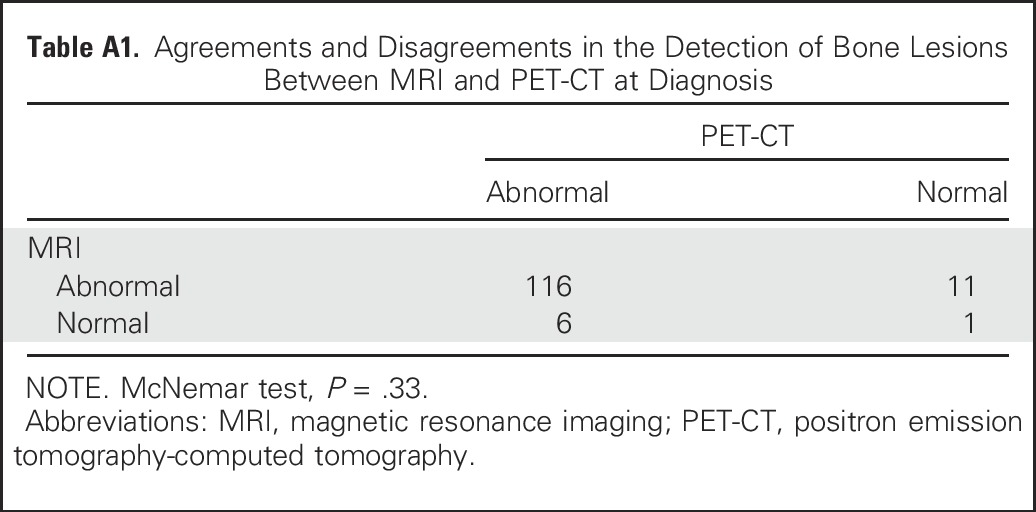
Table A2.
Univariable Analyses of Progression-Free Survival and Overall Survival

Table A3.
Concordance Between PET-CT and MRD Assessment Before Maintenance Therapy (N = 86)
Footnotes
Supported by the French Ministry of Health, Soutien aux Techniques Innovantes Coûteuses 2010 Cancer STIC 10/03, and the National Institutes of Health Grants No. PO1-155258 and P50-100707.
Presented at the 57th annual meeting of the American Society of Hematology, Orlando, FL, December 5-8, 2015; oral presentation, Blood 126:395a, 2015.
Clinical trial information: NCT01309334.
Listen to the podcast by Dr San Miguel at ascopubs.org/jco/podcasts
AUTHOR CONTRIBUTIONS
Conception and design: Philippe Moreau, Thierry Facon, Paul Richardson, Jean-Michel Nguyen, Benoit Dupas, Françoise Kraeber-Bodere
Provision of study materials or patients: Margaret Macro
Collection and assembly of data: Philippe Moreau, Michel Attal, Denis Caillot, Margaret Macro, Lionel Karlin, Laurent Garderet, Thierry Facon, Lotfi Benboubker, Martine Escoffre-Barbe, Anne-Marie Stoppa, Kamel Laribi, Cyrille Hulin, Aurore Perrot, Gerald Marit, Jean-Richard Eveillard, Florence Caillon, Caroline Bodet-Milin, Brigitte Pegourie, Veronique Dorvaux, Carine Chaleteix, Paul Richardson, Aurelie Gaultier, Jean-Michel Nguyen, Benoit Dupas, Eric Frampas, Francoise Kraebe-Bodere
Data analysis and interpretation: Philippe Moreau, Michel Attal, Denis Caillot, Lionel Karlin, Laurent Garderet, Thierry Facon, Lotfi Benboubker, Martine Escoffre-Barbe, Anne-Marie Stoppa, Kamel Laribi, Cyrille Hulin, Aurore Perrot, Gerald Marit, Jean-Richard Eveillard, Florence Caillon, Caroline Bodet-Milin, Brigitte Pegourie, Veronique Dorvaux, Carine Chaleteix, Kenneth Anderson, Paul Richardson, Nikhil C. Munshi, Herve Avet-Loiseau, Aurelie Gaultier, Jean-Michel Nguyen, Benoit Dupas, Eric Frampas, Francoise Kraebe-Bodere
Manuscript writing: All authors
Final approval of manuscript: All authors
Accountable for all aspects of the work: All authors
AUTHORS' DISCLOSURES OF POTENTIAL CONFLICTS OF INTEREST
Prospective Evaluation of Magnetic Resonance Imaging and [18F]Fluorodeoxyglucose Positron Emission Tomography-Computed Tomography at Diagnosis and Before Maintenance Therapy in Symptomatic Patients With Multiple Myeloma Included in the IFM/DFCI 2009 Trial: Results of the IMAJEM Study
The following represents disclosure information provided by authors of this manuscript. All relationships are considered compensated. Relationships are self-held unless noted. I = Immediate Family Member, Inst = My Institution. Relationships may not relate to the subject matter of this manuscript. For more information about ASCO's conflict of interest policy, please refer to www.asco.org/rwc or ascopubs.org/jco/site/ifc.
Philippe Moreau
Honoraria: Celgene, Takeda, Novartis, Janssen-Cilag, Amgen
Consulting or Advisory Role: Celgene, Takeda, Janssen, Novartis, Amgen
Michel Attal
Honoraria: Celgene, Sanofi
Consulting or Advisory Role: Celgene, Sanofi
Denis Caillot
Honoraria: Amgen
Travel, Accommodations, Expenses: Novartis
Margaret Macro
Honoraria: Celgene, Janssen, Amgen, Takeda, Bristol-Myers Squibb, Sanofi
Consulting or Advisory Role: Celgene, Janssen, Sanofi
Travel, Accommodations, Expenses: Janssen, Celgene, Bristol-Myers Squibb, Amgen
Lionel Karlin
Employment: Laboratoire Aguettant France (I)
Honoraria: Celgene, Janssen, Amgen, Takeda, Bristol-Myers Squibb
Consulting or Advisory Role: Janssen, Celgene, Amgen, Takeda, Bristol-Myers Squibb
Laurent Garderet
Consulting or Advisory Role: Amgen, Takeda, Novartis, Bristol-Myers Squibb
Travel, Accommodations, Expenses: Bristol-Myers Squibb, Amgen
Thierry Facon
Honoraria: Celgene, Janssen
Consulting or Advisory Role: Celgene, Janssen
Speakers' Bureau: Celgene, Janssen
Travel, Accommodations, Expenses: Celgene, Janssen (I)
Lotfi Benboubker
Consulting or Advisory Role: Celgene, Amgen, Janssen
Martine Escoffre-Barbe
No relationship to disclose
Anne-Marie Stoppa
No relationship to disclose
Kamel Laribi
No relationship to disclose
Cyrille Hulin
Honoraria: Celgene, Amgen, Janssen, Novartis
Aurore Perrot
No relationship to disclose
Gerald Marit
No relationship to disclose
Jean-Richard Eveillard
No relationship to disclose
Florence Caillon
No relationship to disclose
Caroline Bodet-Milin
No relationship to disclose
Brigitte Pegourie
Consulting or Advisory Role: Takeda, Novartis, Bristol-Myers Squibb
Veronique Dorvaux
No relationship to disclose
Carine Chaleteix
Honoraria: Amgen
Kenneth Anderson
Consulting or Advisory Role: Celgene, Millennium, Gilead Sciences, Bristol-Myers Squibb
Patents, Royalties, Other Intellectual Property: C4 Therapeutics, OncoPep
Paul Richardson
Consulting or Advisory Role: Celgene, Janssen Pharmaceuticals, Takeda
Research Funding: Celgene, Millennium
Nikhil C. Munshi
Stock or Other Ownership: OncoPep
Consulting or Advisory Role: Celgene, Takeda, Janssen, Pfizer, Merck, OncoPep
Patents, Royalties, Other Intellectual Property: OncoPep
Herve Avet-Loiseau
Honoraria: Celgene, Janssen-Cilag, Takeda
Consulting or Advisory Role: Celgene, Janssen-Cilag, Takeda
Aurelie Gaultier
No relationship to disclose
Jean-Michel Nguyen
No relationship to disclose
Benoit Dupas
No relationship to disclose
Eric Frampas
No relationship to disclose
Françoise Kraeber-Bodere
No relationship to disclose
REFERENCES
- 1.Terpos E, Dimopoulos MA, Moulopoulos LA: The role of imaging in the treatment of patients with multiple myeloma in 2016. Am Soc Clin Oncol Educ Book 35:e407-e417, 2016 [DOI] [PubMed] [Google Scholar]
- 2.Rajkumar SV, Dimopoulos MA, Palumbo A, et al. : International Myeloma Working Group updated criteria for the diagnosis of multiple myeloma. Lancet Oncol 15:e538-e548, 2014 [DOI] [PubMed] [Google Scholar]
- 3.Bartel TB, Haessler J, Brown TL, et al. : F18-fluorodeoxyglucose positron emission tomography in the context of other imaging techniques and prognostic factors in multiple myeloma. Blood 114:2068-2076, 2009 [DOI] [PMC free article] [PubMed] [Google Scholar]
- 4.Zamagni E, Patriarca F, Nanni C, et al. : Prognostic relevance of 18-F FDG PET/CT in newly diagnosed multiple myeloma patients treated with up-front autologous transplantation. Blood 118:5989-5995, 2011 [DOI] [PubMed] [Google Scholar]
- 5.Attal M, Lauwers-Cances V, Hulin C, et al. : Lenalidomide, bortezomib, and dexamethasone with transplantation for myeloma. N Engl J Med 376:1311-1320, 2017 [DOI] [PMC free article] [PubMed] [Google Scholar]
- 6.Durie BG, Harousseau JL, Miguel JS, et al. : International uniform response criteria for multiple myeloma. Leukemia 20:1467-1473, 2006 [DOI] [PubMed] [Google Scholar]
- 7.Roussel M, Lauwers-Cances V, Robillard N, et al. : Front-line transplantation program with lenalidomide, bortezomib, and dexamethasone combination as induction and consolidation followed by lenalidomide maintenance in patients with multiple myeloma: A phase II study by the Intergroupe Francophone du Myélome. J Clin Oncol 32:2712-2717, 2014 [DOI] [PubMed] [Google Scholar]
- 8.Baur-Melnyk A, Buhmann S, Becker C, et al. : Whole-body MRI versus whole-body MDCT for staging of multiple myeloma. AJR Am J Roentgenol 190:1097-1104, 2008 [DOI] [PubMed] [Google Scholar]
- 9.Zamagni E, Nanni C, Patriarca F, et al. : A prospective comparison of 18F-fluorodeoxyglucose positron emission tomography-computed tomography, magnetic resonance imaging and whole-body planar radiographs in the assessment of bone disease in newly diagnosed multiple myeloma. Haematologica 92:50-55, 2007 [DOI] [PubMed] [Google Scholar]
- 10.Waheed S, Mitchell A, Usmani S, et al. : Standard and novel imaging methods for multiple myeloma: Correlates with prognostic laboratory variables including gene expression profiling data. Haematologica 98:71-78, 2013 [DOI] [PMC free article] [PubMed] [Google Scholar]
- 11.Terpos E, Kleber M, Engelhardt M, et al. : European Myeloma Network guidelines for the management of multiple myeloma-related complications. Haematologica 100:1254-1266, 2015 [DOI] [PMC free article] [PubMed] [Google Scholar]
- 12.Breyer RJ, III, Mulligan ME, Smith SE, et al. : Comparison of imaging with FDG PET/CT with other imaging modalities in myeloma. Skeletal Radiol 35:632-640, 2006 [DOI] [PubMed] [Google Scholar]
- 13.Bannas P, Hentschel HB, Bley TA, et al. : Diagnostic performance of whole-body MRI for the detection of persistent or relapsing disease in multiple myeloma after stem cell transplantation. Eur Radiol 22:2007-2012, 2012 [DOI] [PubMed] [Google Scholar]
- 14.Horger M, Weisel K, Horger W, et al. : Whole-body diffusion-weighted MRI with apparent diffusion coefficient mapping for early response monitoring in multiple myeloma: Preliminary results. AJR Am J Roentgenol 196:W790-795, 2011 [DOI] [PubMed] [Google Scholar]
- 15.Merz M, Ritsch J, Kunz C, et al. : Dynamic contrast-enhanced magnetic resonance imaging for assessment of antiangiogenic treatment effects in multiple myeloma. Clin Cancer Res 21:106-112, 2015 [DOI] [PubMed] [Google Scholar]
- 16.Usmani SZ, Mitchell A, Waheed S, et al. : Prognostic implications of serial 18-fluoro-deoxyglucose emission tomography in multiple myeloma treated with total therapy 3. Blood 121:1819-1823, 2013 [DOI] [PMC free article] [PubMed] [Google Scholar]
- 17.Nanni C, Zamagni E, Versari A, et al. : Image interpretation criteria for FDG PET/CT in multiple myeloma: A new proposal from an Italian expert panel. IMPeTUs (Italian Myeloma criteria for PET USe). Eur J Nucl Med Mol Imaging 43:414-421, 2016 [DOI] [PubMed] [Google Scholar]
- 18.Kumar S, Paiva B, Anderson KC, et al. : International Myeloma Working Group consensus criteria for response and minimal residual disease assessment in multiple myeloma. Lancet Oncol 17:e328-e346, 2016 [DOI] [PubMed] [Google Scholar]


