Abstract
Signal Amplification By Reversible Exchange (SABRE) is an inexpensive, fast, and even continuous hyperpolarization technique that uses para-hydrogen as hyperpolarization source. However, current SABRE faces a number of stumbling blocks for translation to biochemical and clinical settings. Difficulties include inefficient polarization in in water, relatively short lived 1H-polarization, and relatively limited substrate scope. Here we use a water soluble polarization transfer catalyst to hyperpolarize nitrogen-15 in a variety of molecules with SABRE-SHEATH (SABRE in Shield Enables Alignment Transfer to Heteronuclei). This strategy works in pure H2O or D2O solutions, on substrates that could not be hyperpolarized in traditional 1H-SABRE experiments, and we record 15N T1 relaxation times of up to 2 min.
Graphical abstract
Introduction
NMR and MRI are non-destructive methods to obtain information about molecular structure and spatial morphology. However, magnetic resonance is restricted mainly because of the inherently low sensitivity as a result of low thermal polarization levels. For example, NMR spectroscopy and clinical MRI predominantly use highly abundant 1H nuclei. Even so observation of low concentration analytes remains challenging. Hyperpolarization methods (e.g. DNP, PHIP, SABRE, SEOP)1–7 enhance MR signals by 4–5 orders of magnitude and overcome inherent sensitivity limitations.8–11
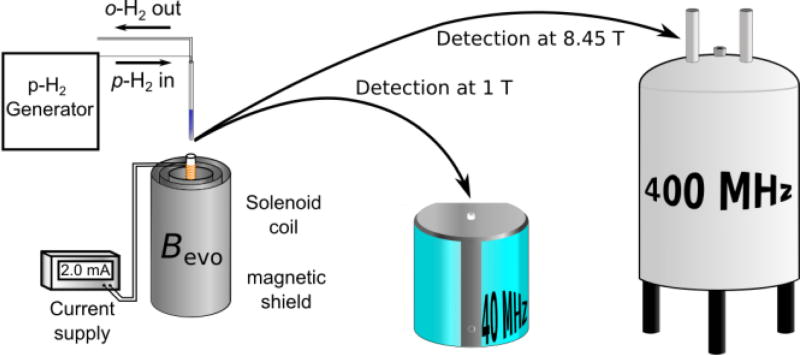
Traditionally, hyperpolarization methods require extensive optimization. Usually methods and optimization are associated with high experimental complexity and cost. In this regard, Signal Amplification By Reversible Exchange (SABRE) stands out because it is simple, fast and continuously repeatable.4, 12 SABRE uses readily available para-hydrogen (p-H2) as source of polarization. The transfer occurs in reversibly formed substrate-hydrogen adducts in a transition metal complex. The magnetic evolution field Bevo must be sufficiently low to mix energy levels between hydride-1H and the target nucleus to establish a path for polarization transfer.7, 13 While protons in the substrate are targeted at magnetic fields around 65 G,14 transfer to heteronuclei (e.g. 15N, 13C, 31P) occurs at µT magnetic fields using a technique termed SABRE in Shield Enables Alignment Transfer to Heteronuclei (SABRE-SHEATH).7 As shown in Scheme 1, the required hardware is relatively simple.
Scheme 1.
A sample is hyperpolarized via SABRE-SHEATH for an evolution time tevo at optimized matching field Bevo of ~0.5 µT established by a small solenoid coil in a magnetic shield that attenuates the Earth’s magnetic field. The sample is transferred into a benchtop (1 T) NMR spectrometer or conventional high-field (8.45 T) spectrometer for detection after hyperpolarization.
As a result of experimental simplicity and its promise, SABRE and SABRE-SHEATH are now attracting an increasing number of research groups contributing to its rapid development.4, 7, 14–20 A milestone for SABRE was the transition from organic solvents to aqueous solutions, which was recently achieved for 1H-SABRE.21–24
Still, for 1H spin lattice relaxation times are relatively short and the substrate scope is limited. Direct polarization transfer to heteronuclei has not been demonstrated in aqueous environment. Hyperpolarizing nitrogen-15 via SABRE-SHEATH allows a wider range of structural motives and relaxation times are characteristically larger.
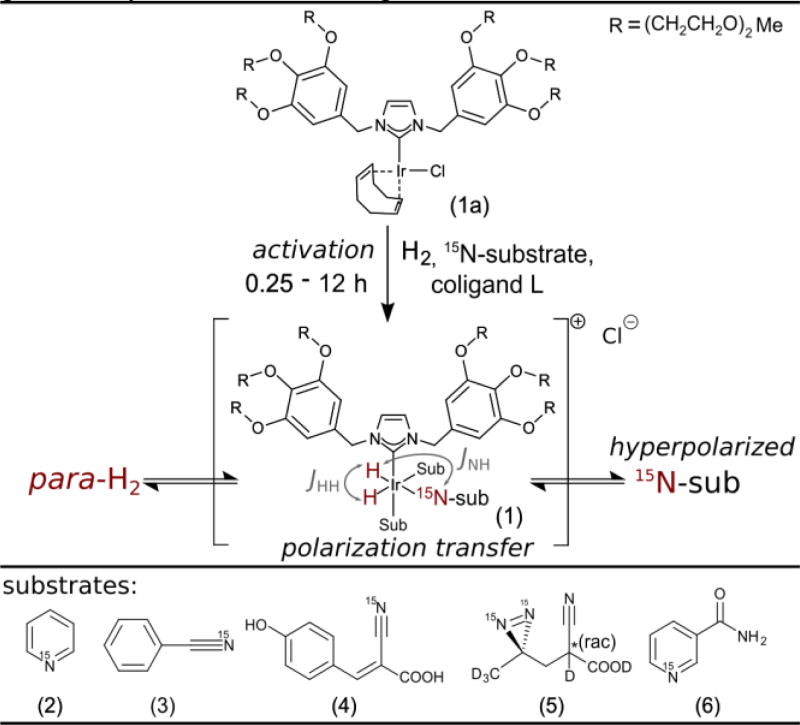
SABRE-SHEATH with 15N targets is made accessible with the water soluble [IrCl(IDEG)(COD)] precatalyst (1a). As shown in Scheme 2 the precatalyst is converted to the catalytically active species (1) in presence of substrates under a hydrogen atmosphere.21 At µT magnetic field hydride and 15N energy levels match and the spin system coherently evolves with a rate given by JNH-into 15N-polarization on substrates.25
Scheme 2.
The precatalyst [IrCl(IDEG)(COD)] (1a) is transformed into the active species Ir(IDEG)(H)2Sub3 (Sub = Substrate) (1) in the presence of a substrate of choice (2–6) under a hydrogen atmosphere. Reversible exchange leads to polarization buildup on 15N within 30–120 s. The polarization transfer is primarily driven by the JNH-coupling through the bonds that form a 180° angle. The N-H coupling through bonds forming a 90° angle is close to zero.
We investigate different molecular motifs found in medical drugs, biomolecules and molecular tags. Structural motifs could be readily translated from the established [IrCl(IMes)(COD)] system.15, 26
Pyridine (2), the canonical SABRE substrate,4 was a logical first choice. Next, nitriles are often encountered in drugs,27 polarize consistently well, tolerate complex backbones, and show large 15N-SABRE-SHEATH enhancements, despite little to no 1H-SABRE.26, 28 We selected benzonitrile (3) and α-cyano-4-hydroxycinnamic acid (4) (CHCA, buffered with NaOD to pH 7.5). Diazirines, which also do not exhibit 1H enhancements, are common biomolecular tags that can replace CH2 groups in many classes of biomolecules.29 Here we use 2-cyano-3-(D3-methyl-15N2-diazirine)-propanoic acid (5). Lastly, we focus on nicotinamide (6), the amide of vitamin B3, which could be tolerated in vivo at detectable concentrations and is a potential option for translation to biomedical studies.19, 30
For these substrates we detail hyperpolarization levels, carefully characterize temperature and magnetic field dependencies, consider the effect of deuterated vs protonated solvents (D2O vs H2O), and measure relaxation time constants at various magnetic fields.
Results & Discussion
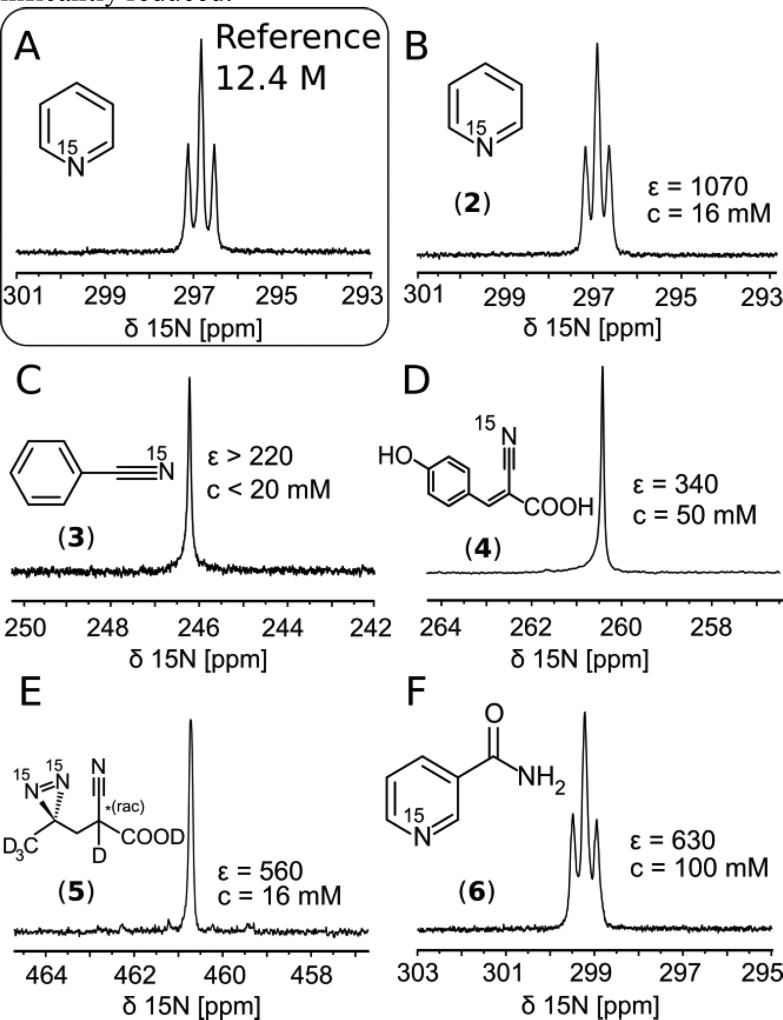
In Figure 1 we show a comparison between single scan spectra originating from compounds directly SABRE-SHEATH hyperpolarized in aqueous medium, referenced to thermally polarized neat 15N-pyridine at 8.45 T. Concentrations of investigated compounds are different as a result of solubility as well as sample loss phenomena for benzonitrile and pyridine. Both pyridine and benzonitrile were initially prepared as 100 mM solutions but after activation by H2 bubbling the concentrations were significantly reduced.
Figure 1.
15N spectra of A) thermally polarized reference at 8.45 T and B–F) hyperpolarized compounds (in D2O unless denoted otherwise). A) neat 15N-pyridine. B) 15N-Pyridine, C) 15N-Benzonitrile, D) 15N-CHCA, E) 15N2-Diazirine F) 15N-Nicotinamide (in H2O).
A synopsis of experimental results and conditions is given in Table 1 (experimental details provided in Materials and Methods). Spectra are acquired at 1 T and 8.45 T (see Scheme 1.) to study the field dependence of T1 relaxation as detailed below. The 1 T measurements also demonstrate the feasibility of high sensitivity single scan 15N detection with a benchtop NMR system. Furthermore, to determine the effect of proton containing solvents, nicotinamide was investigated in H2O.
Table 1.
Synopsis of experimental conditions, enhancements and polarization levels. Substrates are 15N labelled, solvent is D2O unless otherwise specified. Concentrations of liquid substrates are determined at the time of the experiment using 1H spectroscopy. T = 75 °C.
| Substrate | Activation time [h] |
csubstrate /ccatalyst |
cSubstrate [mM] |
Enhancement 8.45 T (P [%]) |
Enhancement 1 T (P [%]) |
Enhancement ratio (1 T/8.45 T) |
|---|---|---|---|---|---|---|
| (2) pyridine | 12 | 3.3 | 16.5[b] | 1100 | -[c] | -[c] |
| (3) benzonitrile | 0.25 | 20 | 50[a,b] | 90 | -[c] | -[c] |
| (4) CHCA | 12 | 10 | 50 | 440 (0.13) | 3700 (0.13) | 8.4 |
| (5) diazirine | 6 | 10 | 16.3 | 560 (0.16) | 4700 (0.17) | 8.4 |
| (6) nicotinamide | 12 | 20 | 100 | 520(0.16) | 6100 (0.21) | 8.9 |
| (6) nicotinamide H2O | 12 | 20 | 100 | 630 (0.2) | 10500 (0.37) | 28 |
Signal maximum obtained 30 min. after activation, subsequent substrate loss due to evaporation.
Initial concentration 100 mM.
Insufficient SNR.
We find that polarization levels in deuterated solvents are largely independent of the detection field i.e. enhancements simply scale with the thermal polarization. In contrast, for nicotinamide in H2O (Table 1, Entry 6), we observe lower apparent polarization levels at 8.45 T. This is caused by relaxation losses during transfer because it takes much longer to transfer the sample into the high field magnet (~8 s) than into the benchtop device sitting right next to the magnetic shields (~2 s). The solvent protons (and deuterons) are in chemical exchange with the 15N-substrate where they cause spin-dipole relaxation. This relaxation mechanism scales with the distance between the relaxation partners rij−6 as well as the gyromagnetic ratio, which is 6.5 times smaller for deuterium,31,32 explaining the observed differences between solvents.
SABRE-SHEATH in water gives rise to a new set of challenges. Water has significantly higher viscosity and surface tension than methanol, and at room temperature the solubility of hydrogen in water is five times lower.33–34 We observed that some samples, specifically non-polar liquid state substrates (e.g. benzonitrile and pyridine) are extracted from the solvent when bubbling with hydrogen during the polarization buildup. Nicotinamide and CHCA, both crystalline solids when isolated, were used for systematic studies as substrate loss did not occur.19
Of particular interest are the dependence of the 15N polarization on temperature and magnetic evolution field Bevo. Figure 2 contrasts the established [IrCl(IMes)(COD)] in methanol and catalyst (1) in H2O/D2O as a function of these variables (T, Bevo).
Figure 2.
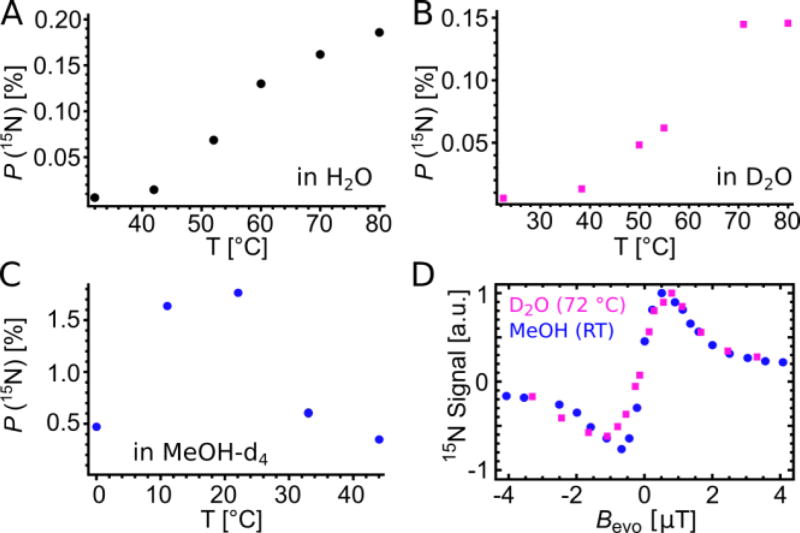
Comparison of 15N polarization as a function of temperature in A) H2O, B) D2O and C) methanol-d4 at Bevo = 0.5 µT. D) Hyperpolarized signals as function of µT field at the temperature corresponding to maximum polarization in the respective solvents: 22 °C for 15N-acetonitrile in MeOH-d4 and 72 °C for 15N-CHCA in D2O (blue: 5 mM [IrCl(IMes)(COD)], 30 mM pyridine, 100 mM 15N-CH3CN, methanol-d4; magenta: 5mM [IrCl(IDEG)(COD)], 30 mM pyridine, 50 mM 15N-CHCA, D2O).
The temperature dependence was studied using a 100 mM nicotinamide sample. For catalyst system (1) in H2O (Fig. 2A) and D2O (Fig. 2B) the 15N polarization increases with temperature. In contrast, in methanol (Fig. 2C, [IrCl(IMes)(COD)] precursor) the largest polarization is recorded at room temperature.
The magnetic field dependence is shown in Figure 2D. We compare normalized data (max. 15N polarization: 0.13% in D2O, 1.7% in MeOH-d4) of two nitrile/solvent systems: first, in blue: 15N-acetonitrile in MeOH-d4 with [IrCl(IMes)(COD)] and second, in magenta, 15N-CHCA in D2O with[IrCl(IDEG)(COD)] (1a).
We note that nitriles are better suited for this study than nicotinamide, as enhancements are more robust and reproducible. Additionally, they exhibit inversion of the NMR signal upon inversion of Bevo. Variation of the temperature changes the dissociation rate constants of substrate and catalyst bound H2.13, 15, 35 Optimal polarization transfer efficiency is expected when the exchange rate kdiss is on the order of the 15N-to-hydride JNH-coupling across the iridium center (see scheme 2).13, 35 Figures 1A–C show that the IMes catalyst in methanol yields largest 15N-polarization at room temperature, whereas catalyst (1) requires significantly elevated temperatures to achieve comparable exchange rates leading to maximum polarization. Based on these insights it is reasonable to expect 15N polarization in water to decrease at even higher temperatures in analogy to methanol, as shown in Fig. 2C.
As seen in Fig. 2D, the methanol and water systems show very similar responses to Bevo at their respective optimized temperatures (22 °C and 72 °C). The response curves originate from two distinct matching conditions associated with overpopulation in 15N-α or 15N-β, giving either positive or negative NMR signal with identical polarization levels.26 The matching conditions are given by7
| (Eq. 1) |
where JHH is the hydride-to-hydride J-coupling (~ 10 Hz) and JNH the hydride to 15N coupling (~ 20 Hz) in (1). Experimentally, we observe maxima at Bevo ≈ ±0.5 µT which is slightly higher than the ±0.3 µT predicted from Eq. 1, as the limited lifetime broadens the matching conditions.
Taken together, the observations of Fig. 1 (A–D) suggest, that the activation energy of substrate dissociation from (1) is significantly larger than for the established [IrCl(IMes)(COD)]-methanol systems. This is also supported by the fact that catalyst (1) in methanol at RT did not yield any enhancement.
The absolute polarization level in D2O is about one order of magnitude smaller than for the methanol system, when compared at their respective optimized temperatures (15N-CHCA in D2O, P(15N) = 0.13 %, 15N-CH3CN in d4-MeOH, P(15N) = 1.7 %). Interestingly, this difference in hyperpolarization level can simply be attributed to the difference in hydrogen solubility (factor 5) and the difference in solvent concentration (c(H2O) = 55 mol/L, c(MeOH) = 28 mol/L, factor 2).
Current experimental data and theoretical considerations indicate that SABRE polarization levels are limited by the exchange of hydrides on the iridium center and the exchange kinetics of other ligand types (substrate/solvent), as well as both pressure and flow rate of para-hydrogen. Exchange of hydrogen restores the polarization source to the active complex species and process proceeds via the mixed classical non-classical hydride [Ir(H)2(η-H2)(IMes)L2], with arbitrary ligands L.13, 15 Formation of this species requires collision between a 16-electron complex and a hydrogen molecule, where collision with a para-hydrogen molecule may refresh the active species. As a result, the polarization is proportional to the concentration of para-hydrogen in solution, not the saturation concentration of hydrogen (ortho + para). Accordingly pressure dependence of polarizations is relatively weak, whereas dependence on the flow rate is significant. Depending on system composition a linear or exponential dependence of 15N polarization on the flow rate was reported.26, 36–37 We conclude the para-hydrogen enrichment in solution is limited by the exchange at the gas-liquid interface.
Let us now consider the substrate exchange process. The rates of ligand dissociation kdiss and association kasso determine not only the lifetime of the complex where polarization transfer from the hydrides to the target nuclei occurs, but also the concentration of the 16-electron species required for the hydride exchange.13 As a result 15N polarization depends directly on the concentration of the 16-electron species. Accordingly, largest polarizations are observed at relatively low catalyst concentrations and high catalyst loadings. It is noteworthy that an exponential dependence of polarization on the substrate concentrations has been observed by Appleby et al.38
We point out that all reported polarization levels are not optimized with respect to sample composition, concentrations, hydrogen pressure or flow rate. Optimization of catalyst concentration and loading afforded an 8–10-fold increase of 15N polarization level for the methanol system. Maximum polarizations are recorded at low catalyst concentrations and high catalyst loadings (15N-nicotinamide P(15N) = 7 % 15N-benzonitrile P(15N) = 16 %, metronidazole at natural abundance P(15N) = 20%).7, 13, 17, 36, 39 We conclude, that 15N polarization can be increased by at least a factor 10 by using low substrate concentrations and high catalyst loading. Further improvements are expected by modifications to the experimental setup to allow for more effective mixing of hydrogen and solvent at higher pressures.
15N Relaxation times in water
Of particular importance for hyperpolarization applications is the spin lattice relaxation time T1, which defines the viable time delay between preparation of hyperpolarization and detection. We examined the T1 lifetime for 15N-Nicotinamide39 and 15N-CHCA, which constitute biocompatible compounds and contain 15N in chemically different environments.39–41 Table 2 shows the 15N-T1 relaxation times in D2O, which at 1 T exceed 1 min for both compounds.
Table 2.
15N T1 times of 100 mM Nicotinamide and 50 mM CHCA in D2O at different detection fields.
detected and stored at 1 T. Control by detection at 8.45 T: T1 = 68 ± 2 s.
In H2O: 32 ± 5.5 s
For 15N-Nicotinamide at 8.45 T we find the effect of proton containing solvent (H2O) on the T1 time to be negligible. It should be noted that the 15N T1 time of nicotinamide at 8.45 T and room temperature is close to the T1 reported for 13C in the 13C(1)-pyruvate markers currently in clinical use for prostate cancer diagnostics (T1 = 29.2 s in-vivo, T1 = 60 s, ex-vivo, 3 T).8–9 It is noteworthy, that the 13C T1 values in-vivo are smaller than ex-vivo, characteristic for diffusion in constricted environments.
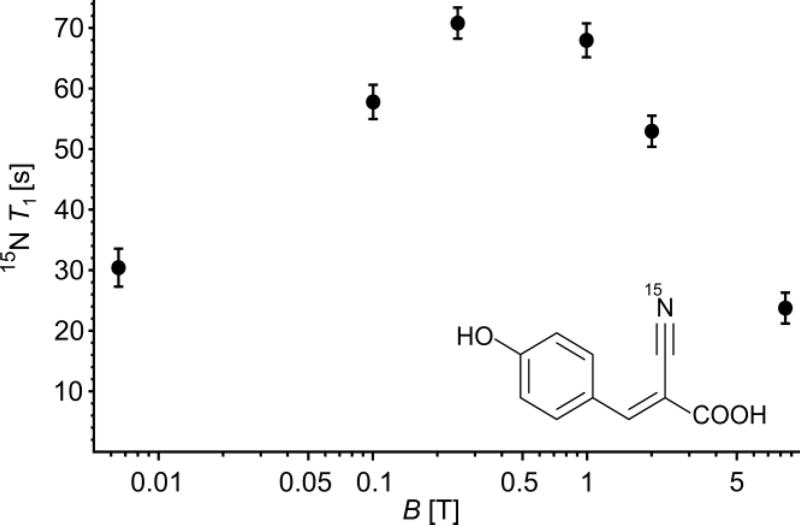
To elucidate this field dependence in more detail we hyperpolarized 15N-CHCA and held the sample at different fields for variable times prior to detection. The results are shown in Fig. 3 displaying 15N-relaxation time of CHCA (50 mM, pH 7.5, D2O) at with different magnetic fields. For this compound relatively low magnetic fields of about 0.2 T give the longest relaxation times. This is an intriguing finding in the context of low-field approaches to NMR and MRI42–43, which could be coupled with SABRE to establish low-cost spectroscopy and molecular imaging.
Figure 3.
15N T1 time constant of CHCA as a function of the magnetic field. The sample is hyperpolarized and stored at a given field for an incremented delay time and detected at 8.45 T.
The scaling of signal-to-noise with magnetic field strongly depends on the exact experimental conditions. For traditional thermal NMR, signal is proportional to polarization and the induction. Both terms are proportional to B0, thus the signal scales with B02.31, 44 In NMR, coil noise is typically dominant, which scales as B01/4, hence signal-to-noise (S/N) is proportional to B07/4.44–46 However, with a hyperpolarized sample spin polarization is independent of B0 and thus, S/N scales with B03/4.
Another scenario arises for human MRI. Here, dielectric losses dominate, which are proportional to B0. Thus S/N only increases proportional to B0 for thermal MRI experiments.45, 47 Therefore, S/N is expected to be independent of B0 for hyperpolarized human MRI.48–49 MRI in low magnetic fields has significant advantages, as magnet and RF-circuit design are flexible, easy to construct, and relatively inexpensive.49–50 For example, high performance 1H-MRI at 6.5 mT with thermal magnetization has already been reported.42 It is noteworthy that recent advances in the low field domain, such as “External High-Quality-factor-Enhanced NMR” (EHQE-NMR)51 and others52 lead S/N independent of B0 even for spectroscopic applications.
Materials and Methods
Solutions of substrates in D2O/H2O were added to [IrCl(IDEG)(COD)] (IDEG = 1,3-bis-(3,4,5-tris(diethyleneglycol)benzyl))imidazole-2-ylidene), COD = 1,5-cyclooctadiene), stirred until a homogeneous solution of known concentration in catalyst is obtained, and transferred to a 5 mm medium wall pressure NMR tube (Wilmad 524-PV-7). The typical sample volume was 350 µL. The solution was bubbled with argon for 30 minutes, pressurized with 10 bar of para-H2 and hydrogen flow adjusted to obtain adequate bubbling. Catalyst activation times were 0.25–12 h depending on substrate, solvent (deuterated solvents require longer activation times), and temperature. Catalyst activation can be sped up significantly by raising temperature. For SABRE SHEATH experiments para-H2 (Bruker BPHG 090, 38 K, 90%) was bubbled through a sample placed in a µT magnetic field. Hyperpolarization buildup is achieved in 0.5–2 min. The µT field is generated by a small solenoid inside a magnetic shield (see Scheme 1). The sample temperature was controlled with a water bath inside the magnetic shields. Measurements were performed with a Bruker Avance DX 360 (8.45 T) or Magritek Spinsolve 1H/15N Spectrometer (1 T). Enhancements are calculated relative to neat 15N labeled pyridine. The concentration in the samples was monitored by 1H spectroscopy.
Conclusions
We have demonstrated SABRE SHEATH hyperpolarization of 15N in aqueous media at moderate temperatures (20 – 80 °C) and achieve up to 1000-fold enhancements over thermal measurements at 8.45 T. We applied SABRE-SHEATH in water to biocompatible marker groups in different molecules (CHCA, nicotinamide, diazirine-moieties). Hyperpolarization of 15N-nitrile and the 15N2-diazirine exemplifies how SABRE-SHEATH is amendable to more substrate classes because 15N is closer to the hyperpolarization source than protons in the molecular backbone.
Furthermore, we demonstrated T1 times comparable to, or exceeding, clinically used DNP tracers.8–9 For example, nicotinamide in D2O exhibits a 15N relaxation time of 2 min, which is significantly longer than typical 1H-T1 (seconds) of traditional 1H-SABRE substrates. Still, recent advances have demonstrated long lived 1H singlet states with decay times of up to 4.5 min.30 When such strategies are translated to 15N, lifetimes in excess of 20 min become available.53
Imaging applications of SABRE hyperpolarized protons24 as well as nitrogen-15 have already been reported.36 Hyperpolarized heteronuclei are beneficial as they are background free and have a large chemical shift range which allows for easy chemical identification. Future developments may be expected to advance SABRE to in vivo molecular imaging complementing DNP-hyperpolarized 13C tracers, which have quickly become an essential and routine tool giving detailed and fundamental insight into in vivo metabolism and biochemistry.8–9, 54–58
Supplementary Material
Acknowledgments
The authors gratefully acknowledge the NSF (CHE-1363008 and CHE-1416268), NIH 1R21EB018014, P41 EB015897 and 1R21EB020323, DOD CDMRP W81XWH-15-1-0271 and W81XWH-12-1-0159/BC112431, and Duke University for financial support of this research. This work has been supported by Deutsche Forschungsgemeinschaft (DFG-BL231/47-1), as well as by the European Union and the provinces of Gelderland and Overijssel (NL) through the EFRO Ultrasense NMR project. The authors gratefully acknowledge Magritek for supply of the 1 T 15N-spectrometer and friendly technical assistance.
Footnotes
ASSOCIATED CONTENT
Electronic Supplementary Information (ESI) available: Relaxation time measurements, detailed description of experimental procedures, spectral data, physicochemical reference data for H2O. This material is available free of charge via the Internet at http://pubs.acs.org.
Author Contributions
All authors have given approval to the final version of the manuscript.
References
- 1.Carver TR, Slichter CP. Phys. Rev. 1956;102:975–980. [Google Scholar]
- 2.Cudalbu C, Comment A, Kurdzesau F, van Heeswijk RB, Uffmann K, Jannin S, Denisov V, Kirik D, Gruetter R. Phys. Chem. Chem. Phys. 2010;12:5818–5823. doi: 10.1039/c002309b. [DOI] [PubMed] [Google Scholar]
- 3.Shchepin RV, Coffey AM, Waddell KW, Chekmenev EY. Anal. Chem. 2014;86:5601–5605. doi: 10.1021/ac500952z. [DOI] [PMC free article] [PubMed] [Google Scholar]
- 4.Adams RW, Aguilar JA, Atkinson KD, Cowley MJ, Elliott PIP, Duckett SB, Green GGR, Khazal IG, Lopez-Serrano J, Williamson DC. Science. 2009;323:1708–1711. doi: 10.1126/science.1168877. [DOI] [PubMed] [Google Scholar]
- 5.Bowers CR, Weitekamp DP. Phys. Rev. Lett. 1986;57:2645–2648. doi: 10.1103/PhysRevLett.57.2645. [DOI] [PubMed] [Google Scholar]
- 6.Ben-Amar Baranga A, Appelt S, Romalis MV, Erickson CJ, Young AR, Cates GD, Happer W. Phys. Rev. Lett. 1998;80:2801–2804. [Google Scholar]
- 7.Theis T, Truong ML, Coffey AM, Shchepin RV, Waddell KW, Shi F, Goodson BM, Warren WS, Chekmenev EY. J. Am. Chem. Soc. 2015;137:1404–1407. doi: 10.1021/ja512242d. [DOI] [PMC free article] [PubMed] [Google Scholar]
- 8.Kurhanewicz J, Vigneron DB, Brindle K, Chekmenev EY, Comment A, Cunningham CH, DeBerardinis RJ, Green GG, Leach MO, Rajan SS, Rizi RR, Ross BD, Warren WS, Malloy CR. Neoplasia. 2011;13:81–97. doi: 10.1593/neo.101102. [DOI] [PMC free article] [PubMed] [Google Scholar]
- 9.Nelson SJ, Kurhanewicz J, Vigneron DB, Larson PEZ, Harzstark AL, Ferrone M, van Criekinge M, Chang JW, Bok R, Park I, Reed G, Carvajal L, Small EJ, Munster P, Weinberg VK, Ardenkjaer-Larsen JH, Chen AP, Hurd RE, Odegardstuen LI, Robb FJ, Tropp J, Murray JA. Sci. Transl. Med. 2013;5:198ra108–198ra108. doi: 10.1126/scitranslmed.3006070. [DOI] [PMC free article] [PubMed] [Google Scholar]
- 10.Eshuis N, van Weerdenburg BJA, Feiters MC, Rutjes FPJT, Wijmenga SS, Tessari M. Angew. Chem. Int. Ed. 2015;54:1372–1372. doi: 10.1002/anie.201409795. [DOI] [PubMed] [Google Scholar]
- 11.Eshuis N, Hermkens N, van Weerdenburg BJA, Feiters MC, Rutjes FPJT, Wijmenga SS, Tessari M. J. Am. Chem. Soc. 2014;136:2695–2698. doi: 10.1021/ja412994k. [DOI] [PubMed] [Google Scholar]
- 12.Hövener J-B, Schwaderlapp N, Lickert T, Duckett SB, Mewis RE, Highton LAR, Kenny SM, Green GGR, Leibfritz D, Korvink JG, Hennig J, von Elverfeldt D. Nat. Comm. 2013;4:2946. doi: 10.1038/ncomms3946. [DOI] [PMC free article] [PubMed] [Google Scholar]
- 13.Barskiy DA, Pravdivtsev AN, Ivanov KL, Kovtunov KV, Koptyug IV. Phys. Chem. Chem. Phys. 2015;89:89–93. doi: 10.1039/c5cp05134g. [DOI] [PubMed] [Google Scholar]
- 14.Zeng H, Xu J, Gillen J, McMahon MT, Artemov D, Tyburn J-M, Lohman JAB, Mewis RE, Atkinson KD, Green GGR, Duckett SB, van Zijl PCM. J. Magn. Reson. 2013;237:73–78. doi: 10.1016/j.jmr.2013.09.012. [DOI] [PMC free article] [PubMed] [Google Scholar]
- 15.Cowley MJ, Adams RW, Atkinson KD, Cockett MCR, Duckett SB, Green GGR, Lohman JAB, Kerssebaum R, Kilgour D, Mewis RE. J. Am. Chem. Soc. 2011;133:6134–6137. doi: 10.1021/ja200299u. [DOI] [PMC free article] [PubMed] [Google Scholar]
- 16.Theis T, Truong M, Coffey AM, Chekmenev EY, Warren WS. J. Magn. Reson. 2014;248:23–26. doi: 10.1016/j.jmr.2014.09.005. [DOI] [PMC free article] [PubMed] [Google Scholar]
- 17.Barskiy DA, Shchepin RV, Coffey AM, Theis T, Warren WS, Goodson BM, Chekmenev EY. J. Am. Chem. Soc. 2016;138:8080–8083. doi: 10.1021/jacs.6b04784. [DOI] [PMC free article] [PubMed] [Google Scholar]
- 18.Nikolaou P, Goodson BM, Chekmenev EY. Chem. Eur. J. 2015;21:3156–3166. doi: 10.1002/chem.201405253. [DOI] [PMC free article] [PubMed] [Google Scholar]
- 19.Shchepin RV, Barskiy DA, Coffey AM, Theis T, Shi F, Warren WS, Goodson BM, Chekmenev EY. ACS Sensors. 2016;1:640–644. doi: 10.1021/acssensors.6b00231. [DOI] [PMC free article] [PubMed] [Google Scholar]
- 20.Shchepin RV, Chekmenev EY. J. Label. Compd. Rad. 2014;57:621–624. doi: 10.1002/jlcr.3220. [DOI] [PMC free article] [PubMed] [Google Scholar]
- 21.Spannring P, Reile I, Emondts M, Schleker PPM, Hermkens NKJ, van der Zwaluw NGJ, van Weerdenburg BJA, Tinnemans P, Tessari M, Blümich B, Rutjes FPJT, Feiters MC. Chem. Eur. J. 2016;22:9277–9282. doi: 10.1002/chem.201601211. [DOI] [PMC free article] [PubMed] [Google Scholar]
- 22.Truong ML, Shi F, He P, Yuan B, Plunkett KN, Coffey AM, Shchepin RV, Barskiy DA, Kovtunov KV, Koptyug IV, Waddell KW, Goodson BM, Chekmenev EY. J. Phys. Chem. B. 2014;18:13882–13889. doi: 10.1021/jp510825b. [DOI] [PMC free article] [PubMed] [Google Scholar]
- 23.Fekete M, Bayfield O, Duckett SB, Hart S, Mewis RE, Pridmore N, Rayner PJ, Whitwood A. Inorg. Chem. 2013;52:13453–13461. doi: 10.1021/ic401783c. [DOI] [PMC free article] [PubMed] [Google Scholar]
- 24.Rovedo P, Knecht S, Bäumlisberger T, Cremer AL, Duckett SB, Mewis RE, Green GGR, Burns MJ, Rayner PJ, Leibfritz D, Korvink JG, Hennig J, Pütz G, von Elverfeldt D, Hövener J-B. J. Phys. Chem. B. 2016;120:5670–5677. doi: 10.1021/acs.jpcb.6b02830. [DOI] [PubMed] [Google Scholar]
- 25.Barskiy DA, Pravdivtsev AN, Ivanov KL, Kovtunov KV, Koptyug IV. Simple analytical model for Signal Amplification by Reversible Exchange (SABRE) process. Phys. Chem. Chem. Phys. 2015;18:89–93. doi: 10.1039/c5cp05134g. [DOI] [PubMed] [Google Scholar]
- 26.Colell JFP, Logan AWJ, Zhou Z, Shchepin RV, Barskiy DA, Ortiz GX, Wang Q, Malcolmson SJ, Chekmenev EY, Warren WS, Theis T. The Journal of Physical Chemistry C, Article ASAP. 2017 doi: 10.1021/acs.jpcc.6b12097. [DOI] [PMC free article] [PubMed] [Google Scholar]
- 27.Fleming FF, Yao L, Ravikumar PC, Funk L, Shook BC. J. Med. Chem. 2010;53:7902–7917. doi: 10.1021/jm100762r. [DOI] [PMC free article] [PubMed] [Google Scholar]
- 28.Mewis RE, Green RA, Cockett MCR, Cowley MJ, Duckett SB, Green GGR, John RO, Rayner PJ, Williamson DC. J. Phys. Chem. B. 2015;119:1416–1424. doi: 10.1021/jp511492q. [DOI] [PMC free article] [PubMed] [Google Scholar]
- 29.Dubinsky L, Krom BP, Meijler MM. Bioorg. Med. Chem. 2012;20:554–570. doi: 10.1016/j.bmc.2011.06.066. [DOI] [PubMed] [Google Scholar]
- 30.Roy SS, Norcott P, Rayner PJ, Green GGR, Duckett SB. Angew. Chem. Int. Ed. 2016;55:15642–15645. doi: 10.1002/anie.201609186. [DOI] [PMC free article] [PubMed] [Google Scholar]
- 31.Abragam A. The principles of nuclear magnetism. Oxford: Clarendon Press; 1961. [Google Scholar]
- 32.Halbach K. Nucl. Instr. Meth. 1980;169:1–10. [Google Scholar]
- 33.Crozier TE, Yamamoto S. J. Chem. Eng. Data. 1974;19:242–244. [Google Scholar]
- 34.Brunner E. J. Chem. Eng. Data. 1985;30:269–273. [Google Scholar]
- 35.Knecht S, Pravdivtsev AN, Hövener J-B, Yurkovskaya AV, Ivanov KL. RSC. Adv. 2016;6:24470–24477. [Google Scholar]
- 36.Truong ML, Theis T, Coffey AM, Shchepin RV, Waddell KW, Shi F, Goodson BM, Warren WS, Chekmenev EY. J. Phys. Chem. C. 2015;119:8786–8797. doi: 10.1021/acs.jpcc.5b01799. [DOI] [PMC free article] [PubMed] [Google Scholar]
- 37.Shchepin RV, Truong ML, Theis T, Coffey AM, Shi F, Waddell KW, Warren WS, Goodson BM, Chekmenev EY. J. Phys. Chem. Lett. 2015;6:1961–1967. doi: 10.1021/acs.jpclett.5b00782. [DOI] [PMC free article] [PubMed] [Google Scholar]
- 38.Appleby KM, Mewis RE, Olaru AM, Green GGR, Fairlamb IJS, Duckett SB. Chem. Sci. 2015;6:3981–3993. doi: 10.1039/c5sc00756a. [DOI] [PMC free article] [PubMed] [Google Scholar]
- 39.Shchepin RV, Barskiy DA, Mikhaylov DM, Chekmenev EY. Bioconjugate Chem. 2016;27:878–882. doi: 10.1021/acs.bioconjchem.6b00148. [DOI] [PMC free article] [PubMed] [Google Scholar]
- 40.Wang H, Lanks KW. Cancer Research. 1986;46:5349–5352. [PubMed] [Google Scholar]
- 41.Olaru AM, Burns MJ, Green GGR, Duckett SB. Chem. Sci. 2016;8:2257–2266. doi: 10.1039/c6sc04043h. [DOI] [PMC free article] [PubMed] [Google Scholar]
- 42.Sarracanie M, LaPierre CD, Salameh N, Waddington DEJ, Witzel T, Rosen MS. Sci. Rep. 2015;5:15177. doi: 10.1038/srep15177. [DOI] [PMC free article] [PubMed] [Google Scholar]
- 43.Danieli E, Mauler J, Perlo J, Blümich B, Casanova F. J. Magn. Reson. 2009;198:80–87. doi: 10.1016/j.jmr.2009.01.022. [DOI] [PubMed] [Google Scholar]
- 44.Hoult DI, Richards RE. J. Magn. Reson. 1976;24:71–85. doi: 10.1016/j.jmr.2011.09.018. [DOI] [PubMed] [Google Scholar]
- 45.Hoult DI, Lauterbur PC. J. Magn. Reson. 1979;34:425–433. [Google Scholar]
- 46.Hoult DI. eMagRes. John Wiley & Sons, Ltd; 2007. Sensitivity of the NMR Experiment. [Google Scholar]
- 47.Hoult DI. Enc. Magn. Reson. 2007 doi: 10.1002/9780470034590.emrstm0491. [DOI] [Google Scholar]
- 48.Hoult DI, Richards RE. J. Magn. Reson. 1976;24:71–85. doi: 10.1016/j.jmr.2011.09.018. [DOI] [PubMed] [Google Scholar]
- 49.Minard KR, Wind RA. Concepts Magn. Reson. 2001;13:190–210. [Google Scholar]
- 50.Danieli E, Perlo J, Blümich B, Casanova F. Physical Review Letters. 2013;110 doi: 10.1103/PhysRevLett.110.180801. 180801-1-5. [DOI] [PubMed] [Google Scholar]
- 51.Suefke M, Liebisch A, Blumich B, Appelt S. Nat. Phys. 2015;11:767–771. [Google Scholar]
- 52.Coffey AM, Truong M, Chekmenev EY. J. Magn. Reson. 2013;237:169–174. doi: 10.1016/j.jmr.2013.10.013. [DOI] [PMC free article] [PubMed] [Google Scholar]
- 53.Theis T, Ortiz GX, Logan AWJ, Claytor KE, Feng Y, Huhn WP, Blum V, Malcolmson SJ, Chekmenev EY, Wang Q, Warren WS. Sci. Adv. 2016;2:e1501438–e1501438. doi: 10.1126/sciadv.1501438. [DOI] [PMC free article] [PubMed] [Google Scholar]
- 54.Nelson SJ, Kurhanewicz J, Vigneron DB, Larson PE, Harzstark AL, Ferrone M, van Criekinge M, Chang JW, Bok R, Park I, Reed G, Carvajal L, Small EJ, Munster P, Weinberg VK, Ardenkjaer-Larsen JH, Chen AP, Hurd RE, Odegardstuen LI, Robb FJ, Tropp J, Murray JA. Sci. Transl. Med. 2013;5:198ra108. doi: 10.1126/scitranslmed.3006070. [DOI] [PMC free article] [PubMed] [Google Scholar]
- 55.Sriram R, Van Criekinge M, Hansen A, Wang ZJ, Vigneron DB, Wilson DM, Keshari KR, Kurhanewicz J. NMR Biomed. 2015;28:1141–1149. doi: 10.1002/nbm.3354. [DOI] [PMC free article] [PubMed] [Google Scholar]
- 56.Keshari KR, Sriram R, Van Criekinge M, Wilson DM, Wang ZJ, Vigneron DB, Peehl DM, Kurhanewicz J. The Prostate. 2013;73:1171–1181. doi: 10.1002/pros.22665. [DOI] [PMC free article] [PubMed] [Google Scholar]
- 57.Rodrigues TB, Serrao EM, Kennedy BWC, Hu D-E, Kettunen MI, Brindle KM. Nat. Med. 2013;20:93–97. doi: 10.1038/nm.3416. [DOI] [PMC free article] [PubMed] [Google Scholar]
- 58.Reile I, Eshuis N, Hermkens NKJ, van Weerdenburg BJA, Feiters MC, Rutjes FPJT, Tessari M. The Analyst. 2016;141:4001–4005. doi: 10.1039/c6an00804f. [DOI] [PubMed] [Google Scholar]
Associated Data
This section collects any data citations, data availability statements, or supplementary materials included in this article.


