

Abstract
Objective
To compare morbidity among small-for-gestational-age (SGA; birthweight [BW] < 10th percentile for gestational age), appropriate-for-gestational-age (AGA; BW 10-90th percentile; reference group), and large-for-gestational-age (LGA; BW > 90th percentile) neonates in apparently uncomplicated pregnancies at term (≥ 37 weeks).
Material and Methods
This secondary analysis, derived from an observational obstetric cohort of 115,502 deliveries, included women with apparently uncomplicated pregnancies of non-anomalous singletons who had confirmatory ultrasound dating no later than the second trimester, and who delivered between 370 and 426 weeks. We used two different composite neonatal morbidity outcomes: hypoxic composite neonatal morbidity for SGA and traumatic composite neonatal morbidity for LGA neonates. Log Poisson relative risks (aRR) with 95% confidence intervals (CI), adjusted for potential confounding factors (nulliparity, body mass index, insurance status, and neonatal sex) were calculated.
Results
Among the 63,436 women who met our inclusion criteria, SGA occurred in 7.9% (n=4,983) and LGA in 8.3% (n=5,253). Hypoxic composite neonatal morbidity was significantly higher in SGA (1.1%) vs. AGA (0.7%; aRR 1.44, 95% CI 1.07-1.93) but similar between LGA (0.6%) vs. AGA (aRR 0.84; 95% CI 0.58-1.22). Traumatic composite neonatal morbidity was significantly higher in LGA (1.9%) vs. AGA (1.0%; aRR 1.88, 95% CI 1.51-2.34)) but similar in SGA (1.3%) vs. AGA (aRR 1.28; 95% CI 0.98-1.67).
Conclusions
Among women with uncomplicated pregnancies, hypoxic composite neonatal morbidity is more common with SGA neonates and traumatic–composite neonatal morbidity is more common with LGA neonates.
Introduction
Small for gestational age (SGA) or large for gestational age (LGA) occurs in about 20% of pregnant women and are associated with adverse outcomes (1). Newborns who are SGA (i.e., birthweight [BW] < 10th percentile), compared to those who are appropriate-for-gestational-age (AGA; BW at 10-90th percentile), are at increased risk for stillbirth, seizures, sepsis, intraventricular hemorrhage, necrotizing enterocolitis, hypoxic ischemic encephalopathy and neonatal mortality (2). Newborns who are LGA (i.e., BW > 90th percentile), are at increased risk of stillbirth, traumatic delivery, mechanical ventilation, brachial plexus palsy and neonatal mortality (1, 3,4)
The frequency of aberrant fetal growth is higher in women with complications of pregnancy. SGA, for example, occurs in 17 to 32% of women with hypertensive diseases and LGA occurs in 24 to 39% of women with diabetes. Additionally, neonatal morbidity is higher in these populations when aberrant growth occurs (5-9). Conversely, although women without apparent pregnancy complications also have newborns with aberrant growth, there are a paucity of data detailing whether these neonates are at increased risk of neonatal morbidity. Resolving this evidence gap has implications with regard to understanding whether sonographic screening for fetal growth among women with uncomplicated pregnancies has the potential to decrease a clinically-significant portion of neonatal morbidity.
Correspondingly, the objective of this analysis was to compare the neonatal morbidity among SGA, AGA, and LGA neonates in women without medical or obstetric complications at term (37 weeks or more). We hypothesized that, compared to AGA neonates, those born SGA would be more likely to have hypoxic morbidity and those born LGA would be more likely to have traumatic morbidity.
Materials and Methods
This is a secondary analysis of an observational obstetric cohort (Assessment of Perinatal Excellence) of women and their neonates born in 25 geographically-dispersed medical centers of the Eunice Kennedy Shriver National Institute of Child Health and Human Development Maternal-Fetal Medicine Units Network. Maternal demographics, peripartum outcomes, and neonatal morbidities were collected on all women who had a live fetus on admission and delivered a newborn of at least 23 weeks of gestation on randomly selected days representing one third of deliveries over a 3-year period. Data from all charts were abstracted by certified research personnel. Neonatal data were collected until discharge, death or until 120 days of age, whichever came first. Several steps were undertaken to ensure data quality. First, prior to selecting final data collection fields, we conducted a two-week pilot study to evaluate the data collection process, quality of the data, and frequency of missing data. The final data collection fields were based on the information gathered during this pilot phase. During the data collection process, all data were subjected to ongoing data edits to ensure accuracy. The study was approved by the institutional review board at each participating center under a waiver of informed consent. Full details on study methods and the technique of data collection have been previously published. (10)
Women were included in this secondary analysis if they delivered non-anomalous singletons between 370 and 426 weeks of gestational and had a pregnancy that had been dated by last menstrual period and first or second trimester ultrasound, first or second trimester ultrasound alone, or assisted reproductive technology. A pregnancy was considered complicated if a woman had any of the following: diabetes (pregestational or gestational), chronic hypertension, history of deep venous thrombus or pulmonary embolism, non-obstetric co-morbidity (e.g., cardiac disease), thrombophilia, anticoagulant use, placenta previa, placental abruption, or – at admission for delivery – deep venous thrombosis, asthma exacerbation at delivery, or hypertensive disease of pregnancy (gestational hypertension, preeclampsia, or eclampsia). In the absence of these conditions, women were considered to have apparently uncomplicated pregnancies. Furthermore, a post-hoc sensitivity analysis was conducted excluding women with a diagnosis of suspected intrauterine growth restriction or non-reassuring fetal status at the time of admission.
Size for gestational age was estimated per methods of Alexander et al (11, and personal communication) using neonatal gestational age at delivery, birthweight and sex and maternal race/ethnicity to categorize newborns into three groups: SGA (birthweight less than 10th percentile for gestational age), AGA (birthweight 10th to 90th percentile for gestational age; reference group), and LGA (birthweight greater than 90th percentile for gestational age).
The primary outcome for SGA was a composite neonatal morbidity (CNM) potentially related to hypoxic events and included any of the following: Apgar score < 5 at 5 min, seizure, bronchopulmonary dysplasia, persistent pulmonary hypertension of the newborn, culture proven sepsis, cardiopulmonary resuscitation within the first 24 hours, hypoxic ischemic encephalopathy (HIE), grade III or IV intraventricular hemorrhage grade (IVH), grade II or III necrotizing enterocolitis, ventilator support within 24 hours, or death before discharge. The primary outcome for LGA newborns, was a CNM potentially related to traumatic events and included any of the following: Apgar score < 5 at 5 min, seizure, cardiopulmonary resuscitation within the first 24 hours, ventilator support within 24 hours, hypoxic ischemic encephalopathy, osseous fracture, intracranial hemorrhage other than IVH, brachial plexus palsy, facial nerve palsy, or death before discharge.
Comparative analyses of aberrant growth category (SGA, AGA, LGA) were performed with the chi-square test or Fisher’s exact test for categorical variables and the Wilcoxon rank sum test for continuous variables. Log Poisson relative risks (aRR) with 95% confidence intervals (CI), adjusted for potential confounding factors (nulliparity, body mass index, insurance status, and neonatal sex), were calculated. SAS software version 9.2 was used for the analyses. All tests were two-tailed and p<.05 was used to define statistical significance. No imputation for missing data was performed.
Results
Of the 115, 502 women in the APEX study, 63,436 (55%) had uncomplicated pregnancies at term and were eligible for this analysis (Fig 1). Among these women, 7.9% (N=4,983) had an SGA neonate and 8.3% (N=5,253) had an LGA neonate.
Fig 1.
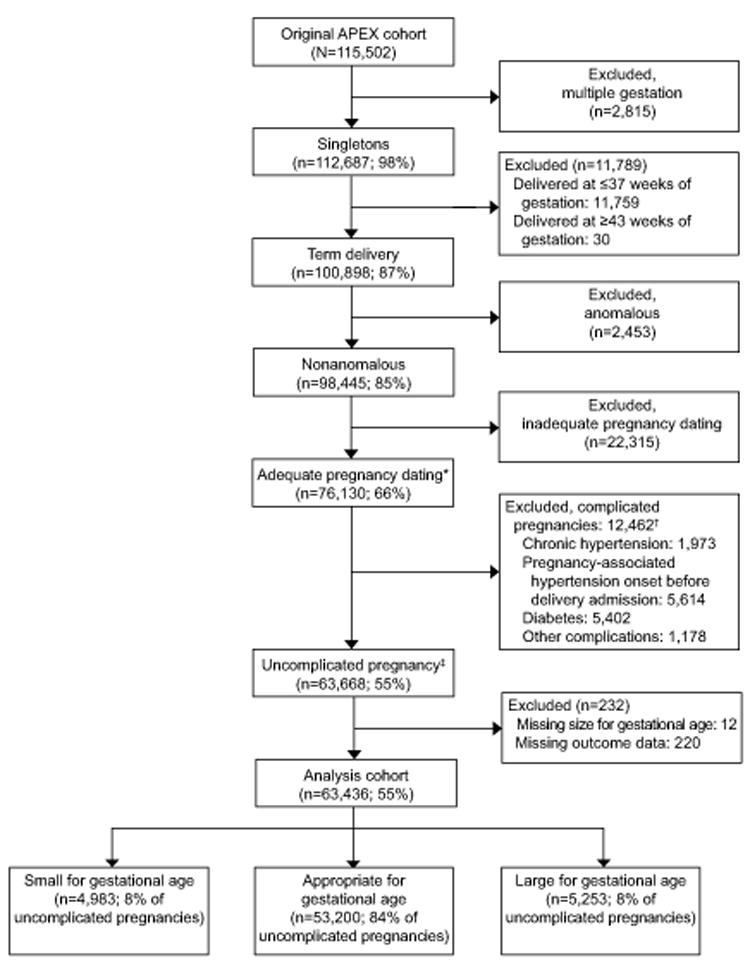
Analysis cohort inclusion. APEX, Assessment of Perinatal Excellence. *Adequate pregnancy dating was defined as a pregnancy dated by last menstrual period and first- or second-trimester ultrasonogram, first- or second-trimester ultrasonogram alone, or assisted reproductive technology. †Categories not mutually exclusive. ‡A pregnancy was considered complicated if the woman had any of the following: diabetes (pregestational or gestational), chronic hypertension, history of deep venous thrombus or pulmonary embolism, hypertensive disease of pregnancy (gestational hypertension or preeclampsia) with an onset before delivery hospital admission, thrombophilia excluding MTHFR, anticoagulant use, previa, or any of the following as a reason for delivery hospital admission: vaginal bleeding or abruption, deep venous thrombus, asthma exacerbation, seizures, or other nonobstetric maternal medical condition. In absence of these conditions, a woman was considered to have an uncomplicated pregnancy.
Several maternal characteristics differed significantly based on whether a woman had an SGA, AGA, or LGA neonate. Maternal age, race, ethnicity, cigarette use, cocaine or methamphetamine use, and body mass index at delivery differed for women who delivered an AGA newborn compared to those with aberrant growth (Table 1). Similarly, the gestational age at delivery differed significantly among groups. About 29% of women with an SGA neonate and 42% of women with an LGA neonate delivered at 40 weeks or later. The frequency of cesarean delivery did not differ between those with SGA versus AGA neonates, but was significantly different for women with LGA and AGA neonates (Table 2).
Table 1.
Maternal characteristics
| SGA (N=4,983) | AGA (N=53,200) | LGA (n=5,253) | SGA vs. AGA P* | LGA vs. AGA P* | |
|---|---|---|---|---|---|
| Maternal age (years) | 27 (22-31) | 28 (23-32) | 29 (25-33) | <.001 | <.001 |
| Maternal age categories (years) | <.001 | <.001 | |||
| <20 | 627 (12.6) | 4756 (8.9) | 236 (4.5) | ||
| 20-24.9 | 1318 (26.5) | 11841 (22.3) | 911 (17.3) | ||
| 25-29.9 | 1331 (26.7) | 15007 (28.2) | 1512 (28.8) | ||
| 30-34.9 | 1104 (22.2) | 13922 (26.2) | 1564 (29.8) | ||
| ≥35 | 603 (12.1) | 7674 (14.4) | 1030 (19.6) | ||
| Race / ethnicity | .001 | <.001 | |||
| Non-Hispanic black / African-American | 876 (17.6) | 9882 (18.6) | 924 (17.6) | ||
| Non-Hispanic white | 2387 (47.9) | 24674 (46.4) | 2415 (46.0) | ||
| Non-Hispanic Asian | 307 (6.2) | 2705 (5.1) | 194 (3.7) | ||
| Hispanic / Latino | 1197 (24.0) | 13372 (25.1) | 1448 (27.6) | ||
| Other | 180 (3.6) | 2083 (3.9) | 218 (4.2) | ||
| Not documented | 36 (0.7) | 484 (0.9) | 54 (1.0) | ||
| Primary source of medical care payment† | <.001 | <.001 | |||
| Private insurance | 2231 (45.1) | 27154 (51.4) | 2771 (53.1) | ||
| Government assisted insurance | 2240 (45.3) | 19897 (37.6) | 1811 (34.7) | ||
| Uninsured or self-pay | 476 (9.6) | 5809 (11.0) | 634 (12.2) | ||
| Obstetric history | <.001 | <.001 | |||
| Nulliparous | 2506 (50.3) | 21231 (39.9) | 1497 (28.5) | ||
| Prior vaginal delivery only | 1834 (36.8) | 23865 (44.9) | 2667 (50.8) | ||
| Prior vaginal and cesarean delivery | 334 (6.7) | 4057 (7.6) | 558 (10.6) | ||
| Prior cesarean delivery only | 309 (6.2) | 4042 (7.6) | 530 (10.1) | ||
| Prenatal care (≥ 2 visits)† | 4792 (99.1) | 51408 (99.4) | 5092 (99.6) | .02 | .13 |
| Cigarette use | 837 (16.8) | 4441 (8.4) | 289 (5.5) | <.001 | <.001 |
| Alcohol | 201 (4.0) | 1628 (3.1) | 149 (2.8) | <.001 | .36 |
| Cocaine or methamphetamine | 53 (1.1) | 236 (0.4) | 13 (0.3) | <.001 | .04 |
| BMI at delivery (kg/m2)† | 27.8 (25.1-31.6) | 29.6 (26.6-33.4) | 32.6 (29.1-36.8) | <.001 | <.001 |
| BMI at delivery categories (kg/m2)† | <.001 | <.001 | |||
| <25 | 1195 (24.4) | 6686 (12.8) | 203 (4.0) | ||
| 25-29.9 | 2005 (41.0) | 20909 (40.0) | 1391 (27.0) | ||
| 30-34.5 | 1094 (22.4) | 15195 (29.1) | 1780 (34.6) | ||
| 35-39.9 | 375 (7.7) | 6136 (11.8) | 1054 (20.5) | ||
| ≥40 | 222 (4.5) | 3307 (6.3) | 716 (13.9) | ||
| Transferred from another hospital | 11 (0.2) | 159 (0.3) | 11 (0.2) | .33 | .25 |
| Male fetal sex | 2551 (51.2) | 26766 (50.3) | 2674 (50.9) | .23 | .41 |
Data presented are n (%) or median (interquartile range)
SGA, small for gestational age (birth weight < 10% for gestational age); AGA, appropriate for gestational age (birth weight between 10-89% for gestational age); LGA, large for gestational age (birth weight > 90% for GA); BMI, body mass index
based on the chi-square test for categorical variables or Wilcoxon rank sum test for continuous variables
number of missing values: insurance (413); prenatal care (1771); BMI (1168)
Table 2.
Intrapartum characteristics
| SGA (N=4,983) | AGA (N=53,200) | LGA (n=5,253) | SGA vs. AGA P* | LGA vs. AGA P* | |
|---|---|---|---|---|---|
| Reason for hospital admissio | <.001 | † | |||
| Delivery | 4915 (98.6) | 52811 (99.3) | 5220 (99.4) | ||
| Evaluation, observation, or treatment for intrauterine growth restriction | 12 (0.2) | 4 (0.0) | 0 (0.0) | ||
| Evaluation, observation, or treatment for non-reassuring fetal status | 24 (0.5) | 172 (0.3) | 15 (0.3) | ||
| Evaluation, observation, or treatment for other reasons | 32 (0.6) | 213 (0.4) | 18 (0.3) | ||
| Reason for labor and delivery admission | <.001 | † | |||
| Intrauterine growth restriction | 46 (0.9) | 18 (0.0) | 0 (0.0) | ||
| Non-reassuring fetal status | 67 (1.3) | 348 (0.7) | 33 (0.6) | ||
| Other reasons | 4870 (97.7) | 52834 (99.3) | 5220 (99.4) | ||
| Presentation | <.001 | .008 | |||
| Vertex | 4761 (95.7) | 51601 (97.2) | 5081 (97.0) | ||
| Breech | 192 (3.9) | 1304 (2.5) | 127 (2.4) | ||
| Non-breech malpresentation | 21 (0.4) | 181 (0.3) | 32 (0.6) | ||
| PROM | 464 (9.3) | 4711 (8.9) | 358 (6.8) | .28 | <.001 |
| Type of labor | <.001 | <.001 | |||
| None (cesarean without labor or induction) | 549 (11.0) | 6435 (12.1) | 1035 (19.7) | ||
| Spontaneous | 1717 (34.5) | 18323 (34.4) | 1510 (28.8) | ||
| Spontaneous, augmented | 1263 (25.4) | 15171 (28.5) | 1290 (24.6) | ||
| Induced | 1454 (29.2) | 13270 (24.9) | 1418 (27.0) | ||
| Reason for induction | † | † | |||
| Not induced | 3529 (70.8) | 39930 (75.1) | 3835 (73.0) | ||
| Intrauterine growth restriction | 384 (7.7) | 150 (0.3) | 0 (0.0) | ||
| Non-reassuring fetal status | 88 (1.8) | 650 (1.2) | 51 (1.0) | ||
| Macrosomia | 0 (0.0) | 138 (0.3) | 109 (2.1) | ||
| Other reasons | 982 (19.7) | 12332 (23.2) | 1258 (24.0) | ||
| Suspected chorioamnionitis | 147 (3.0) | 2247 (4.2) | 263 (5.0) | <.001 | .008 |
| Antibiotics for chorioamnionitis | 115 (2.3) | 1868 (3.5) | 223 (4.3) | <.001 | .006 |
| Abruption | 8 (0.2) | 70 (0.1) | 5 (0.1) | .59 | .48 |
| Cesarean delivery | 1290 (25.9) | 13603 (25.6) | 2016 (38.4) | .62 | <.001 |
| Reason for cesarean | † | <.001 | |||
| Not delivered via cesarean | 3693 (74.1) | 39597 (74.4) | 3237 (61.6) | ||
| Non-reassuring fetal status | 403 (8.1) | 2031 (3.8) | 174 (3.3) | ||
| Macrosomia | 0 (0.0) | 128 (0.2) | 181 (3.5) | ||
| Other reasons | 887 (17.8) | 11444 (21.5) | 1661 (31.6) | ||
| Received anesthesia of any kind | 4486 (90.0) | 47846 (89.9) | 4835 (92.0) | .84 | <.001 |
| Received regional epidural anesthesia | 3469 (77.3) | 36759 (76.8) | 3359 (69.5) | .45 | <.001 |
| Received regional spinal anesthesia | 1260 (28.1) | 13797 (28.8) | 1736 (35.9) | .29 | <.001 |
| Received general anesthesia | 93 (2.1) | 452 (0.9) | 56 (1.2) | <.001 | .15 |
| Gestational age (weeks) | 39.3 (38.4-40.0) | 39.4 (38.9-40.3) | 39.7 (39.1-40.6) | <.001 | <.001 |
| Gestational age categories (weeks) | <.001 | <.001 | |||
| 37,0-37,6 weeks | 589 (11.8) | 4124 (7.8) | 183 (3.5) | ||
| 38,0-38,6 weeks | 1079 (21.7) | 9679 (18.2) | 747 (14.2) | ||
| 39,0-39.6 weeks | 1889 (37.9) | 20109 (37.8) | 2109 (40.2) | ||
| 40,0-40.6 weeks | 1077 (21.6) | 13663 (25.7) | 1480 (28.2) | ||
| 41,0-41.6 weeks | 334 (6.7) | 5320 (10.0) | 677 (12.9) | ||
| 42,0-42.6 weeks | 15 (0.3) | 305 (0.6) | 57 (1.1) | ||
| Birthweight (g) | 2683 (2515-2822) | 3379 (3146-3630) | 4189 (4045-4363) | <.001 | <.001 |
| Birthweight (g) | † | † | |||
| <2500 | 1136 (22.8) | 50 (0.1) | 0 (0.0) | ||
| 2500-3999 | 3847 (77.2) | 51688 (97.2) | 952 (18.1) | ||
| ≥4000 | 0 (0.00) | 1462 (2.8) | 4301 (81.9) |
Data presented are n (%) or median (interquartile range)
SGA, small for gestational age (birth weight < 10% for gestational age); AGA, appropriate for gestational age (birth weight between 10-89% for gestational age); LGA, large for gestational age (birth weight > 90% for GA); NA, not applicable
based on the chi-square test for categorical variables or Wilcoxon rank sum test for continuous variables
not computed due to zero cells; some cells not applicable to SGA or LGA
The absolute frequencies of CNM were less than 2% for the three groups of newborns (Table 3). The three most common morbidities among SGA neonates were ventilator support within 24 hours of birth (0.5%), Apgar score <5 at 5 min (0.4%) and HIE (0.4%). For LGA neonates, the three most common morbidities were fracture (1.0%), brachial plexus palsy (0.4%) and ventilator support (0.3%). Hypoxic CNM was higher in SGA neonates than in AGA neonates, and traumatic CNM was higher in LGA neonates than in AGA neonates (Table 3). After adjusting for confounding factors, the significant differences among groups remained: hypoxic CNM was 44% higher in neonates with SGA than in those with AGA, and traumatic CNM was 88% higher in neonates with LGA than in those with AGA (Table 4). Other factors associated with the CNM outcomes that were studied included nulliparity, male gender and BMI at delivery (Table 4). Private insurance was associated with a lower frequency of the traumatic CNM outcome. The results were similar after women with a diagnosis of intrauterine growth restriction or non-reassuring fetal status at the time of admission were excluded from analysis (Table 5).
Table 3.
Hypoxic and traumatic neonatal morbidity and growth
| SGA (N=4,983) | AGA N=53,200) | LGA (N=5,253) | |||||
|---|---|---|---|---|---|---|---|
| n (%) | uRR* (95% CI) | aRR† (95% CI) | n (%) | n (%) | uRR* (95% CI) | aRR† (95% CI) | |
| Hypoxic composite neonatal morbidity | 55 (1.1) | 1.57 (1.18-2.08)‡ | 1.44 (1.07-1.93)§ | 374 (0.7) | 31 (0.6) | 0.84 (0.58-1.21) | 0.84 (0.58-1.22) |
| Traumatic composite neonatal morbidity | 65 (1.3) | 1.33 (1.03-1.72)║ | 1.28 (0.98-1.67) | 523 (1.0) | 102 (1.9) | 1.98 (1.60-2.44)¶ | 1.88 (1.51-2.34)¶ |
| Bronchopulmonary dysplasia H | 0 (0.0) | 2 (0.0) | 1 (0.0) | ||||
| Persistent pulmonary hypertension of the newborn H | 11 (0.2) | 36 (0.1) | 9 (0.2) | ||||
| Proven newborn sepsis H | 6 (0.1) | 44 (0.1) | 5 (0.1) | ||||
| Necrotizing enterocolitis stage II or III H | 0 (0.0) | 3 (0.0) | 0 (0.0) | ||||
| Intraventricular hemorrhage grade (IVH) III or IV H | 0 (0.0) | 1 (0.0) | 0 (0.0) | ||||
| Apgar score < 5 at 5 min H, T | 19 (0.4) | 93 (0.2) | 6 (0.1) | ||||
| Ventilator support within 24 hrs. H, T | 25 (0.5) | 191 (0.4) | 16 (0.3) | ||||
| Seizure H, T | 7 (0.1) | 39 (0.1) | 3 (0.1) | ||||
| Cardiopulmonary resuscitation within first 24 hrs. H, T | 7 (0.1) | 30 (0.1) | 2 (0.0) | ||||
| Hypoxic ischemic encephalopathy H, T | 20 (0.4) | 92 (0.2) | 9 (0.2) | ||||
| Death before discharge H, T | 3 (0.1) | 7 (0.0) | 2 (0.0) | ||||
| Fracture (skull, depressed skull, clavicle, other) T | 6 (0.1) | 135 (0.3) | 54 (1.0) | ||||
| Intracranial hemorrhage (other than IVH) T | 7 (0.1) | 70 (0.1) | 4 (0.1) | ||||
| Brachial plexus injury T | 1 (0.0) | 24 (0.1) | 19 (0.4) | ||||
| Facial nerve palsy T | 3 (0.1) | 5 (0.0) | 2 (0.0) | ||||
Data as n (%)
SGA, small for gestational age; AGA, appropriate gestational age; LGA, large for gestational age; aRR, adjusted relative risk; CI, confidence interval
—a component of hypoxic CNM;
—a component of traumatic CNM
Compared with AGA and unadjusted
Compared with AGA and adjusted for insurance status, nulliparity, body mass index, and male fetal sex; number with complete data in the multivariable model is 61905
P=.002
P=.02
P=.03
P<.001
Table 4.
Full multivariable models for hypoxic and traumatic neonatal morbidity and growth
| Hypoxic CNM | Traumatic CNM | |||
|---|---|---|---|---|
| aRR* (95% CI) | P | aRR* (95% CI) | P | |
| SGA | 1.44 (1.07-1.93) | .02 | 1.28 (0.98-1.67) | .07 |
| LGA | 0.84 (0.58-1.22) | .37 | 1.88 (1.51-2.34) | <.001 |
| Private insurance | 0.85 (0.70-1.02) | .08 | 0.70 (0.60-0.82) | <.001 |
| Nulliparous | 2.18 (1.81-2.64) | <.001 | 1.59 (1.36-1.85) | <.001 |
| Male fetal sex | 1.50 (1.24-1.81) | <.001 | 1.28 (1.10-1.49) | .001 |
| BMI, per unit increase in kg/m2 | 1.04 (1.02-1.05) | <.001 | 1.03 (1.02-1.05) | <.001 |
SGA, small for gestational age; AGA, appropriate gestational age; LGA, large for gestational age; aRR, adjusted relative risk; CI, confidence interval; BMI, body mass index (at delivery)
adjusted for all variables in the table; number with complete data in the multivariable model is 61905
Table 5.
Sensitivity analysis evaluating hypoxic and traumatic neonatal morbidity and growth after excluding women with a diagnosis of intrauterine growth restriction or non-reassuring fetal status at the time of admission
| SGA (N=4,852) | AGA N=52,739) | LGA (N=5,213) | |||||
|---|---|---|---|---|---|---|---|
| n (%) | uRR* (95% CI) | aRR* (95% CI) | n (%) | n (%) | uRR* (95% CI) | aRR* (95% CI) | |
| Hypoxic composite neonatal morbidity | 51 (1.1) | 1.55 (1.15-2.08)‡ | 1.40 (1.03-1.90)§ | 358 (0.7) | 31 (0.6) | 0.88 (0.61-1.26) | 0.89 (0.62-1.29) |
| Traumatic composite neonatal morbidity | 62 (1.3) | 1.33 (1.02-1.73)║ | 1.27 (0.97-1.67) | 507 (1.0) | 102 (2.0) | 2.04 (1.65-2.52)¶ | 1.94 (1.56-2.42)¶ |
Compared with AGA and unadjusted
Compared with AGA and adjusted for insurance status, nulliparity, body mass index, and male fetal sex; number with complete data in the multivariable model is 61290
P=.004
P=.03
P=.03
P<.001
Discussion
Our analysis demonstrates that even among women who have an otherwise uncomplicated term pregnancies, hypoxic CNM and traumatic CNM were significantly increased among SGA (1.1%) and LGA (1.9%) neonates, respectively. Specifically, compared to AGA neonates, those who were SGA had a 44% higher risk of hypoxic CNM and those who were LGA had an 88% higher risk of traumatic CNM. Though the CNM, as defined, occurred in less than 2% of newborns with aberrant growth, two points are worth noting. First, adverse outcomes included in the composite are severe with the potential for long-term sequelae. Second, the size of the population at risk for these adverse neonatal outcomes is large with approximately 470,000 SGA and LGA neonates born annually in the United States (12) among women with uncomplicated pregnancies.
This report differs from prior studies on the extremes of fetal growth in that these studies included a general obstetric population (2, 4) or women with comorbidities like hypertensive disease (5-7) or diabetes (8-9). In contrast, our study population was limited to women with uncomplicated pregnancies who delivered at term. Also, unlike most prior reports on abnormal growth, we simultaneously evaluated the outcomes of SGA and LGA neonates in one study population. Additionally, unlike prior publications (13), we were able to define a study group of women with uncomplicated pregnancies that excluded those with a wide variety of potential complicating factors. The criteria for gestational age were based on established criteria, and thus ascertainment of abnormal growth more reliable than that of prior publications that used birth certificate datasets (1).
The limitations of the analysis should be acknowledged. Our analysis was based on the actual birthweight, which is unknowable with exactitude (14) and is not helpful to clinicians managing pregnancy. Though we excluded several conditions that constitute high-risk pregnancies, some unrecognized complications (e.g. thrombophilia) was potentially present in these apparently uncomplicated pregnancies. It is uncertain what proportions of SGA or LGA neonates were detected by clinicians and how antepartum care, including fetal surveillance, and intrapartum management may have been influenced (15-19) . Nevertheless, 28% of SGA neonates (Table 2) were delivered at 40 weeks or later, suggesting that many of these cases were not known prior to delivery (i.e., clinicians aware fetal growth restriction typically recommend delivery no later than 39 weeks). The parent dataset did not include stillbirths occurring prior to admission and may thus have excluded the most extreme adverse outcomes for SGA and LGA (2,3). Since the data are observational, it is unknown if increasing the detection of abnormal growth and interventions would improve the CNM (20-22).
Notwithstanding the limitations, the strengths of the analysis include ascertainment of data directly from the charts by trained research personnel from 25 geographically and demographically diverse populations (10). Additionally, uniform definitions of neonatal outcomes were pre-specified and included outcomes that are associated with long-term sequelae.
These findings have implications with regard to whether routine third-trimester sonographic surveillance in women with uncomplicated pregnancies may or may not be clinically beneficial (23,24). Our results suggest that women with uncomplicated pregnancies experience fetal growth aberration which is associated with increased severe neonatal morbidity. This fetal growth aberration (in this and prior studies) is not well ascertained (15,16,25-30) and detection may have be associated with improved outcomes related to antepartum surveillance and interventions (2,4,17,18). Accordingly, it is possible that third-trimester sonography, despite the known vagaries of accurate fetal weight estimation (31) and iatrogenic neonatal morbidity (30,32), could screen for fetal growth aberration in women with uncomplicated pregnancies and guide intervention that improves neonatal outcomes (2,4,17,18,21,22). We, however, emphasize that before such a practice is implemented, evidence from clinical trials is needed to demonstrate that any theoretical benefits is cost-effective and translates to actual clinical improvement.
Supplementary Material
Acknowledgments
The authors thank Cynthia Milluzzi, R.N. and Joan Moss, R.N.C., M.S.N. for protocol development and coordination between clinical research centers; Cassandra Swartz, M.S. and Vinay Bhandaru, M.S. for statistical analysis; and Elizabeth Thom, Ph.D., Brian M. Mercer, M.D. and Catherine Y. Spong, M.D. for protocol development and oversight.
The project described was supported by grants from the Eunice Kennedy Shriver National Institute of Child Health and Human Development (NICHD) [HD21410, HD27869, HD27915, HD27917, HD34116, HD34208, HD36801, HD40500, HD40512, HD40544, HD40545, HD40560, HD40485, HD53097, HD53118] and the National Center for Research Resources [UL1 RR024989; 5UL1 RR025764]. Comments and views of the authors do not necessarily represent views of the NIH.
Footnotes
Financial Disclosure
The authors did not report any potential conflicts of interest.
Each author has indicated that he or she has met the journal’s requirements for authorship.
Contributor Information
Suneet P. Chauhan, Departments of Obstetrics and Gynecology of the University of Texas Health Science Center at Houston, McGovern Medical School-Children’s Memorial Hermann Hospital, Houston, TX
Madeline Murguia Rice, George Washington University Biostatistics Center, Washington, DC
William A. Grobman, Northwestern University, Chicago, IL.
Jennifer Bailit, MetroHealth Medical Center-Case Western Reserve University, Cleveland, OH.
Uma M. Reddy, Eunice Kennedy Shriver National Institute of Child Health and Human Development, Bethesda, MD.
Ronald J. Wapner, Columbia University, New York, NY
Michael W. Varner, University of Utah Health Sciences Center, Salt Lake City, UT
John M. Thorp, Jr, University of North Carolina at Chapel Hill, Chapel Hill, NC
Kenneth J. Leveno, University of Texas Southwestern Medical Center, Dallas, TX
Steve N. Caritis, University of Pittsburgh, Pittsburgh, PA
Mona Prasad, The Ohio State University, Columbus, OH
Alan T. N. Tita, University of Alabama at Birmingham, Birmingham, AL.
George Saade, University of Texas Medical Branch, Galveston, TX
Yoram Sorokin, Wayne State University, Detroit, MI
Dwight J. Rouse, Brown University, Providence, RI
Jorge E. Tolosa, Oregon Health & Science University, Portland, OR
References
- 1.Chen HY, Chauhan SP, Ward TC, Mori N, Gass ET, Cisler RA. Aberrant fetal growth and early, late, and postneonatal mortality: an analysis of Milwaukee births 1996-2007. Am J Obstet Gynecol. 2011;204(261):e1–261. e10. doi: 10.1016/j.ajog.2010.11.040. [DOI] [PubMed] [Google Scholar]
- 2.American College of Obstetricians and Gynecologists. ACOG Practice Bulletin No 134. Washington DC: ACOG; 2013. Fetal growth restriction. [Google Scholar]
- 3.Bukowski R, Hansen NI, Willinger M, et al. Eunice Kennedy Shriver National Institute of Child Health and Human Development Stillbirth Collaborative Research Network. Fetal growth and risk of stillbirth: a population-based case-control study. PLoS Med. 2014;11:e1001633. doi: 10.1371/journal.pmed.1001633. [DOI] [PMC free article] [PubMed] [Google Scholar]
- 4.American College of Obstetricians and Gynecologists. ACOG Practice Bulletin No 173. Washington DC: ACOG; 2016. Fetal macrosomia. [Google Scholar]
- 5.Sibai BM, Abdella TN, Anderson GD. Pregnancy outcome in 211 patients with mild chronic hypertension. Obstet Gynecol. 1983;61:571–6. [PubMed] [Google Scholar]
- 6.Buchbinder A, Sibai BM, Caritis S, et al. National Institute of Child Health and Human Development Network of Maternal-Fetal Medicine Units. Adverse perinatal outcomes are significantly higher in severe gestational hypertension than in mild preeclampsia. Am J Obstet Gynecol. 2002;186:66–71. doi: 10.1067/mob.2002.120080. [DOI] [PubMed] [Google Scholar]
- 7.Barton JR, O’Brien JM, Bergauer NK, Jacques DL, Sibai BM. Mild gestational hypertension remote from term: progression and outcome. Am J Obstet Gynecol. 2001;184:979–83. doi: 10.1067/mob.2001.112905. [DOI] [PubMed] [Google Scholar]
- 8.Landon MB, Mintz MC, Gabbe SG. Sonographic evaluation of fetal abdominal growth: predictor of the large-for-gestational-age infant in pregnancies complicated by diabetes mellitus. Am J Obstet Gynecol. 1989;160:115–21. doi: 10.1016/0002-9378(89)90101-4. [DOI] [PubMed] [Google Scholar]
- 9.Feldman RK, Tieu RS, Yasumura L. Gestational Diabetes Screening: The International Association of the Diabetes and Pregnancy Study Groups Compared With Carpenter-Coustan Screening. Obstet Gynecol. 2016;127:10–7. doi: 10.1097/AOG.0000000000001132. [DOI] [PubMed] [Google Scholar]
- 10.Bailit JL, Grobman WA, Rice MM, et al. Eunice Kennedy Shriver National Institute of Child Health and Human Development Maternal–Fetal Medicine Units Network. Risk-adjusted models for adverse obstetric outcomes and variation in risk-adjusted outcomes across hospitals. Am J Obstet Gynecol. 2013;209(446):e1–446. e30. doi: 10.1016/j.ajog.2013.07.019. [DOI] [PMC free article] [PubMed] [Google Scholar]
- 11.Alexander GR, Kogan MD, Himes JH. 1994-1996 U.S. singleton birth weight percentiles for gestational age by race, Hispanic origin, and gender. Matern Child Health J. 1999;3:225–31. doi: 10.1023/a:1022381506823. [DOI] [PubMed] [Google Scholar]
- 12.Mendez-Figueroa H, Truong VT, Pedroza C, Khan AM, Chauhan SP. Small-for-gestational-age infants among uncomplicated pregnancies at term: a secondary analysis of 9 Maternal-Fetal Medicine Units Network studies. Am J Obstet Gynecol. 2016;215(628):e1–628. e7. doi: 10.1016/j.ajog.2016.06.043. [DOI] [PubMed] [Google Scholar]
- 13.Mendez-Figueroa H, Truong VT, Pedroza C, Chauhan SP. Morbidity and Mortality in Small-for-Gestational-Age Infants: A Secondary Analysis of Nine MFMU Network Studies. Am J Perinatol. 2016 Aug 17; doi: 10.1055/s-0036-1586502. [DOI] [PubMed] [Google Scholar]
- 14.Chauhan SP, Hendrix NW, Magann EF, Morrison JC, Kenney SP, Devoe LD. Limitations of clinical and sonographic estimates of birth weight: experience with 1034 parturients. Obstet Gynecol. 1998;91:72–7. doi: 10.1016/s0029-7844(97)00590-5. [DOI] [PubMed] [Google Scholar]
- 15.Chauhan SP, Beydoun H, Chang E, et al. Prenatal detection of fetal growth restriction in newborns classified as small for gestational age: correlates and risk of neonatal morbidity. Am J Perinatol. 2014;(31):187–94. doi: 10.1055/s-0033-1343771. [DOI] [PubMed] [Google Scholar]
- 16.Heywood RE, Magann EF, Rich DL, Chauhan SP. The detection of macrosomia at a teaching hospital. Am J Perinatol. 2009;26:165–8. doi: 10.1055/s-0028-1095187. [DOI] [PubMed] [Google Scholar]
- 17.Society for Maternal-Fetal Medicine Publications Committee. Berkley E, Chauhan SP, Abuhamad A. Doppler assessment of the fetus with intrauterine growth restriction. Am J Obstet Gynecol. 2012;206:300–8. doi: 10.1016/j.ajog.2012.01.022. [DOI] [PubMed] [Google Scholar]
- 18.Alfirevic Z, Stampalija T, Gyte GM. Fetal and umbilical Doppler ultrasound in high-risk pregnancies. Cochrane Database Syst Rev. 2013 doi: 10.1002/14651858.CD007529.pub3. CD007529. [DOI] [PMC free article] [PubMed] [Google Scholar]
- 19.Weeks JW, Pitman T, Spinnato JA., 2nd Fetal macrosomia: does antenatal prediction affect delivery route and birth outcome? Am J Obstet Gynecol. 1995;173:1215–9. doi: 10.1016/0002-9378(95)91356-4. [DOI] [PubMed] [Google Scholar]
- 20.Sovio U, White IR, Dacey A, Pasupathy D, Smith GC. Screening for fetal growth restriction with universal third trimester ultrasonography in nulliparous women in the Pregnancy Outcome Prediction (POP) study: a prospective cohort study. Lancet. 2015;386:2089–97. doi: 10.1016/S0140-6736(15)00131-2. [DOI] [PMC free article] [PubMed] [Google Scholar]
- 21.Boulvain M, Irion O, Dowswell T, Thornton JG. Induction of labour at or near term for suspected fetal macrosomia. Cochrane Database Syst Rev. 2016;5 doi: 10.1002/14651858.CD000938.pub2. CD000938. [DOI] [PMC free article] [PubMed] [Google Scholar]
- 22.Boulvain M, Senat MV, Perrotin F, et al. Groupe de Recherche en Obstétrique et Gynécologie (GROG) Induction of labour versus expectant management for large-for-date fetuses: a randomised controlled trial. Lancet. 2015;385:2600–5. doi: 10.1016/S0140-6736(14)61904-8. [DOI] [PubMed] [Google Scholar]
- 23.Hammad IA, Chauhan SP, Mlynarczyk M, et al. Uncomplicated Pregnancies and Ultrasounds for Fetal Growth Restriction: A Pilot Randomized Clinical Trial. AJP Rep. 2016;6:e83–90. doi: 10.1055/s-0035-1567857. [DOI] [PMC free article] [PubMed] [Google Scholar]
- 24.Roma E, Arnau A, Berdala R, Bergos C, Montesinos J, Figueras F. Ultrasound screening for fetal growth restriction at 36 vs 32 weeks’ gestation: a randomized trial (ROUTE) Ultrasound Obstet Gynecol. 2015;46:391–7. doi: 10.1002/uog.14915. [DOI] [PubMed] [Google Scholar]
- 25.Jahn A, Razum O, Berle P. Routine screening for intrauterine growth retardation in Germany: low sensitivity and questionable benefit for diagnosed cases. Acta Obstet Gynecol Scand. 1998;77:643–8. doi: 10.1034/j.1600-0412.1998.770611.x. [DOI] [PubMed] [Google Scholar]
- 26.Lindqvist PG, Molin J. Does antenatal identification of small-for-gestational age fetuses significantly improve their outcome? Ultrasound Obstet Gynecol. 2005;25:258–64. doi: 10.1002/uog.1806. [DOI] [PubMed] [Google Scholar]
- 27.McCowan LM, Roberts CT, Dekker GA, Taylor RS, Chan EH, Kenny LC, Baker PN, Moss-Morris R, Chappell LC, North RA SCOPE consortium. Risk factors for small-for-gestational-age infants by customised birthweight centiles: data from an international prospective cohort study. BJOG. 2010;117:1599–607. doi: 10.1111/j.1471-0528.2010.02737.x. [DOI] [PubMed] [Google Scholar]
- 28.Mattioli KP, Sanderson M, Chauhan SP. Inadequate identification of small-for-gestational-age fetuses at an urban teaching hospital. Int J Gynaecol Obstet. 2010;109:140–3. doi: 10.1016/j.ijgo.2009.11.023. [DOI] [PubMed] [Google Scholar]
- 29.Verlijsdonk JW, Winkens B, Boers K, Scherjon S, Roumen F. Suspected versus non-suspected small-for-gestational age fetuses at term: perinatal outcomes. J Matern Fetal Neonatal Med. 2012;25:938–43. doi: 10.3109/14767058.2011.600793. [DOI] [PubMed] [Google Scholar]
- 30.Monier I, Blondel B, Ego A, Kaminiski M, Goffinet F, Zeitlin J. Poor effectiveness of antenatal detection of fetal growth restriction and consequences for obstetric management and neonatal outcomes: a French national study. BJOG. 2015;122:518–27. doi: 10.1111/1471-0528.13148. [DOI] [PubMed] [Google Scholar]
- 31.Chauhan SP, Hendrix NW, Magann EF, Morrison JC, Scardo JA, Berghella V. A review of sonographic estimate of fetal weight: vagaries of accuracy. J Matern Fetal Neonatal Med. 2005;18:211–20. doi: 10.1080/14767050500223465. [DOI] [PubMed] [Google Scholar]
- 32.Mlynarczyk M, Chauhan SP, Baydoun HA, et al. The Clinical Significance of an Estimated Fetal Weight Below the 10th Centile: A Comparison of Outcomes Between <5th versus 5th-9th Centile. Am J Obstet Gynecol. 2017 Apr 19; doi: 10.1016/j.ajog.2017.04.020. [DOI] [PubMed] [Google Scholar]
Associated Data
This section collects any data citations, data availability statements, or supplementary materials included in this article.