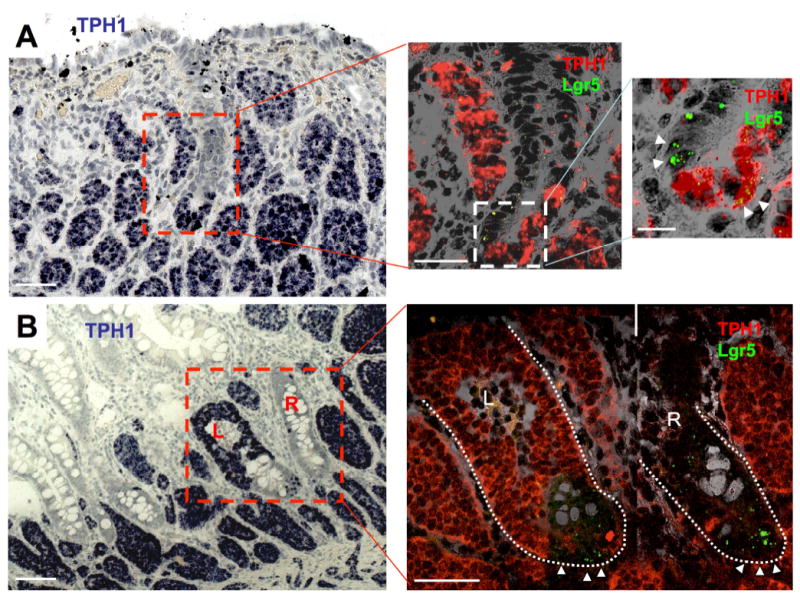
Figure 3.

Early carcinoid tumorigenesis in a patient with Familial SI-NET. (A and B) Representative images of chromogenic (fast blue) RNA-ISH for expression of TPH1 in a FFPE section of an ileal SI-NET (patient F2) identifies multiple extra-epithelial tumor nests and a micro-tumor formation in the epithelium, ACEC, (center bottom in the red squared region, left panels). (A, center) TPH1 (fast red fluorescence, red) and Lgr5 (fast blue fluorescence, green) RNA-ISH of the next serial section in the area of the inset (outlined in red) from the left panel merged with the transmitted light image to illustrate the presence of expected TPH1-/Lgr5+ rapidly cycling ISCs and an unusual collection of TPH1+/Lgr5+ epithelial cells. (A, right) The enlarged image of the inset from the center panel more clearly shows the presence of TPH1-/Lgr5+ rapidly cycling ISCs at the crypt base (left two white triangles) and TPH1+/Lgr5+ putative tumor cells (right two white triangles) in the formation of TPH1+ tumor cluster at the crypt base. (B, right) TPH1 (fast red fluorescence, red) and Lgr5 (fast blue fluorescence, green) RNA-ISH of the next serial section in the area of the inset (outlined in red) from the left panel merged with the transmitted light image to illustrate an advanced ACEC (L) and a normal unaffected crypt (R). Triangles show TPH1(-)/Lgr5+ rapidly cycling ISCs at the crypt base. Scale bars in A-left and B-left, 100 μm; in A-center and B-right, 50 μm; in A-right, 10 μm.
