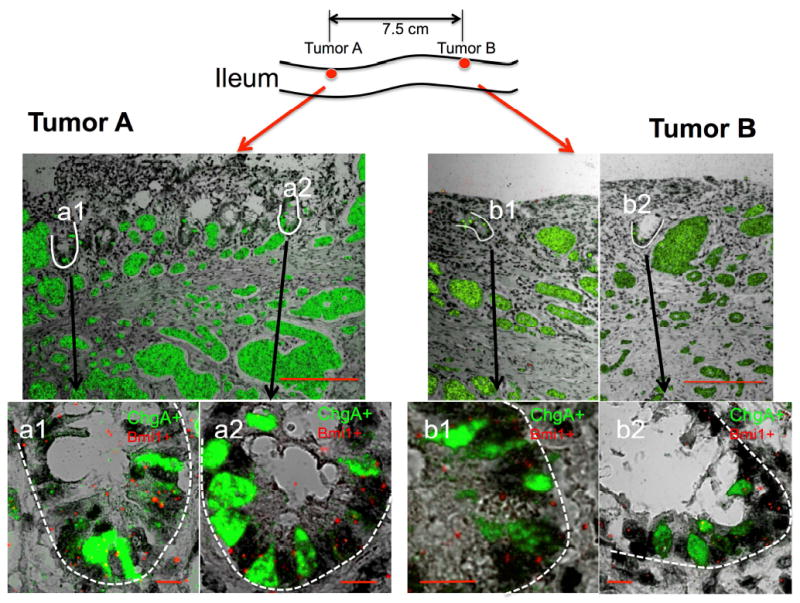
Figure 5.

Presence of multifocal ACECs within two separate tumors. RNA-ISH shows expression of ChgA (green) in FFPE sections from ileal tumors A and B that were separated by 7.5 cm of grossly normal bowel in a patient (F10) with familial carcinoid. Scale bars in top panels, 200 μm. Bottom panels show enlarged images of the two outlined (white) ACECs (a1 and a2) in tumor A and two ACECs (b1 and b2) in tumor B. All images represent merged images of RNA-ISH for ChgA (green) and Bmi1 (red) doubly positive cells in abnormal clusters with transmitted light images. Scale bars in bottom panels, 10 μm.
