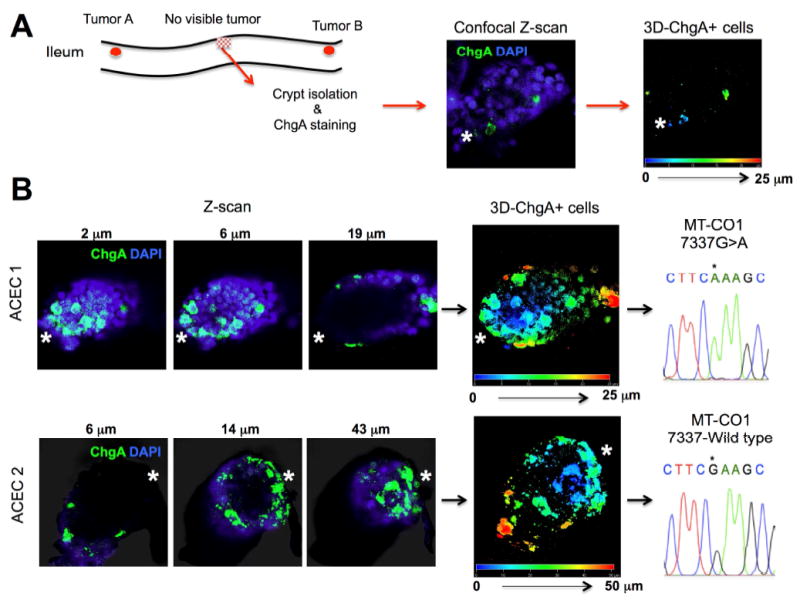
Figure 7.

Confocal 3D image analysis and mtDNA sequencing of abnormal clusters of ChgA+ cells in the two isolated ACECs from the grossly normal appearing ileal mucosa from a patient with familial SI-NET (F14). (A) The crypts from grossly tumor-free mucosa were isolated from a patient with the familial SI-NET (F14), immunostained for ChgA, and screened for abnormal clusters of ChgA+ cells. Immuno-positive cyrpts were imaged and analyzed for the number and position of ChgA+ cells using 3D reconstruction from Z-stacked confocal images. (B) Two of approximately 790 crypts were found to contain abnormal clusters of ChgA + cells at the crypt bottom. Representative Z-scan images (ChgA in green and DAPI in blue) and 3D positions of ChgA+ cells appear in multiple colors corresponding to their depth in each 3D reconstructed ACEC. The approximate position of the crypt base is denoted by a white asterisk. Each of these crypts was manually isolated for sequencing of mtDNA. ACEC 1 harbored a homoplastic 7337 G>A (*) mutation in MT-CO1 while the ACEC 2 maintained a wild type G (*).
