


Abstract
Using currently available MS-based methods, accurate mass measurements are essential for the characterization of DNA oligomers. However, there is a lack of specificity in mass peaks when the characterization of individual DNA species in a mass spectrum is dependent solely upon the mass-to-charge ratio (m/z). Here, we utilize nucleotide-specific tagging with stable isotopes to provide internal signatures that quantitatively display the nucleotide content of oligomer peaks in MS spectra. The characteristic mass-split patterns induced by the partially 13C/15N-enriched dNTPs in DNA oligomers indicate the number of labeled precursors and in turn the base substitution in each mass peak, and provide for efficient SNP detection. Signals in mass spectra not only reflect the masses of particular DNA oligomers, but also their specific composition of particular nucleotides. The measurements of mass tags are relative in the mass-split pattern and, hence, the accuracy of the determination of nucleotide substitution is indirectly increased. For high sample throughput, 13C/15N-labeled sequences of interest have been generated, excised in solution and purified for MS analysis in a single-tube format. This method can substantially improve the specificity, accuracy and efficiency of mass spectrometry in the characterization of DNA oligomers and genetic variations.
INTRODUCTION
With the announcement of the draft sequence of the human genome we are now entering the era of post-genomic research (1). This new research era requires the urgent development of accurate, high throughput technologies for determining many genetic variations or polymorphic sites in the human genome (2–4). About 80% of these polymorphic sites are single nucleotide polymorphisms (SNPs) with an abundance of one in every 100–300 bp (5–8). Because of their associations with many genetic diseases, the identification of SNPs has high priority in functional genomic studies. Mass spectrometry (MS) provides fast and accurate measurements of the molecular masses of short DNA sequences (9). Recently, due to its speed, accuracy and sensitivity, matrix-assisted laser desorption ionization-time of flight mass spectrometry (MALDI-TOF MS) has been shown to be very promising for the efficient genotyping of SNPs (10,11).
Whereas several MALDI-TOF MS-based methods have been introduced for genotyping SNPs, the primary strategy has been to generate SNP-containing products through primer extension for MS analysis (12–21). Haff and Smirnov invented a PinPoint assay based on the annealing of a primer to the 5′-end upstream of the target polymorphic site (14,15). SNPs can then be detected through the accurate mass measurement of these primers extended by a single dideoxynucleotide. A variety of MS approaches derived from this primer extension strategy including PROBE (16–18) and VEST (19) assay have been also utilized.
These methods, as promising as they are, have their shortcomings. In general, all of the primer masses, usually in the range of 5000–6000 Da, are included in SNP detection. The overlap of these primer masses results in a decrease in the overall mass window that indirectly reduces the mass resolution in determining the base substitution in an extended primer. This mass overlap also affects the efficiency and accuracy of the analysis of a number of polymorphic sites using multiple primers in any primer extension-based assay. Additional masses added to the ddNTPs can overcome the original mass stringency by shifting the mass of the extended primer (20,21). However, this still demands high instrumental resolution to resolve small mass changes involved in base substitutions, e.g., the 9 Da mass difference between an A and a T.
Laken et al. (22) introduced a method to generate short DNA fragments from PCR products by including the cleavage site for a type II endonuclease, BpmI, in the primer sequences. However, it was found that the BpmI digestion of these PCR products was inefficient and yielded incomplete digests. HPLC was needed to purify the target sequence that reduces sample throughput for SNP analysis. This method also requires the synthesis of large primers (35–38 bp in length) due to a long flanking region N16/N14 of the BpmI recognition sequence in order to increase the specificity of PCR amplifications. Most importantly, because all MS-based methods so far provide only mass-to-charge ratios (m/z), the identification of an SNP relies on the precise determination of the mass difference between the wild-type and mutant genes, which depends on the sensitivity and resolution of the mass spectrometer.
Previously, we have introduced a MALDI-TOF MS-based method of mass tagging with stable isotopes for the determination of the nucleotide composition of PCR products (23). Here we report an extension of this strategy for the characterization of DNA oligomers and the detection of SNPs in a more efficient and accurate manner. In our new approach, partial 13C/15N-labeled dNTPs carry unique mass tags that were used to trace a particular type of nucleotide in DNA fragments or ladders. The number of labeled nucleotides in the target sequence is determined by the mass shift between the 13C/15N-labeled and unlabeled HphI digests. More significantly, SNPs can immediately be detected through characteristic mass-split patterns of the 50% 13C/15N-dNTP-labeled PCR products. Further, to facilitate the sample preparation and analysis, 5′-biotin-labeled primers that contain the HphI restriction site are used to amplify the specific allelic regions in the presence of 13C/15N-labeled nucleotides. Streptavidin paramagnetic beads are then used to capture the biotin primer ends of the PCR products during the release of the 13C/15N-dNTP-labeled target sequences. A common SNP mutation found in the cancer susceptibility gene BRCA-1, the A1186G substitution, was chosen as a model candidate to test the viability of our method in the detection of SNPs (24–26). This latest development of our technology of stable isotope-assisted MS is readily amenable to automation and high throughput multiplex analysis.
MATERIALS AND METHODS
Chemicals and enzymes
Unlabeled dNTPs were obtained from Promega (Madison, WI). Stable isotope-enriched nucleotide precursors, >99% 13C and 15N (13C/15N)-labeled dNTP, were purchased from Martek Biosciences Corporation (Columbia, MD). We have separated four types of 13C/15N-labeled nucleotides by reverse-phase HPLC (Vydac C18 reverse phase 218TP54 HPLC column). Taq DNA polymerase was purchased from Qiagen (Germany). Float dialysis membrane (VSWP 02500 with 0.025 µm pore size) was purchased from Millipore (Bedford, MA). Streptavidin magneSphere paramagnetic beads as well as magnesphere technology magnetic separation stand were obtained from Promega. 3-Hydroxypicolinic acid (3HPA) was obtained from Aldrich Chemical Company (Milwaukee, WI).
All oligonucleotide templates and primers were synthesized and purified using a DNA synthesizer at the LANL Center of Human Genome Studies. For the amplification of the region containing the A1186G substitution in Exon 11 of the BRCA1 gene, we have designed a set of primers to generate the HphI mid-digests containing the SNP site in the 9mer. The primers are 5′-ATCCGGGTGAAATGGAAT-3′ (forward) and 5′-CGATCGGTGACATGGCAG-3′ (reverse). The 45 bp PCR product (wild-type) is 5′-ATCCGGGTGAAATGGAATAAGCAGAAACTGCCATGTCACCGATCG-3′ (sense strand). The HphI recognition sites are in italic and the sequence of HphI mid-digest is underlined.
PCR labeling of target allelic regions in the BRCA1 gene
PCR amplifications of any region of interest were carried out on a 50 µl scale. Each reaction contains 5 µl 10× PCR reaction buffer, 50 ng DNA template, 100 ng DNA primers, 0.25 µl (5 U/µl) Taq polymerase, 5 µl (25 mM/µl) MgCl2 and 1.2 µl (10 mM) of dNTPs. Genomic DNA templates were treated with an additional initial denaturation cycle of 2 min at 94°C. The amplification was performed for 25 cycles of 45 s at 94°C for denaturation, 60 s at 45°C for annealing and 45 s at 72°C for extension. To generate nucleotide-specific mass-tagged PCR products the 13C/15N-labeled dNTPs (N = G, A, T or C) can be mixed with the other three unlabeled dNTPs. The percentage of a particular type of 13C/15N-labeled dNTPs can adjusted by mixing 99% 13C/15N-labeled and unlabeled dNTPs. Streptavidin magnetic beads (25 µg) were directly added to a PCR mixture and incubated at room temperature for 10 min. Samples sitting in a magnetic concentrator apparatus were washed with ammonuim-containing buffer.
Sample preparation and MALDI-TOF MS analysis
Magnetic bead purified PCR products were incubated with HphI restriction enzyme for 1 h at 37°C in a 50 µl reaction containing 5 µl 10× NEB buffer 4 (50 mM potassium acetate, 20 mM Tris acetate pH 7.9, 10 mM magnesium acetate, 1 mM DTT) and 0.5 µl of HphI (5 U/µl). Supernatant (10 µl) containing the HphI mid-digests was placed on the surface of the nitrocellulose membrane filter with 0.025 µm pore size floated on 50 ml nanopure H2O. After dialysis for 45 min or longer, the samples were extracted from the membrane and dried in a Savant SpeedVac DNA concentrator. The dried samples were resuspended in 2 µl of a matrix consisting of saturated 3-HPA in a 1:1:2 mixture of water, acetonitrile and 0.1 M ammonium citrate. The resuspended samples were spotted on a MALDI stainless steel sample plate and air-dried. Mass spectra were collected on a PE Voyager-DE-STR Preseptive Biosystem MALDI-TOF MS with a 600 ns time delay. All MALDI-TOF MS spectra were calibrated to external standards including a 10mer DNA oligomer.
RESULTS
Sample preparation
As outlined in the experimental procedure described in Figure 1, using the 5′-biotinylated primers containing the HphI site and 13C/15N-labeled dNTP (N = A, T, C or G) precursors in PCR, we have amplified an SNP site located in exon 11 of the BRCA1 gene and obtained 45 bp PCR products, designated according to the labeled nucleotide: ‘Label-A’, ‘Label-T’, ‘Label-C’ or ‘Label-G’. The biotinylated PCR products were bound to streptavidin-coated magnetic beads and isolated from other impurities. HphI restriction digestion of a PCR product resulted in fragments of two sticky-ended 18mers (Fig. 1, b and c) and a sticky-ended 9mer (Fig. 1, a), designated as ‘HphI mid-digest’. The two 18 bp primer-end fragments were also captured by the beads and removed from solution, leaving the 9 bp DNA fragment in the supernatant that was sufficiently desalted by membrane dialysis.
Figure 1.
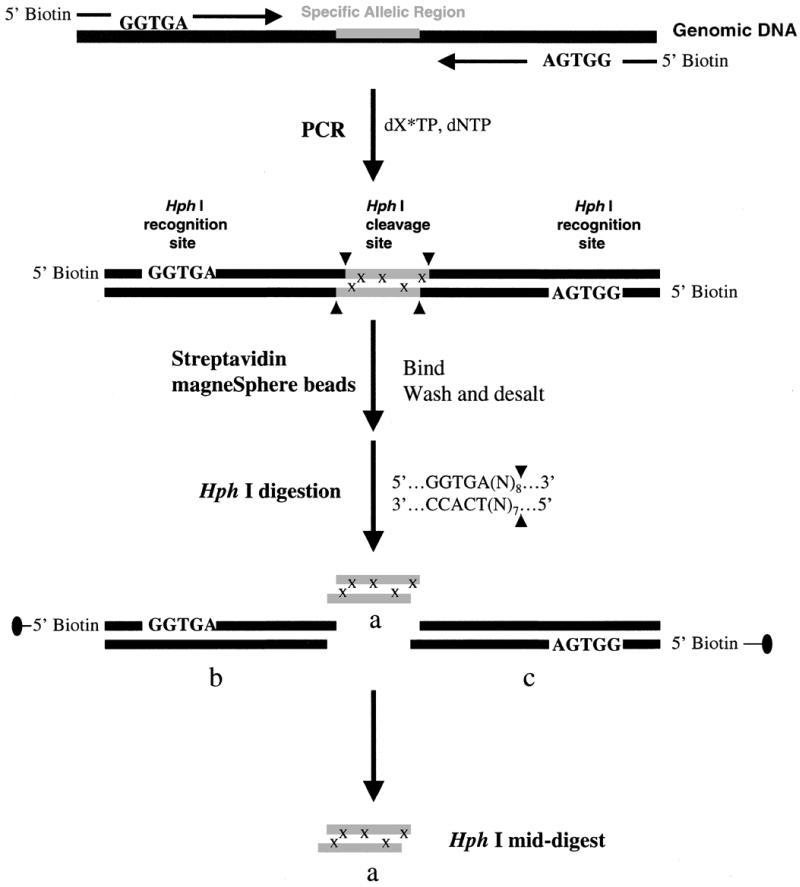
A schematic representation of our strategy for efficient and high throughput SNP detection. The synthetic PCR primers are biotinylated and the restriction recognition site of HphI is included at the 5′-end of each primer. HphI has the recognition sequence of 5′…GGTGA (N8)…3′, which dictates the restriction cleavage at the 8th nucleotide from the 5′ end or 7th from the 3′ end. The nucleotides, N, representing the complimentary sequences of the genomic DNA are included in the primer sequences. After PCR amplification and labeling with 13C/15N-labeled nucleotides, x, streptavidin magneSphere paramagnetic beads are added to the solution to capture the biotinylated PCR products through biotin–streptavidin interactions. The PCR products linked to the beads are washed and then subjected to the HphI restriction digestion, and the target sequence containing SNP site(s), HphI mid-digest, or a, is released in solution. The biotin-labeled end of the digest portions [HphI recognition sequence plus (N)8/(N)7 flanking regions], b and c, are attached to the paramagnetic beads and trapped with a magnesphere technology magnetic separation stand. The labeled HphI mid-digest, a, is then desalted via a nitrocellulose membrane and dried for MALDI-TOF analysis. In MALDI-TOF spectra, the 13C/15N-labeled nucleotides, x, will induce a mass shift in product a, away from the molecular mass of the unlabeled product. This mass shift gives the number of labeled nucleotides incorporated in the amplified product.
The characteristic mass-split pattern for the nucleotide identification in DNA oligomer MS peaks
In the presence of a mixture of the unlabeled (light) and 13C/15N-labeled dNTP (heavy) precursors, PCR amplification randomly incorporates both species into a sequence yielding a number of partially labeled products. We have performed PCR with a particular type of 50% 13C/15N-labeled nucleotides on the genomic DNA of both the wild-type and mutant A1186G allelic site. Figure 2 shows the MALDI-TOF spectra of the HphI mid-digests mass-tagged with 50% 13C/15N-labeled G or C. Although not detected in gel electrophoresis, these MALDI-TOF MS spectra of the HphI mid-digests reveal that there are two sets of peaks corresponding to 8 and 9 bp oligomers. The mass-splits resulting from the incorporation of the heavy nucleotides at different G or C positions were clearly observed for the individual strands of both the 8mer and 9mer digests. For example, in the 8 bp ‘Label-G’ product from the wild-type gene (Fig. 2A), there are two split peaks with m/z values at 2441.36 and 2456.31 Da in the (–) strand, and four peaks in the (+) strand, i.e., 2557.68, 2572.64, 2587.26 and 2602.56 Da. These split peaks are all separated by ∼15 Da, which is the mass tag of a 13C/15N-labeled G. Similarly, for the 50% ‘label-C’ (Fig. 2B) we observed four split peaks in the (–) strand with m/z values of 2437.28, 2448.16, 2460.66 and 2472.65 Da, and two split peaks in the (+) strand at 2553.22 and 2565.15 Da: all are separated by ∼12 Da, the mass tag for a 13C/15N-labeled C. These mass-split patterns therefore indicate there are one G and three Cs in the (–) strand of the 8mer, and three Gs and one C in the (+) strand of the wild-type SNP allelic region. In addition, a comparison of the mass-split pattern for the ‘label-G’ (Fig. 2A) with that of the ‘label-C’ (Fig. 2B) shows that the content of the G and C in one strand is complimentary to that of the other. Further, the same mass-split pattern was observed for both the 8mer and 9mer, indicating no change in the G or C content during the oligomer degradation of the 9mer. Note that all Na+ adducts were easily identified by a 23 Da mass shift (e.g., the peak at 2479.45 Da) that differs from the mass tags of 13C/15N-labeled dNTPs in the MS spectra.
Figure 2.

Negative-ion MALDI-TOF mass spectra of HphI mid-digests of PCR products amplified from the mutant-type of a site at exon 1186 of BRCA-1 labeled with (A) 50% 13C/15N-dGTP and (B) 50% 13C/15N-dCTP. + Na+ indicates the sodium adducts. 12Da or 15Da indicates a mass tag for a 13C/15N-labeled dCTP or dGTP. + Na+ or 23Da indicates sodium adducts.
Use of characteristic mass-split patterns for SNP detection
We have correlated characteristic mass-split patterns in the MALDI spectra with the contents of particular nucleotide(s) for the detection of base substitutions. The 8 and 9 bp HphI mid-digests labeled with 50% 13C/15N-dGTP or 13C/15N-dATP were obtained from the amplification of both the wild-type and mutant forms of the BRCA-1 genomic DNA. In Figure 3, the mass-split pattern of the ‘label-G’ product of the wild-type gene (Fig. 3A) is contrasted with that of the mutant-type (Fig. 3B). Four instead of three peaks spacing 15 Da in mass were observed for the (+) strand of the 8 or 9 bp ‘label-G’ product of the mutant-type gene. This suggests that an extra G is contained in the (+) strand of the mutant gene. Mass-split patterns of the (–) strands of both the wild-type and mutant are all doublets, indicating one G in the (–) strands of both 8mer and 9mer DNA. Similarly, using 50% 13C/15N-dATP as the labeled precursors, we identified in the (+) strand of the wild-type gene (8mer) six peaks at 2540.30, 2556.63, 2569.92, 2584.88, 2699.41 and 2614.81 Da, respectively, all separated by 15 Da (Fig. 4A). In contrast, five peaks at 2555.93, 2570.60, 2585.56, 2600.26 and 2615.14 Da were found in the corresponding strand of the mutant gene (8mer) (Fig. 4B). These results show clearly an A→G substitution in the (+) strand of the mutant gene. Resulting from this nucleotide substitution, small shifts in the absolute masses of individual strands were observed for the strands of the mutant with respect to those of the wild-type products. However, this has little effect on the accuracy of the SNP detection because the nucleotide contents correlate only with the differences in the mass-split pattern in which SNPs can be immediately identified by these pattern changes.
Figure 3.

Negative-ion MALDI-TOF mass spectra of HphI mid-digests of PCR products labeled with 50% 13C/15N-dGTP amplified from (A) the wild-type, (B) the mutant-type of a site at exon 1186 of BRCA-1. + Na+ indicates the sodium adducts. 12 Da or 15Da indicates a mass tag for a 13C/15N-labeled dCTP or dGTP.
Figure 4.

Negative-ion MALDI-TOF mass spectra of HphI mid-digests of PCR products labeled with 50% 13C/15N-dATP amplified from (A) the wild-type, (B) the mutant-type of a site at exon 1186 of BRCA-1. + Na+ or 23Da indicate sodium adducts. +K+ or 39 Da indicate potassium adducts. 15Da indicates the magnitude of the mass tag for 13C/15N-labeled dATP.
Nucleotide composition determination for the HphI mid-digests
MALDI-TOF MS spectra of the unlabeled and the 99% 13C/15N-dNTP-labeled HphI mid-digests obtained from both a normal and a mutant BRCA-1 gene are shown in Figures 5 and 6, respectively. We included a population of the unlabeled PCR products so that both the unlabeled and 99%-labeled digests were simultaneously present in the MS spectra for the mass-shift determination. These mass-shifts can therefore be accurately measured by the relative mass changes of the labeled species with respect to the unlabeled counterparts, regardless of the calibration accuracy. For example, the 99% 13C/15N-dATP-labeled 9mer of the wild-type HphI mid-digest gives the peaks of m/z values at 2803.22 Da for the (–) strand and 2944.42 Da for the (+) strand with mass shifts of 15.65 and 89.00 Da with respect to the corresponding unlabeled strands, respectively. With the known 15 Da mass tag for each A, these mass shifts corresponding to one 13C/15N-tagged As in the (–) strand and six in the (+) strand. In comparison, there is one A in the (–) strand and five in the (+) strand of the mutant-form HphI mid-digest being determined through the mass shifts induced by the 13C/15N-tagged A. Note that the mass tags (<15 Da per base) are much smaller than the one base mass difference between each base ladder, e.g., 8mer verse 9mer (>289 Da). Therefore, the mass shifts caused by mutiple labeled base precursors can be resolved within one base mass.
Figure 5.

Negative-ion MALDI-TOF MS spectra of the unlabeled and individually 99% 13C/15N-dNTP-labeled HphI mid-digest amplified from the wild-type gene with (A) unlabeled dNTPs, (B) 99% 13C/15N-labeled dATP, (C) 99% 13C/15N-labeled dTTP, (D) 99% 13C/15N-labeled dCTP, (E) 99% 13C/15N-labeled dGTP. Asterisks indicate the mass peaks of the (–) strains derived from the experimentally measured masses of the (+) strains due to the weakness of the (–) strains. + Na+ or 23 Da indicate sodium adducts. +K+ or 39 Da indicate potassium adducts. All spectra were obtained using an accelerating voltage of 20 kV, a grid voltage of 95%, with 128 average scans, and an extraction delay time of 600 ns.
Figure 6.

Negative-ion MALDI-TOF MS spectra of the unlabeled and individually 99% 13C/15N-dNTP-labeled HphI mid-digest PCR amplified from the mutant-form gene with (A) unlabeled dNTPs, (B) 99% 13C/15N-labeled dATP, (C) 99% 13C/15N-labeled dTTP, (D) 99% 13C/15N-labeled dCTP, (E) 99% 13C/15N-labeled dGTP. + Na+ or 23 Da indicate sodium adducts. + K+ or 39 Da indicate potassium adducts. All spectra were obtained using an accelerating voltage of 20 kV, a grid voltage of 95%, with 128 average scans and an extraction delay time of 600 ns.
Genotyping of a heterozygous SNP site of BRAC-1 using nucleotide-specific mass tags
Figure 7 shows an example of genotyping a heterozygous sample where our nucleotide-specific mass-tagging approach is used to screen the genomic DNA samples obtained from a population. In Figure 7A, the amplification products with the unlabeled dNTP give two peaks each for both the (–) and (+) strands, as designated ‘WU’ or ‘MU’, standing for the unlabeled wild-type or mutant form, respectively. Using 50% 13C/15N-enriched G, as shown in Figure 7B, both peaks in the (–) or (+) strand of the 8mer or 9mer are ‘mass-split’ into the multiple peaks, all spacing in approximate 15 Da or a mass tag of a 13C/15N-enriched ‘G’ nucleotide. With the incorporation of 100% ‘heavy’ G nucleotides in PCR amplification of the genomic DNA (Fig. 7C), the masses of all single strands were shifted to the positions of the fully labeled products, as designated ‘WL’ or ‘ML’, standing for the labeled wild-type or mutant form, respectively. After the m/z values of both the unlabeled and the fully G-labeled species were determined, the peak numbers in between these boundaries were used to determine the content of G for each individual strands originated from the wild-type or mutant form gene of the SNP site. For example, in Figure 7B, the m/z values of 2538.05, 2553.61 and 2568.32 Da, reflecting the content of two Gs, were assigned to the wild-type gene of the (+) strand of the 8mer, and the peaks at 2553.61, 2568.32, 2583.63 and 2598.71 Da to the (+) strand of the mutant form gene. The SNP occurs at the (+) strand. From the relative intensity, the wild-type and mutant form genes are in the ratio of 1:1. Clearly, our analysis is accurate enough to unambiguously identify genotypes of heterozygous alleles of the SNP site.
Figure 7.

Negative-ion MALDI-TOF mass spectra of HphI mid-digests of PCR products labeled with (A) 0%, (B) 50% and (C) 100% 13C/15N-dGTP amplified from the genomic DNA containing a heterozygous site at exon 1186 of BRCA-1. WU, MU, WL and ML designate the unlabeled wild-type, the unlabeled mutant-form, the labeled wild-type and the labeled mutant-form, respectively. +Na+ or 23 Da indicate sodium adducts. +K+ or 39 Da indicate potassium adducts. 15Da indicates the magnitude of the mass tag for 13C/15N-labeled dGTP.
Unambiguous determination of the A/T content in a 31 bp PCR product
Figure 8 demonstrates our approach to discriminate A/T base variations in large PCR products with the length in which the 9 Da mass difference between A and T becomes irresolvable using current available methods of MALDI-TOF MS. Figure 8A gives a MALDI-TOF MS of the both individual strands of a 31 bp PCR product. Using this 31mer as the template, the same sequence was amplified in the presence of 100% 13C/15N-dATP or both 100% 13C/15N-dATP and 13C/15N-dTTP. The sequence of the (+) or (–) strand of this 31mer is given as 5′-CGCCCGTCGTTGCAGACAACTGCTCTCGTCT-3′ (+) or 5′-AGACGAGAGCAGTTGTCTGCAACGACGGGCG-3′ (–), while the regions being amplified are in bold and the labeled nucleotides are in bold and underlined for A or in bold and italic for T. We included a population of the unlabeled template so that both the unlabeled and 99%-labeled products were simultaneously present in the MS spectra for the mass-shift determination. In the mixture of the unlabeled and 100% 13C/15N-dATP-labeled products (Fig. 8B), the (+) strand shows a mass-split of 60.2 Da indicating its content of four As. For the PCR product obtained from the amplification with both 100% 13C/15N-dATP and 13C/15N-dTTP precursors (Fig. 8C), the (–) strand was also in a 48.2 Da mass split that corresponds to four Ts in the strand. Note that our labeling strategy is not to resolve directly the mass difference resulted from the base substitution; instead, the detection of sequence variations is based on the relative measurement of molecular mass differences between unlabeled and labeled PCR products. Therefore, the base resolving power of our labeling approach has indirectly been extended to larger PCR products.
Figure 8.

Negative-ion MALDI-TOF mass spectra of the 31 bp PCR products obtained from amplification with (A) the unlabeled dNTP precursors, (B) 100% 13C/15N-dATP, (C) both 100% 13C/15N-dATP and 13C/15N-dTTP. +K+ or 39Da indicate potassium adducts. UL or L designate to a unlabeled or labeled strain, respectively.
DISCUSSION
We have introduced nucleotide-specific mass tags in addition to the m/z values to characterize PCR products in MS spectra without the demand for ultrahigh mass accuracy and precision. Most importantly, using characteristic mass-split patterns induced by the incorporation of 50% 13C/15N-tagged nucleotides, we have rapidly determined the nucleotide substitution in an SNP site of the BRCA-1 gene. Because the characteristic mass tags of the labeled nucleotide precursors are either 12 or 15 Da, they can be easily distinguished from a Na+-adduct peak that is increased by 23 Da. In the case of multiple 12 Da increments of mass tags that may overlap with the mass of a Na+ adduct, e.g., a pair of Cs generates a mass shift of 24 Da compared to the 23 Da of a Na+ adduct, the simultaneous display of the mass-split patterns of both individual strands that determines the content of particular nucletiodes independently can provide a build-in internal control for distinguishing the interference from Na+ adducts.
Importantly, in our SNP detection, these nucleotide-specific tags of 12 or 15 Da per nucleotide increase the resolution limit by a least 30% compared to the 9 Da mass change in an A→T substitution. In our case, the mass-split pattern correlates strictly with the number of a particular nucleotide in a DNA fragment. Because these mass-shift measurements are relative due to nucleotide-specific mass tagging, the precision of the absolute mass determination of these DNA fragments becomes less stringent. Therefore, we have bypassed the difficulties associated with the determination of the absolute masses of DNA oligomers in genetic typing.
A type II restriction enzyme, HphI, cleaves 7 or 8 bp downstream from its recognition site so that the inclusion of HphI recognition sites at both ends of PCR products allows the release of any size of intervening oligomer that contains the target sequences. The HphI digestion proved to be more efficient than BpmI in our experiments. Furthermore, using these mass-shift values measured by MALDI-TOF MS, we have determined the number of each of the 13C/15N-labeled dNTPs in both the (+) and (–) strands of these 8mer and 9mers of the HphI mid-digests. By comparing the nucleotide composition of an 8mer versus a 9mer, it was concluded that the 9mer undergoes the following reaction to product an 8mer with the loss of a terminal A from each strand (showing here the wild-type sequence) (New England Biolabs):
5′- AAGCAGAAA-3′→ 5′-AGCAGAAA-3′ (+)
3′-ATTCGTCTT -5′ 3′-TTCGTCTT-5′ (–)
9 - mer 8 - mer
Although there is a non-specific production of the 8mer and 9mer digests using the HphI restriction enzyme, the mass-split pattern can be well resolved and assigned to the nucleotide content of the single-stranded oligomers in between the one base mass of 8mer and 9mer, i.e., multiple increments of 12 or 15 Da are small in comparison to the large differences of about 300 Da between each nucleotide. Because nucleotide compositions of both single DNA strands can be determined independently, our approach has a built-in error checking capability.
Here, allelic DNA sequences containing SNP site(s) are amplified, selectively labeled with a particular type of 13C/15N-labeled dNTP, digested, and released for MALDI-TOF MS analysis in a single-tube format. Streptavidin paramagnetic beads are used to remove all undesired portions of the HphI digests from the solution so that the need of HPLC for sample separation was eliminated. Float membrane dialysis conveniently desalts the oligomers containing the specific allelic sequences. A 50 µl PCR preparation produced enough material for four MS measurements. For simultaneous multiple analyses in a single tube, primers can be designed to ‘walk’ on genomic DNA targets and generate a series of short target sequences with different sizes. Because the HphI mid-digests contain only the target gene sequences, excluding the primer-end regions, the mass window in MS analysis can be enlarged for increasing the number of multiplex products. This new MALDI-based approach is convenient, efficient and cost-effective for sample preparation, is accessible for routine use and amendable for automation and high throughput.
Our method of using 13C/15N-labeled nucleotides gives the nucleotide composition but provides no sequence information. However, this problem can be overcome by performing collision-induced fragmentation experiments on nucleotide-specific mass-tagged PCR products using the mass-tagged nucleotides as internal markers. In MALDI-TOF fragmentation spectra, the mass-split pattern resulting from the presence of both the unlabeled and 13C/15N-labeled nucleotides at 1:1 molar ratio identifies those fragments containing the labeled precursor (Abdi,F. and Chen,X., manuscript in preparation).
Acknowledgments
ACKNOWLEDGEMENTS
This work was supported by DOE Human Genome Instrumentation Grant ERW9840 (to X.C.), Los Alamos National Laboratory LDRD Grant X1BU (to X.C.), DOE Joint Genome Institute QA Grant, and DOE grant KP1103010 (to E.M.B.). We are grateful to Ms Sue Thompson for her help with primer synthesis. X.C. is a recipient of Presidential Early Career Award for Scientists and Engineers (PECASE).
References
- 1. Nature insight: Functional genomics (2000) Nature, 405, 819–865. [Google Scholar]
- 2.Collins F.S., Guyer,M.S. and Chakravarti,A. (1997) Variations on a theme: cataloging human DNA sequence variation. Science, 278, 1580–1581. [DOI] [PubMed] [Google Scholar]
- 3.Risch N. and Merikangas,K. (1996) The future of genetic studies of complex human diseases. Science, 273, 1516–1517. [DOI] [PubMed] [Google Scholar]
- 4.Roses A.D. (2000) Pharmacogenetics and the practice of medicine. Nature, 405, 857–865. [DOI] [PubMed] [Google Scholar]
- 5.Brookes A.J. (1999) The essence of SNPs. Gene, 234, 177–186. [DOI] [PubMed] [Google Scholar]
- 6.Cargill M., Altchuler,D., Ireland,J., Sklar,P., Ardlie,K., Patil,N., Shaw,N., Lane,C.R., Lim,E.P., Kalyanaraman,N. et al. (1999) Characterization of single-nucleotide polymorphisms in coding regions of human genes. Nat. Genet., 22, 231–238. [DOI] [PubMed] [Google Scholar]
- 7.Collins A., Lonjou,C. and Morton,N.E. (1999) Genetic epidemiology of single-nucleotide polymorphisms. Proc. Natl Acad. Sci. USA, 96, 15173–15177. [DOI] [PMC free article] [PubMed] [Google Scholar]
- 8.Chen J., Iannone,M.A., Li,M.S., Taylor,J.D., Rivers,P., Nelsen,A.J., Slentz-Kesler,K.A., Roses,A. and Weiner,M.P. (2000) A microsphere-based assay for multiplexed single-nucleotide polymorphism analysis using single base chain extension. Genome Res., 10, 549–557. [DOI] [PMC free article] [PubMed] [Google Scholar]
- 9.Murray K.K. (1999) DNA sequencing by mass spectrometry. J. Mass Spectrom., 31, 1203–1215. [DOI] [PubMed] [Google Scholar]
- 10.Guo B. (1999) Mass spectrometry in DNA analysis. Anal. Chem., 71, 333R–337R. [DOI] [PubMed] [Google Scholar]
- 11.Griffin T.J. and Smith,L.M. (2000) Single-nucleotide polymorphism analysis by MALDI-TOF mass spectrometry. Trends Biotechnol., 18, 77–84. [DOI] [PubMed] [Google Scholar]
- 12.Ross P., Hall,L., Smirnov,I. and Haff,L. (1998) High level multiplex genotyping by MALDI-TOF mass spectrometry. Nat. Biotechnol., 16, 1347–1351. [DOI] [PubMed] [Google Scholar]
- 13.Li J., Butler,J.M., Pollart,D.J., Monforte,J.A. and Becker,C.H. (1999) Single nucleotide polymorphism determination using primer extension and time-of-flight mass spectrometry. Electrophoresis, 20, 1258–1265. [DOI] [PubMed] [Google Scholar]
- 14.Haff L.A. and Smirnov,I.P. (1997) Single-nucleotide polymorphism identification assays using a thermostable DNA polymerase and delayed extraction MALDI-TOF mass spectroscopy. Genome Res., 7, 378–388. [DOI] [PMC free article] [PubMed] [Google Scholar]
- 15.Haff L.A. and Smirnov,I.P. (1997) Multiplex genotyping of PCR products with mass tag-labeled primers. Nucleic Acids Res., 25, 3749–3750. [DOI] [PMC free article] [PubMed] [Google Scholar]
- 16.Little D.P., Braun,A., Darenhofer-Demar,B. and Koster,H. (1997) Identification of apolipoprotein E polymorphisms using temperature cycled primer oligo base extension and mass spectrometry. Eur. J. Clin. Chem. Clin. Biochem., 35, 545–548. [PubMed] [Google Scholar]
- 17.Little D.P., Braun,A., Darenhofer-Demar,B., Frilling,A., Li,Y., McIver,R.T.,Jr and Koster,H. (1997) Detection of RET proto-oncogene codon 634 mutations using mass spectrometry. J. Mol. Med., 75, 745–750. [DOI] [PubMed] [Google Scholar]
- 18.Braun A., Little,D.P. and Koster,H. (1997) Detecting CFTR gene mutations by using primer oligo base extension and mass spectrometry. Clin. Chem., 43, 1151–1158. [PubMed] [Google Scholar]
- 19.Sun X., Ding,H., Hung,K. and Guo,B. (2000) A new MALDI-TOF based mini-sequencing assay for genotyping of SNPS. Nucleic Acids Res., 28, e68. [DOI] [PMC free article] [PubMed] [Google Scholar]
- 20.Fei Z., Ono,T. and Smith,L.M. (1998) MALDI-TOF mass spectrometric typing of single nucleotide polymorphism with mass-tagged dNTPs. Nucleic Acids Res., 26, 2827–2828. [DOI] [PMC free article] [PubMed] [Google Scholar]
- 21.Fei Z. and Smith,L.M. (2000) Analysis of single nucleotide polymorphisms by primer extension and matrix-assisted laser desorption/ionization time-of-flight mass spectrometry. Rapid Commun. Mass Spectrom., 14, 950–959. [DOI] [PubMed] [Google Scholar]
- 22.Laken S.L., Jackson,P.E., Kinzler,K.W., Vogelstein,B., Strickland,P.T., Groopmar,J.D. and Friessen,M.D. (1998) Genotyping by mass spectrometric analysis of short DNA fragments. Nat. Biotechnol., 16, 1352–1356. [DOI] [PubMed] [Google Scholar]
- 23.Chen X., Fei,Z., Smith,L.M., Bradbury,E.M. and Vahidi,M. (1999) Stable-isotope-assisted MALDI-TOF mass spectrometry for accurate determination of nucleotide compositions of PCR products. Anal. Chem., 71, 3118–3128. [DOI] [PubMed] [Google Scholar]
- 24.Chamberlain J.S., Boehnke,M., Frank,T.S., Kiousis,S., Xu,J. and Guo,S.W. (1993) BRCA1 maps proximal to D17S579 on chromosome 17q21 by genetic analysis. Am. J. Hum. Genet., 52, 792–798. [PMC free article] [PubMed] [Google Scholar]
- 25.Ford D., Easton,D.F., Stratton,M., Narod,S., Goldgar,D. and Devilee,P. (1998) Genetic heterogeneity and penetrance analysis of the BRCA1 and BRCA2 genes in breast cancer families. The Breast Cancer Linkage Consortium. Am. J. Hum. Genet., 62, 676–679. [DOI] [PMC free article] [PubMed] [Google Scholar]
- 26.Martin A.M. and Weber,B.L. (2000) Genetic and hormonal risk factors in breast cancer. J. Natl Cancer Inst., 92, 1126–1135. [DOI] [PubMed] [Google Scholar]