

SUMMARY
Organisms must execute metabolic defenses to survive nutrient deprivation. We performed a genome-wide RNAi screen in Caenorhabditis elegans to identify fat regulatory genes indispensable for starvation resistance. Here we show that opposing proteostasis pathways are principal determinants of starvation survival. Reduced function of cytoplasmic amino-acyl tRNA synthetases (ARS) increases fat mass and extends starvation survival, whereas reduced proteasomal function reduces fat and starvation survival. These opposing pathways converge on AMP-activated protein kinase (AMPK) as the critical effector of starvation defenses. Extended starvation survival in ARS deficiency is dependent upon increased proteasome-mediated activation of AMPK. When the proteasome is inhibited, neither starvation nor ARS deficiency can fully activate AMPK, leading to greatly diminished starvation survival. Thus, activity of the proteasome and AMPK are mechanistically linked and highly correlated with starvation resistance. Conversely, aberrant activation of the proteostasis-AMPK axis during nutritional excess may have implications for obesity and cardiometabolic diseases.
eTOC BLURB
Using a genome-wide screen for fat regulatory genes in C. elegans, Webster et al. define a proteostasis-AMPK signaling axis that is central to organismal starvation defenses. The results suggest that enhanced survival under elevated proteasome activity is due to AMPK activation and not to increased fuel availability.
INTRODUCTION
Starvation is among the most ancient of selection pressures. In response to repeated cycles of nutrient deprivation, organisms have evolved elaborate defenses that permit survival through periods of starvation. A major starvation defense is the ability to store long-term energy stores as triglyceride (Hardie, 2012; Viscarra and Ortiz, 2013). In humans, the majority (85%) of available energy is stored as adipose triglyceride, even in normal weight individuals (Cahill et al., 1968; Saudek and Felig, 1976). Perhaps the best evidence that adipose triglyceride stores represent a starvation defense is a report that obese individuals can survive for nearly 1 year under total starvation without complications (Thomson et al., 1966).
Total body protein also undergoes cyclic changes with periods of fasting and feeding (Millward et al., 1996), but a far more modest amount of available calories are present in body protein. Further, liberating these calories can be achieved, but with the potential for great harm (Cahill et al., 1968; Saudek and Felig, 1976). Indeed death from starvation occurs in humans when approximately half of body protein stores have been depleted (Garrow et al., 1965).
These observations indicate that it is not only lipid metabolism that is critical for starvation defense, rather orchestration of both protein and lipid anabolism and catabolism. In multicellular organisms, this balance is achieved in part by changes in endocrine signals that signal nutrient adequacy. One major signal indicating nutrient adequacy across phylogeny is the insulin/insulin-like growth factor (IGF) signaling pathway. Whether more ancient systems exist to orchestrate starvation defenses remains an open question.
The highly conserved, cellular energy sensing serine-threonine protein kinase, AMPK, activates catabolic pathways when nutrients are scarce (Hardie, 2011; Viollet et al., 2003). In response to signals indicating nutrient sufficiency, AMPK is inhibited, restraining lipid oxidation and protein salvage pathways (Cuervo et al., 2005; Kang et al., 2007; Singh et al., 2009). Alternatively, when cellular AMP to ATP ratio rises, AMPK is activated, curtailing energy intensive processes such as lipogenesis and activating lipid catabolism, proteolysis, and starvation defenses (Viollet et al., 2003; Viollet et al., 2009; Cunningham et al., 2014; Narbonne and Roy, 2009).
In spite of advances in our understanding of signaling pathways that modulate anabolism and catabolism, comprehensive understanding of the genetic landscape regulating starvation resistance in multicellular organisms is lacking. In the present study, we identify a starvation defense system that links proteostasis to lipid metabolism, through a validated genome-wide RNA interference (RNAi) screening methodology for studying fat mass in C. elegans (Pino et al., 2013). Prior screens for fat regulators in the worm (Ashrafi et al., 2003), while illuminating, suffered from methodological difficulties whereby fluorescent dyes fed to living worms were primarily localized to the acidified lysosome related organelle rather than to lipid droplets, thus complicating the discovery of true lipid regulators (Brooks et al., 2009; O’Rourke et al., 2009; Yen et al., 2010). Here we describe an elaborate interplay between proteostasis and lipid metabolism that enables starvation resistance through efficient storage and utilization of energy rich triglyceride. Inactivation of any of the entire complement of cytoplasmic amino-acyl tRNA synthetases (ARS genes) leads to a massive, 200–400% increase in triacylglycerol stores, increased lipid synthesis, decreased lipid oxidation, and a doubling to tripling of starvation survival. Conversely, we identify the 26S proteasomal machinery, one of two major proteolytic mechanisms in starvation (Finn and Dice, 2006), as being indispensible for normal accrual of fat mass and defense against starvation. We find that increased starvation survival upon ARS gene RNAi is strictly dependent upon increased proteasomal activity, and further, completely abolished upon inhibition of AMPK. Strikingly, altered proteasomal activity governs starvation survival not through direct provision of essential energy and nutrients by protein turnover but through acting as a critical, upstream regulator of AMPK. These results highlight the complexity of starvation defenses, and identify cross talk between ancient genetic systems involved in proteostasis, long-term triglyceride energy stores, and starvation defenses activated by the master energy sensor AMPK.
RESULTS
Genome-Wide RNAi Screen Identifies Protein Translation and Proteasome Genes as Reciprocal Regulators of Whole-Body Fat Mass
We conducted a quantitative screen using a validated, lipid staining technique for gene knockdowns that impact body fat mass with RNAi libraries which target greater than 94% of the C. elegans genome (Kamath et al., 2003; Kim et al., 2005; Pino et al., 2013). With a tiered screening strategy, we identified 514 RNAi (targeting 475 unique genes) that cause significantly increased or decreased fat staining (Figure 1A). Three hundred eighty-six RNAi clones increased fat mass, whereas 128 RNAi clones decreased fat mass (Figure 1A, Table S1). All RNAi clones were sequence verified.
Figure 1. Genome-Wide RNAi Screen Identifies Enrichment of High Fat Aminoacyl tRNA Synthase (ARS) Genes.
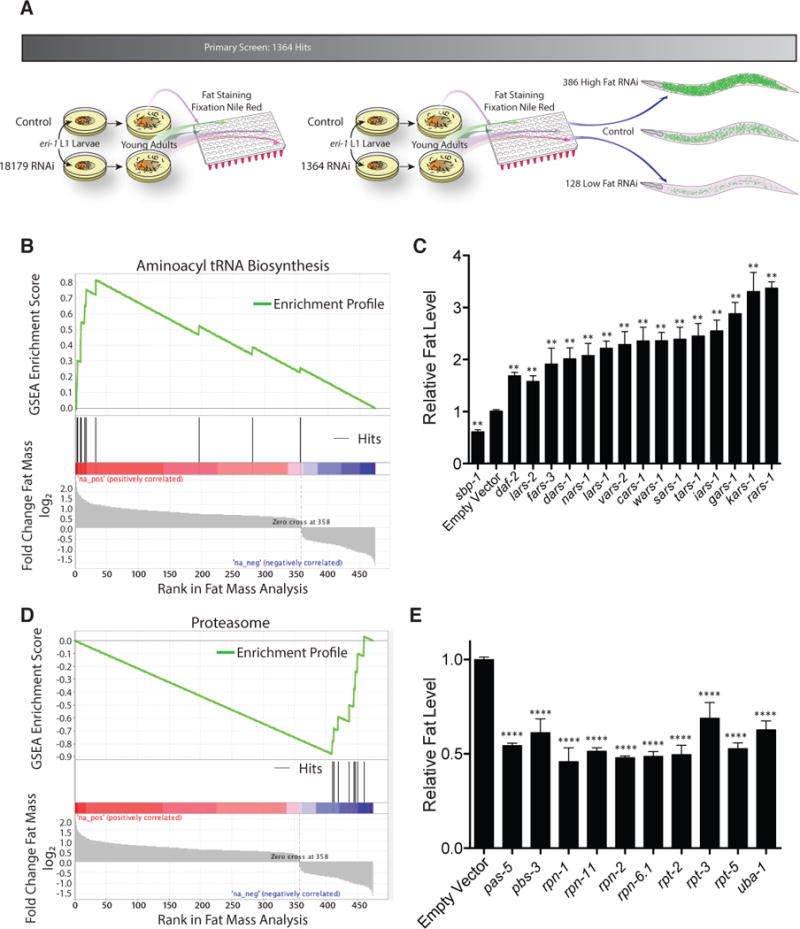
(A) Schematic of genome-wide RNAi screen completed in eri-1 animals and summary of results. See also table S1.
(B) GSEA using KEGG identifiers indicates a significant enrichment of ARS genes among high fat-inducing RNAi clones. See also table S2.
(C) Fat levels as indicated by fixation Nile red staining for RNAi of the 14 ARS genes emerging from the full-genome screen in wild-type animals relative to empty vector RNAi. Low fat sbp-1 and high fat daf-2 controls are shown. **, P < 0.01 vs. empty vector by t-test with Bonferroni-Holm correction (n > 5 biological replicates). See also Figure S1.
(D) GSEA of rank-ordered fat screen genes indicates a significant enrichment of proteasomal catalytic and regulatory subunit encoding genes among low fat-inducing RNAi clones. See also table S3.
(E) Fat levels as indicated by fixation Nile red staining for RNAi of 10 proteasomal genes identified in the full-genome screen in wild-type animals relative to empty vector RNAi. ****, P < 0.0001 vs. empty vector by t-test with Bonferroni-Holm correction (n = 3 biological replicates).
The screening strategy was validated by recovery of low fat RNAi corresponding to genes known to positively regulate lipogenesis such as sbp-1 (sterol regulatory element-binding protein-1), pod-2 (acetyl-CoA carboxylase), and fasn-1 (fatty acid synthase) (Table S1) (McKay et al., 2003). Using a KEGG-based classification system for gene-set enrichment analysis (GSEA, Falk et al., 2008; Huang da et al., 2009), we identified RNAi to amino-acyl-tRNA synthetases as the most overrepresented pathway within the dataset causing elevated fat mass (Figures 1B and 1C, Table S2). Conversely, RNAi to core proteasome components were the most overrepresented class among low-fat gene inactivations (Figures 1D and 1E, Table S3). Other overrepresented classes included purine and pyrimidine synthesis genes among high fat-inducing RNAi and oxidative phosphorylation genes among low fat-inducing RNAi (Tables S2 and S3).
Strikingly, 14 of 21 cytoplasmic amino-acyl tRNA synthetases (subsequently referred to as ARS genes), whose canonical cellular role is to charge the tRNA molecule with its cognate amino acid (Ibba and Soll, 2000), emerged as high-fat inducing RNAi (Figure 1C). We confirmed an increase in triacylglycerol stores using quantitative biochemical analysis of lipids in animals treated with wars-1 RNAi and animals bearing a temperature sensitive mutation in vars-2 (Figure S1A, vars-2(bn2ts) also known as glp-4) (Rastogi et al., 2015). We similarly witnessed an increase in fat when worms were treated with the translation elongation inhibitor cycloheximide (Figure S1B) (Schneider-Poetsch et al., 2010).
Proteasomal gene inactivations were among the most statistically enriched functional classes contributing to low fat mass. The ubiquitin proteasome system (UPS) serves as a key cellular degradation pathway required to maintain proteostasis (Lee et al., 2013). RNAi of members of 5 different classes of the UPS, belonging to the α-type subunits, β-type subunits, the 19S non-ATP regulatory subunit, AAA ATPase subunits along with a ubiquitin activating enzyme, leads to significant reduction in lipid accumulation (Figure 1E). Exposure to the proteasomal inhibitor bortezomib also leads to significant reductions in fat mass (Figure S1C). These data suggest that protein synthesis and protein breakdown are opposing proteostasis pathways that antagonistically regulate normal triglyceride stores.
Inactivation of Amino-acyl tRNA Synthetases Protects Against Fat Mass Loss During Starvation and Exercise
To determine which of our fat regulatory genes played a role in mobilizing triacylglycerol stores in response to nutrient deprivation, we inactivated our 475 fat regulatory genes by RNAi from early larval development to young adulthood in wild type C. elegans, thereafter subjecting animals to starvation and exercise in minimal media, or pure starvation (by including the chemical paralytic 2,3-butanedione monoxime which prevents muscle contraction) (Figure 2A). Starvation or starvation plus exercise for 16 hours are sufficient to reduce fat mass in control animals by 23% and 42%, respectively (Figure S2A).
Figure 2. Inactivation of ARS and UPS Genes Has Opposing Effects on Fat Mass.
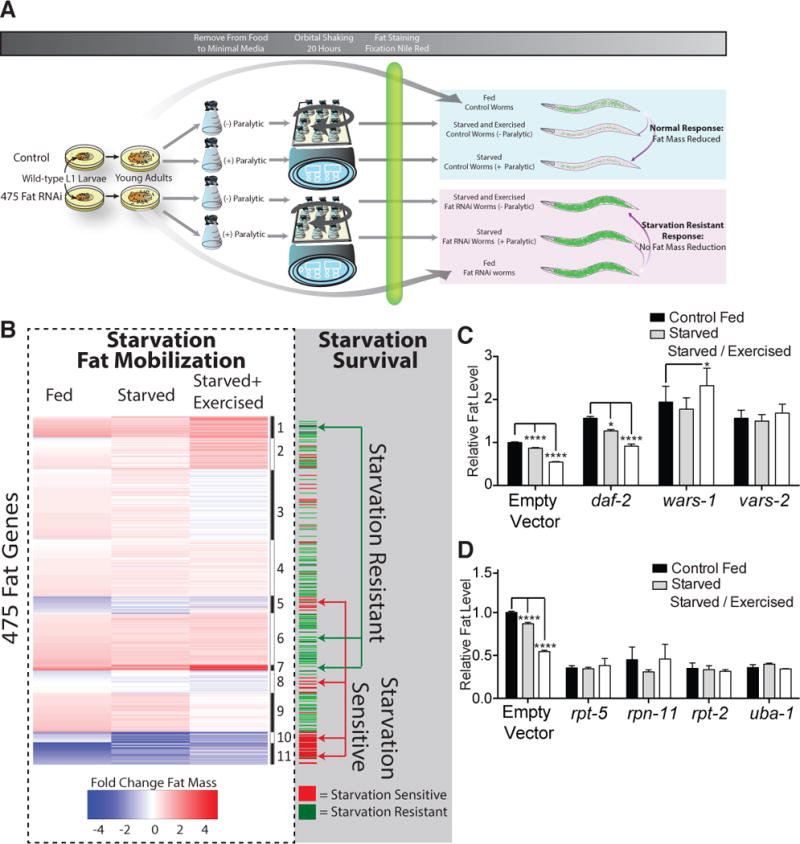
(A) Schematic workflow of secondary RNAi screen in wild type animals for starvation-based fat mobilization.
(B) k-means clustering of 475 fat-regulatory genes into 11 groups based on fixative Nile red fat levels in conditions of fed, starved (with paralytic), or starved and exercised (no paralytic) (left, within dashed line). The alternating black and white bar to the right of the heatmap indicates cluster divisions. Immediately adjacent are the results from longitudinal starvation survival analysis, with red indicating shortened starvation survival and a green indicating extended starvation survival (right, within shaded area). Starvation resistant and starvation sensitive gene clusters are shown. See also Figure S2 and Table S4.
(C) Fat levels by fixative Nile red fat staining of wild-type animals treated with RNAi against empty vector, the insulin-like receptor daf-2, tryptophanyl-tRNA synthetase wars-1, or valyl-tRNA synthetase vars-2, under fed, starved, or starved and exercised conditions. *, P < 0.05; **** P < 0.01 by 2-way ANOVA with Bonferroni correction. Bars represent mean ± SEM n = 6 biological replicates.
(D) Fat levels by fixative Nile red fat staining of wild-type animals treated with RNAi to empty vector, the indicated proteasome regulatory genes (rpn and rpt), or ubiquitin E1 ligase uba-1, under fed, starved, or starved and exercised conditions. **** P < 0.0001 by 2-way ANOVA with Bonferroni correction. Bars represent mean ± SEM n = 3 biological replicates.
As we conducted this analysis in wild type animals, this also provided the opportunity to analyze concordance of RNAi fat phenotypes between the initial screen in eri-1 animals and wild type animals in the fed state. Overall, 78% of fat regulatory gene RNAi show identical directionality between eri-1 and N2 wild type animals. Linear regression analysis indicates a highly significant positive correlation between values obtained in N2 wild type versus eri-1 fat levels (R2 0.53, P < 0.0001). Effects of any given RNAi on fat mass are less pronounced in wild type versus eri-1 (slope = 0.4975 ± 0.02071 wild type vs. eri-1). However, given that eri-1 and wild type animals have differing efficiencies of RNAi across tissues (Kennedy et al., 2004), divergent results may point to cell-type specific effects.
Fat mass data from wild type fed, starved, and starved and exercised animals with each RNAi were organized into 11 distinct groups by k-means clustering. Two clusters of gene knockdowns exhibited elevated fat mass in the fed state and resistance to starvation-mediated decreases in fat (Clusters 1 and 7, Figure 2B, Figure S2B, and Table S4). These clusters contained the entire membership of cytoplasmic ARS genes previously identified to be high fat-inducing in our primary screen (Figures 2B, 2C, and S2C, Table S4). We confirmed that increased fat mass fails to decrement with starvation following ARS gene RNAi by lipid staining and quantitative lipid biochemistry (Figures S2D and S2E). This response was not a general feature of all high-fat states, as animals deficient in insulin receptor ortholog daf-2 have elevated triacylglycerol mass at baseline but showed the predicted decrement in fat mass upon starvation (Figure 2C).
We next hypothesized that fat regulatory gene inactivations would be enriched for those that impact starvation survival. Accordingly, following 3 days of RNAi from the synchronous L1 larval stage, wild type animals were washed free from food, subjected to starvation in minimal media and examined at the onset of and at 2 discreet timepoints of starvation, one at day five (when virtually no vector RNAi treated animals are dead) and another at day 19 of starvation (when more than 99% of vector RNAi treated animals are dead). Over 40% of genes showed some alteration in starvation survival versus vector control at these two screening time points (Figure 2B, Table S4). Many RNAi exhibiting extended starvation survival grouped in clusters also exhibited more judicious rationing of fat mass (Figure 2B, “Starvation Resistant” clusters). Alternatively, more than 70% of genes in low-fat clusters, which includes UPS genes, exhibited diminished starvation survival (Figures 2B and 2D, “Starvation Sensitive” clusters).
Inactivation of Amino-acyl tRNA Synthetases Prolongs Starvation Survival
Longitudinal starvation survival analysis indicated that starvation survival is increased up to nearly triple the mean of control animals upon RNAi of tryptophanyl-tRNA synthetase (wars-1), valyl-tRNA synthetase (vars-2), and lysyl-tRNA synthetase (kars-1) (Figure 3A, Table S5). Genetic inactivation of vars-2 similarly increased starvation survival (Figure 3B, Table S5). None of the ARS RNAi tested led to prolongation of lifespan under fed conditions except for a 12.9% increase for wars-1 RNAi (Figure S3A and Table S6), that paled in comparison to the ~150% increase in starvation survival, indicating a starvation survival advantage specific to starvation. Following inactivation of wars-1 by RNAi, we observed a 40% decrease in oxygen consumption (Figure S3B) and a concomitant increase in fatty acid synthase (fasn-1) mRNA, consistent with increased lipid synthesis (Figure S3C). These changes occurred without an increase in food consumption rate, as indicated by pharyngeal pumping rate (Figure S3D). A small but significant decrease in pharyngeal pumping is seen in ARS deficient animals, which could indicate negative feedback in the face of high body fat mass stores.
Figure 3. Inactivation of Proteostasis Machinery Results in Altered Starvation Survival.
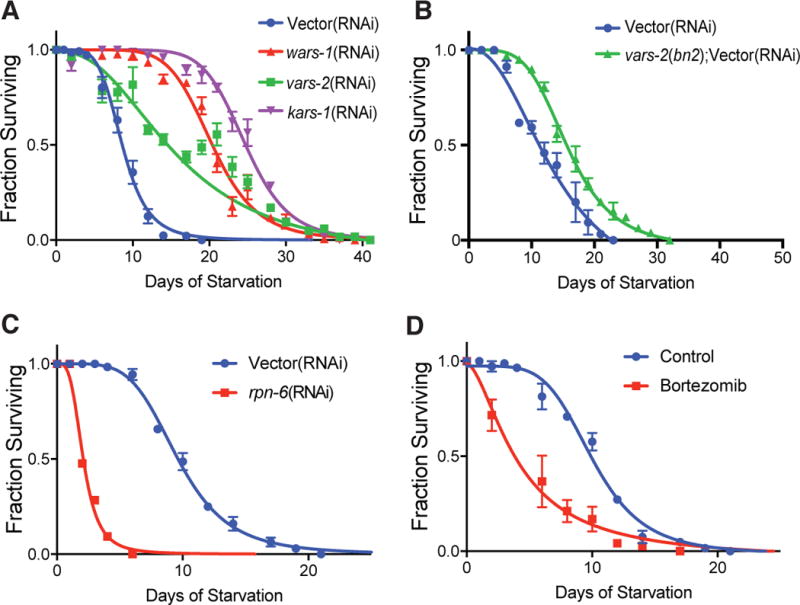
(A) Starvation survival in minimal media of wild-type animals treated with empty vector, wars-1, vars-2 or kars-1 RNAi and fed ad libitum to the L4 larval stage prior to starvation onset.
(B) Starvation survival in minimal media of wild-type animals or vars-2(bn2ts) mutants treated with empty vector RNAi and fed ad libitum fed to the L4 stage.
(C) Starvation survival in minimal media of wild-type animals treated with empty vector RNAi or RNAi to proteasome regulatory subunit rpn-6.1 and fed ad libitum to the L4 stage.
(D) Starvation survival in minimal media of wild-type animals fed ad libitum with E. coli OP50 until the young adult stage, then washed into minimal media containing 5 μg/ml bortezomib or vehicle control.
For all graphs, bars represent mean ± SEM. n > 30 worms/time point measurement, points represent mean of 2–5 biological replicates. All ARS, UPS, and bortezomib curves are statistically different from control other by linear regression analysis. See also Figure S3 and Table S5 experiments 1–5 for tabular data, replicates, and statistical analysis.
As translation consumes approximately 25–35% of cellular energy stores (Rolfe and Brown, 1997; Siems et al., 1992), we surmised that the excess fat mass of ARS deficient animals would be dependent upon excess cellular reducing power and energy. To address this we treated control and ARS deficient animals with the mitochondrial uncoupling agent dinitrophenol (DNP). DNP treated control and ARS deficient animals both demonstrate a proportionally equivalent, dose-dependent decrease in fat mass, suggesting that excess protonmotive force at the level of the mitochondrion is partially, but not entirely responsible for high fat mass in ARS deficiency (Figure S3E). Finally, day 1 starved adults treated with vector RNAi show a marked extension in starvation survival that is exaggerated further upon inactivation of kars-1 when compared to identically treated animals starved at the L4 developmental stage (Figure S3F). Thus, while developmental stage at the onset of starvation is important in determining starvation survival, ARS deficiency extends survival irrespective of the paradigm used.
Inactivation of Ubiquitin-Proteasome Genes Shortens Starvation Survival
The very low fat mass resulting from UPS gene inactivation (Figures 1D and 1E) screen level data indicating shortened starvation survival (Figure 2B, Clusters 10–11, and Table S4) led us to more closely study the role of the proteasome in starvation resistance. Longitudinal starvation analysis of animals treated with RNAi to regulatory proteasome subunit rpn-6 indicated nearly 80% shortening of mean starvation survival versus vector control (Figure 3C and Table S5). We reasoned that bortezomib should similarly reduce starvation resistance, and acute treatment would allow us to examine starvation survival without potential negative pleiotropic effects on development. Indeed, acute inhibition of bortezomib at adulthood, 6 hours prior to initiation of starvation led to ~60% shortening of mean starvation survival (Figure 3D, Table S5).
Metabolic Shifts in ARS Deficient Animals Are Distinct from Canonical Nutrient and Stress Sensing Pathways
Ablation of germline stem cells in C. elegans leads to high fat mass and increased longevity in a manner dependent upon the FoxO ortholog daf-16 (Hsin and Kenyon, 1999; Lapierre et al., 2011). Temperature sensitive mutation in the vars-2 gene also leads to relative deficiency in germline stem cells (Beanan and Strome, 1992). To determine whether the increase in fat mass and starvation defense is similarly dependent upon loss of germline stem cells in ARS inactivated animals, we performed RNAi against ARS genes in daf-16 null mutant animals. In contrast to daf-2/insulin receptor deficient animals, which require daf-16/FoxO for elevated fat mass, fat mass remains elevated in ARS deficient animals lacking daf-16 (Figures 4A and S4A). Additionally, while fat mass in germline stem cell deficient glp-1 mutants (Priess et al., 1987), is daf-16 dependent, the elevated lipid mass of daf-16;vars-2 double mutant animals remains as high as vars-2 single mutants (Figure 4B). RNAi knockdown of canonical metabolic mediators and genes involved in insulin/PI3 kinase signaling, hypoxia signaling, and stress responses did not suppress the high triacylglycerol phenotype of ARS deficient animals (Figure S4B and Table S7). In aggregate, these data suggest the metabolic shift evident in ARS deficient animals is not dependent upon these metabolic regulatory pathways or the germline-mediated response.
Figure 4. ARS-Deficient Starvation Defense Pathway Is Independent of the Germline-Mediated Response Or Proteostasis Machinery Operates Independently of the Germline-Mediated response.
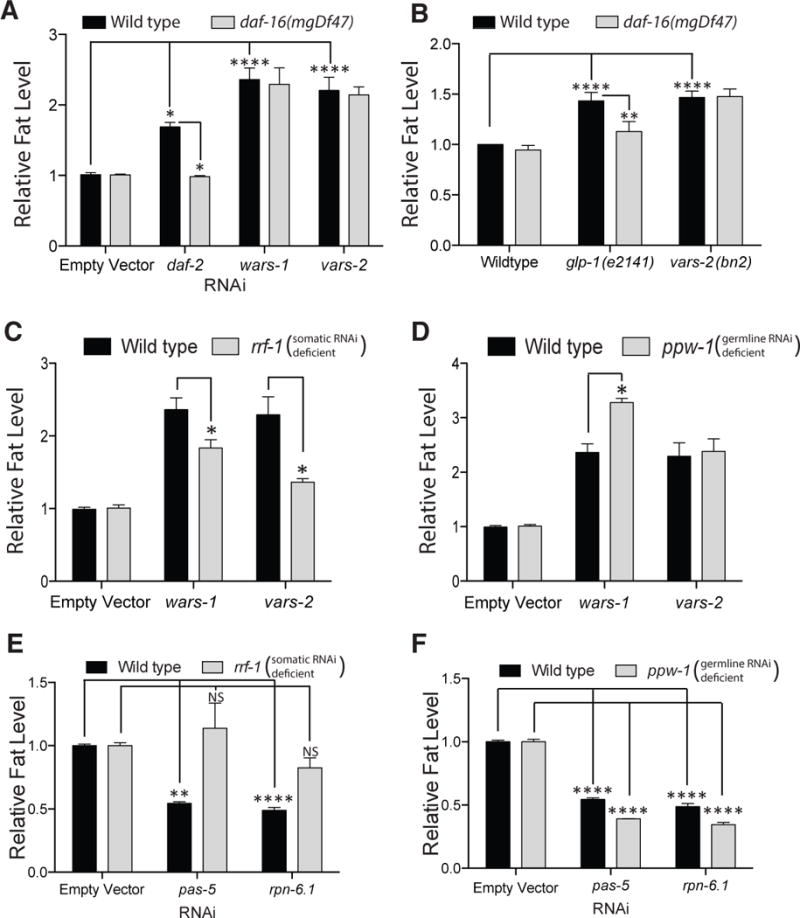
(A) Fat levels by fixative Nile red staining in wild-type and daf-16(mgDf47) animals treated with empty vector RNAi, or RNAi targeting daf-2, wars-1, or vars-2. See also Figure S4.
(B) Fat levels by fixative Nile red staining in wild-type animals and loss of function mutants in daf-16(mgDf47), alone or in combination with glp-1(e2141) and vars-2(bn2ts).
(C and D) Fat mass in loss of function mutants rrf-1 and ppw-1 treated from the L1 stage with empty vector, wars-1, or vars-2 RNAi.
(E and F) Fat mass in loss of function mutants rrf-1 and ppw-1 treated from the L1 stage with empty vector, pas-5, or rpn-6.1 RNAi.
For A–F, Bars represent mean ± SEM, n = 3–6 biological replicates. * P < 0.05, ** P < 0.01, **** P < 0.0001 by 2-way ANOVA Bonferroni corrected for multiple hypothesis testing.
Opposing ARS and UPS Pathways Exert Metabolic Effects via Action in Somatic Tissues
A compelling possibility is that the ARS and UPS genes exert opposing metabolic effects via action in the same tissues. To test this possibility and to gain insight as to the site of action of ARS and UPS genes in metabolic regulation, we made use of a mutation in the rrf-1 gene, which encodes an RNA-directed RNA polymerase required for the somatic but not germline actions of RNAi (Sijen et al., 2001). Fat levels of animals with ARS genes inactivated were decreased in rrf-1 mutants, suggesting that reduced levels of ARS gene function were necessary in somatic tissues to trigger this starvation defense pathway (Figure 4C). This change occurred in rrf-1 mutant animals despite preservation of moderate somatic and normal germline RNAi competency (Kumsta and Hansen, 2012). We also tested a ppw-1 mutant, which fail to produce a PAZ/PIWI-domain containing protein required for efficient germline RNAi (Tijsterman et al., 2002). The lipid levels of ARS deficient animals remained elevated in ppw-1 mutants, confirming the essential lipid-regulatory role of ARS in the soma (Figure 4D).
We next performed UPS gene inactivation in the rrf-1 and ppw-1 mutant genetic backgrounds to identify the site of action of proteasomal genes. In an identical fashion to ARS gene inactivation, RNAi of UPS genes pas-5 and rpn-6.1 no longer led to significant decreases in fat mass when somatic RNAi efficiency is blunted, as in the rrf-1 mutant (Figure 4E). Confirming that these effects are not via action in germline stem cells, UPS gene RNAi reduced fat mass in a ppw-1 mutant in a fully penetrant manner (Figure 4F).
26S Ubiquitin Proteasome Activity is Central to Starvation Defense
Given the common site of action of ARS and UPS genes in somatic tissues, we next examined mechanistic connections between the two pathways. Since low proteasomal activity leads to low fat mass and is detrimental to starvation survival (Figure 2D, 3C), it logically follows that increased activity might provide greater resistance to starvation. We tested this by asking first whether gene knockdowns of the high fat ARS genes lead to an increase in proteasomal catalytic activity. Extracts of animals after short-term gene inactivation of vars-2 and kars-1 led to a significant increase in chymotrypsin-like and caspase-like proteasomal activities (Figures 5A and 5B), while trypsin-like activity, did not show a significant increase (Figure 5C). All demonstrable proteasomal activity was suppressible by addition of the proteasomal inhibitor MG132 (data not shown).
Figure 5. The 26S Proteasome Operates Functionally Downstream of the ARS for Starvation and Fat Mass.
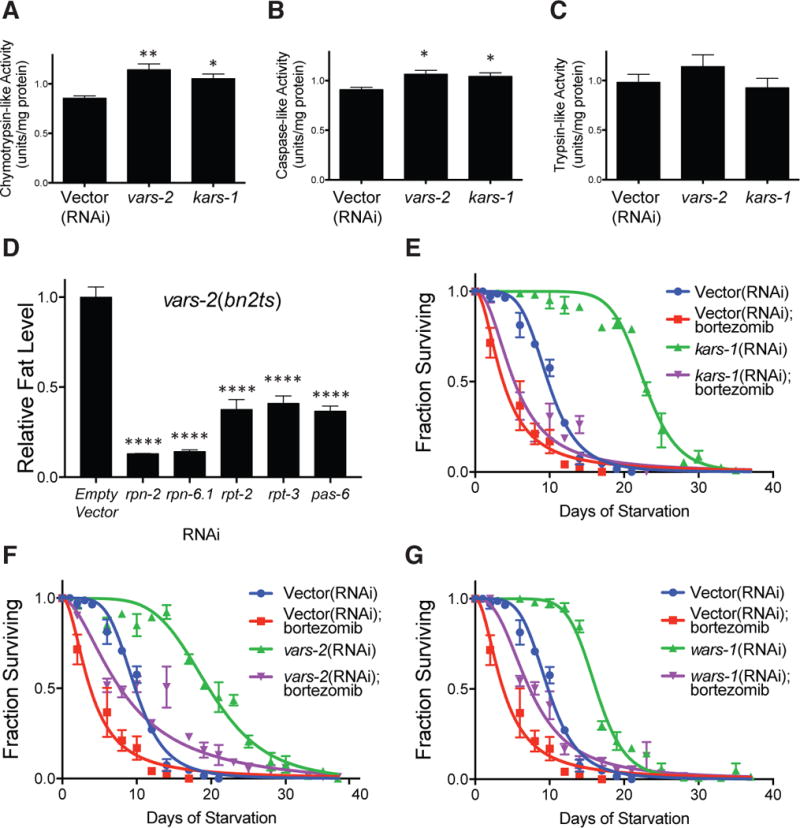
(A–C) Proteasomal chymotrypsin-like (A), caspase-like (B), and trypsin-like (C) activity measurements from lysates of L3 larval stage animals treated for 18 hours with empty vector, vars-2 and kars-1 RNAi and fed ad libitum. n = 3 biological replicates. *, P < 0.05, **, P < 0.01, by one-way ANOVA.
(D) Fat levels as indicated by fixative Nile Red staining in vars-2(bn2ts) mutant animals treated with empty vector, rpn-2, rpn-6.1, rpt-2, rpt-3 and pas-6 RNAi from L1 stage. n = 3 biological replicates. **** P < 0.0001 by one-way ANOVA.
(E–G) Starvation survival in minimal media of wild-type animals treated with empty vector and kars-1, vars-2 or wars-1 RNAi with and without the proteasomal inhibitor bortezomib (5 μg/ml). Animals were treated with the indicated RNAi and fed ad libitum to the L4 stage prior to starvation onset. See also Table S5 experiments 3–5 for tabular data, replicates, and statistical analyses.
All bars represent mean ± SEM.
These data suggest a genetic relationship between the ARS and UPS systems, moreover that the UPS might be epistatic to beneficial effects seen in ARS RNAi animals. To determine the nature of this relationship, vars-2(bn2ts) mutants were treated with RNAi to genes encoding proteasomal regulatory and catalytic subunits. The elevated fat mass of vars-2 mutants was suppressed by knocking down the genes encoding UPS subunits (Figure 5D). These data confirm that the UPS is epistatic to high fat mass seen upon inactivation of ARS genes.
To determine whether the epistasis extended to starvation survival, we performed a starvation survival analysis on ARS RNAi animals treated with bortezomib. As we previously found, RNAi knockdown of kars-1, vars-2 or wars-1 leads to significant increases in starvation longevity as compared to control (Figures 5E–G and Table S5). Inhibition of the proteasome with bortezomib significantly, and in some cases completely reversed the extended starvation survival witnessed with ARS gene knockdown (Figures 5E–G and Table S5). The most potent ARS gene knockdown, kars-1, nearly triples starvation survival, and is unable to do so when animals are treated with bortezomib (Figure 5E). This data places the proteasome downstream of the ARS genes in a genetic pathway critical to organismal starvation defenses.
Proteostasis Pathways Modulate Starvation Survival Through Regulation of AMPK
Our observation that the uncoupling agent DNP was unable to fully reverse metabolic shifts in ARS knockdown to a greater extent than it does in wild type animals (Figure S3E), suggests that the proteasome activates starvation defenses through additional mechanisms, rather than scavenging proteins to be used as cellular fuels. AMPK is a master sensor of cellular energy levels that is well poised to activate cellular starvation defenses. In order to determine whether the proteasome is mechanistically coupled to AMPK activation and subsequent starvation defenses, we exposed a population of animals to 24-hours of starvation with and without treatment with bortezomib. This period of starvation is sufficient to increase phosphorylation of the alpha subunit of AMPK on the homologous residue to mammalian threonine 172 (p-αAMPKT172, corresponding to T243 in AAK-2 isoform CE31222), a required A-loop activating site phosphorylated in mammals by the upstream kinase Lkb1 (Figures 6A and 6C) (Shaw et al., 2004; Woods et al., 2003). Treatment with bortezomib completely blunts the starvation-mediated phosphorylation of p-αAMPKT172, indicating that proteasomal activity acts as an essential upstream activator of AMPK in the response to starvation (Figures 6A and 6C).
Figure 6. ARS Regulate Starvation Survival Through Activation of AMPK by Way of the 26S Proteasome.
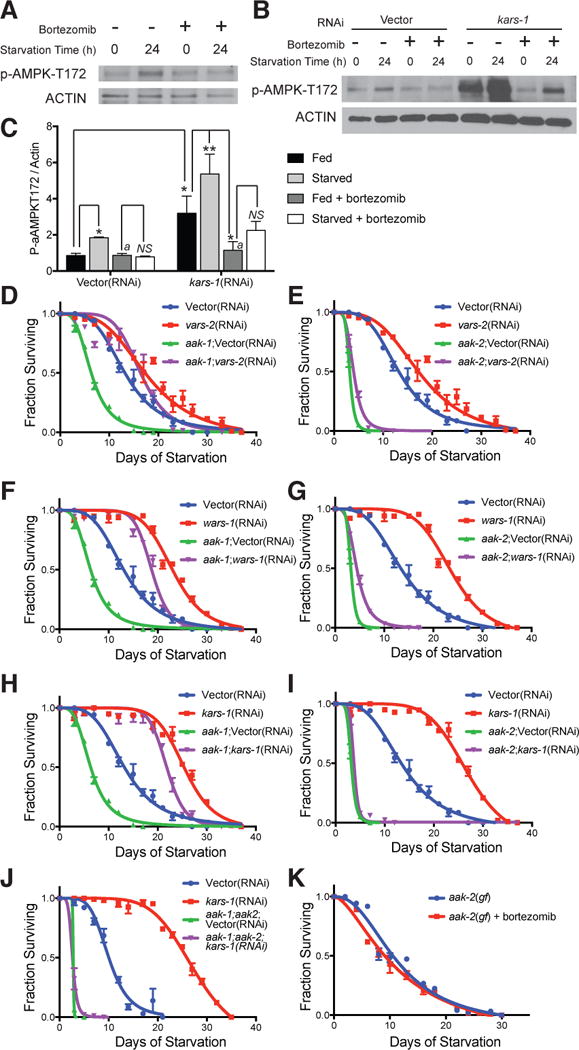
(A) Fed and 24-hour starved worms with and without treatment with bortezomib (5 μg/ml for 6 hours prior to starvation and during the starvation period) were analyzed by western blotting for activated p-AMPK-T172. Actin is shown as a loading control. Blots shown are representative of biological triplicate analysis.
(B) Western Blot analysis of wild type animals treated with empty vector or kars-1 RNAi and fed ad libitum to L4 stage, then exposed to a 0 hour or 24 hour minimal media starvation with or without bortezomib treatment (as in A). Actin serves as a loading control for p-AMPK-T172. Data for triplicate analysis are quantified in C.
(C) Quantification of biological replicate analyses from (B) using densitometry. Bars represent mean ± SEM. n = 3 biological replicates. *, P < 0.05, **, P < 0.01, NS, not significant, by two-way ANOVA. Bars marked with “a” are not significantly different from each other.
(D, F and H) Starvation survival in minimal media of wild-type and aak-1 mutant animals, a homologue of the alpha subunit of AMPK, treated with empty vector, vars-2, wars-1 or kars-1 RNAi and fed ad libitum to the L4 larval stage prior to starvation onset.
(E, G and I) Starvation survival in minimal media of wild-type and aak-2 mutant animals, a second homologue of the alpha subunit of AMPK, treated with empty vector, vars-2, wars-1 or kars-1 RNAi and fed ad libitum to the L4 larval stage prior to starvation onset.
(J) Starvation survival in minimal media of wild-type and aak-1;aak-2 double mutant animals, treated with empty vector or kars-1 RNAi to the L4 larval stage prior to starvation onset.
(K) Starvation survival in minimal media of C. elegans strain AGD467, a transgenic strain carrying a gain of function aak-2 isoform with and without bortezomib treatment (5 μg/ml). For D–K see also Table S5 experiments 6–10 for tabular data, replicates, and statistical analyses.
As proteasomal activity is increased in ARS-deficient animals, we anticipated increased activation of AMPK following ARS gene knockdown. A profound and significant increase in p-αAMPKT172 was observed in animals treated with RNAi to the kars-1 gene, which was further augmented by starvation (Figure 6B, 6C). As expected, proteasomal inhibition with bortezomib prevented the ARS- and starvation-mediated increases in p-αAMPKT172.
To address our hypothesis that AMPK sits genetically downstream of the ARS genes, we analyzed starvation survival in, AMPK (aak-1 and aak-2) mutant animals with gene inactivation of vars-2, wars-1, and kars-1 (Figures 6D–6I and Table S5). While knockdown of each ARS gene provides parallel starvation survival advantage to both control and aak-1 mutant animals, loss of aak-2 leads to severe deficiency in starvation survival, and prevents any increase in starvation survival upon RNAi of ARS genes. Thus, similar to proteasomal inhibition, loss of function of aak-2 leads to profound reductions in starvation survival. As expected, double mutants lacking aak-1 and aak-2 show further shortened starvation survival, and RNAi to kars-1 and other ARS genes is unable to extend starvation survival in these mutants (Figure 6J and Table S5).
Surprisingly, neither acute proteasomal inhibition with bortezomib upon initiation of starvation or genetic deficiency in AMPK affected the rate of fat mass loss during starvation (Figure S5). These data suggest, in contrast to prior studies of aak-2 mutant animals (Narbonne and Roy, 2009), that loss of UPS activity and AMPK activity do not affect starvation survival by strictly affecting the rate of fat mass loss.
These data suggest that a principal mechanism by which proteasomal inhibition with bortezomib shortens starvation survival is through preventing activation of AMPK. If this is the case, then genetic activation of AMPK should prevent bortezomib from reducing starvation survival. Indeed, a C. elegans transgenic strain carrying a gain of function aak-2 isoform (where the equivalent A-loop phosphorylation site to T172 is mutated to an phospho-mimic aspartate residue) was resistant to reductions in starvation survival upon bortezomib treatment (Figure 6K and Table S5). Taken together, the above data places AMPK genetically downstream of the proteasome and of proteostasis genes in general in regulating starvation survival (Figure 7).
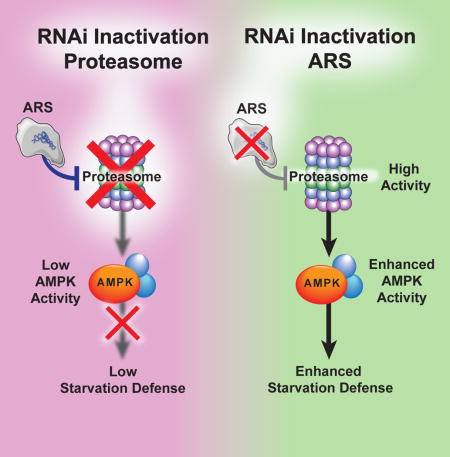
Figure 7. Model of Opposing Proteostasis Pathways Converging on AMPK to Govern Starvation Survival.
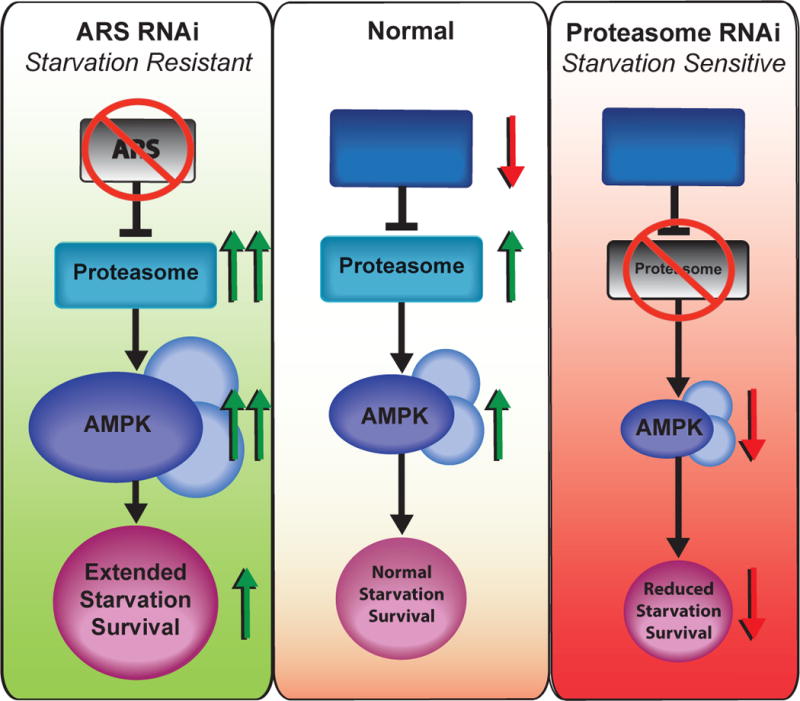
Under starvation, protein translation is inhibited, UPS activity is increased, and AMPK is activated to promoted starvation survival (center panel). Upon RNAi inhibition of ARS genes, (left panel), an exaggerated activation of the UPS leads to hyperactivation of AMPK and prolonged starvation survival. Alternatively, with proteasome RNAi or bortezomib treatment (right panel), AMPK can no longer be activated, leading to shortened starvation survival.
DISCUSSION
In this study we find that hundreds of genes contribute to regulation of body energy stores and survival under nutrient deprivation. Beginning with an unbiased study for genes that activate triglyceride accumulation, we identified 475 gene inactivations that both increase and decrease fat mass. Among those are genes belonging to the amino-acyl tRNA synthetase family, where knockdown by RNAi leads to massive lipid accumulation and prolonged starvation survival. We find that proteasomal activity is increased in starvation-resistant ARS-deficient animals, and that proper function of the proteasome is required for starvation survival in ARS-deficient and wild type animals alike. In support of the importance of the proteasome in starvation defenses, the primary screen also identified a large group of UPS encoding genes among low-fat and starvation susceptible gene inactivations. Remarkably, these opposing proteostasis pathways do not govern starvation survival strictly based upon provision of cellular energy; rather both converge on AMPK, and AMPK is the major determinant of starvation survival. We find that decreased proteasomal activity prohibits AMPK from responding to low cellular energy stores. Thus, enhanced AMPK activity mechanistically explains the enhanced survival of ARS deficiency, whereas reduced AMPK activity is responsible for shortened survival of proteasome-deficiency. We suggest that cellular sensing and integration of proteostasis is communicated to metabolic shifts and survival in times of nutrient deprivation through AMPK.
Cellular Proteostasis Pathways are Major Determinants of Starvation Resistance
In general, for animals to survive prolonged periods of starvation, metabolic adaptation is necessary in the form of increased nutrient storage and greater efficiency of energy utilization (Hardie, 2012). Previous studies indicate that inhibition of protein translation and elongation can defend against nutrient deprivation at the cellular level (Leprivier et al., 2013). Here we show that disabling ARS encoding genes activates starvation defenses at the organismal level, including a massive shift towards increased triglyceride storage and decreased utilization. These data are consistent with observations in Drosophila where genetic activation of protein synthesis reduces fat storage and starvation survival (Teleman et al., 2005).
Conversely, reduced function of UPS genes decrease lipid accumulation and survival under conditions of nutrient deprivation. Mutations in the gene encoding immunoproteasome subunit PSMB8 lead to a rare form of human lipodystropy, whereby adipocytes cannot accumulate normal triglyceride stores (Agarwal et al., 2010; Arima et al., 2011; Arimochi et al., 2016; Kitamura et al., 2011). We suggest that regulation of long-term energy stores is an essential and conserved role of the proteasome across phylogeny.
We find low fat mass evident with life-long proteasomal inhibition is not critical for shortened starvation survival. Indeed, our data indicate that AMPK activation is the essential output of proteasomal initiation and is necessary for starvation survival rather than fat mass per se. AMPK is necessary for survival under nutrient deprivation in arrested L1 and dauer larvae (Baugh, 2013; Baugh and Sternberg, 2006; Fukuyama et al., 2012; Narbonne and Roy, 2009). Further, in spite of massive lipid stores, we found that inhibition of the proteasome or AMPK completely abrogates the survival benefit evident with ARS gene deficiency. We also did not find altered rates of fat mass loss with acute inhibition of the proteasome or with genetic aak-2 deficiency, indicating that inactivation of this UPS-AMPK axis affects starvation survival in a manner independent of the macroscopically apparent rate of overall lipid utilization. This contrasts with one previous study indicating accelerated fat mass loss with starvation in C. elegans aak-2 dauer larvae (Narbonne and Roy, 2009), but is in agreement with findings of Cunningham et al. (Cunningham et al., 2014). Nonetheless, our results suggest that fat mass utilization can only extend starvation survival if the proteasome and AMPK are active, and that additional metabolic processes other than gross lipolysis and fatty acid oxidation are key targets of proteasome and AMPK activity during starvation. In aggregate, these data suggest that dysregulation of nutrient utilization during starvation rather than accumulated fat stores are the critical determinant of starvation survival. However, these data are not inconsistent with the idea that accumulated triglyceride facilitates starvation survival. We suggest that ARS deficient animals are extremely starvation resistant due to increased triglyceride stores and mechanisms mediated by activated AMPK.
The opposing proteostasis pathways identified highlight two groups of genes representing not only opposing lipid and starvation phenotypes when knocked down but also of opposing molecular machines. The ARS genes are intimately involved in an anabolic process as protein translation; the proteasome is involved in protein catabolism. We find that these two physiologically and molecularly distinct pathways are mechanistically linked. ARS gene inactivation leads to activation of starvation defenses in a manner completely dependent upon elevated proteasomal activity. Conversely, while it is possible that proteasome inhibition leads to sickness rather than true starvation sensitivity, the fact that ARS gene inactivations lead to elevated proteasome activity and that elevated activity contributes to starvation defenses argues against this possibility.
A large body of literature indicates reciprocal regulation of protein translation and protein turnover during starvation (Amherdt et al., 1974; Cahill et al., 1968; Finn and Dice, 2006; Millward et al., 1996; Saudek and Felig, 1976). Under conditions where insulin and growth factors are scant and nutrients are deficient, protein translation is curtailed and protein turnover is activated (the latter by either the UPS or autophagy pathway) (Cahill et al., 1968; Finn and Dice, 2006; Kim and Lee, 2014; Millward et al., 1996; Saudek and Felig, 1976). Our findings, taken together with the historical starvation and protein homeostasis literature, suggest that the proteasome is activated as a consequence of translational inhibition. We hypothesize the existence of an as yet unidentified cellular signal, present under fed conditions when protein translation is activated, serves to inhibit the UPS. When animals are starved, this signal is no longer available, triggering UPS activity.
AMPK Integrates Starvation Responses Received by Altered Proteostasis
We observe significant increases in αAMPKT172 phosphorylation upon ARS gene inhibition. Normally, activation of AMPK in the face of low ATP levels is associated with lipid catabolism to supply the cell with energy (Hardie, 2003, 2011; Hardie et al., 2012; Viollet et al., 2009). In the case of ARS gene inactivation, triglyceride levels are increased in spite of the observed increase in AMPK activation. Consistent with these findings, activation of AMPK in white adipose tissue suppresses lipolysis while AMPK deficient mice have small adipocytes (Daval et al., 2005). Our results indicate that AMPK activation in starvation, which is exaggerated in ARS deficiency, prolongs starvation survival in a manner independent of baseline fat storage or the rate of fat mass loss in starvation. These results contrast with prior studies of the role of AMPK in fat storage and starvation survival (Cunningham et al., 2014; Narbonne and Roy, 2009). We conclude, at the level of the whole organism, that reduced ARS gene function leads to elevated UPS activity, which is necessary for starvation-induced activation of AMPK.
In cultured mammalian cells, UPS inhibition has been reported to activate AMPK, possibly through relieving proteasomal degradation of AMPK subunits (Jiang et al., 2015; Zungu et al., 2011). Two likely possibilities exist to explain why this phenomenon is not orthologous between cells in culture and C. elegans, 1) that cells in culture are not representative of in vivo signaling and physiology and/or 2) that UPS inhibition of AMPK in C. elegans involves a multi-tissue signaling relay. AMPK has been shown to act in the nervous system and also in peripheral tissues in order to modulate aging (Burkewitz et al., 2015; Cunningham et al., 2014). It remains to be seen whether distinct sites of action of AMPK are required for efficient starvation defense at the organismal level versus cell autonomous effects.
Altered Proteostasis Activates an Ancient Starvation Defense Pathway
We suggest that starvation resistance is due to specific metabolic adaptation to decreased protein translation, which serves to activate AMPK in a proteasome-dependent manner following ARS gene knockdown. Coupled to increased fat levels, elevated UPS-AMPK activity in ARS deficient animals permits extended starvation survival. More generally, it is easy to speculate that evolution favored mechanistic links between catabolism of protein and lipid in the face of starvation. Our data suggests that one such link could be activation of AMPK in a manner dependent upon the proteasome. In circumstances when protein turnover through the UPS is activated, activation of AMPK would serve to upregulate starvation defenses. The adaptive nature of such a shift is readily evident. While in higher eukaryotes endocrine signaling pathways have evolved that balance protein and lipid anabolic and catabolic pathways, it is tempting to think that the proteostasis-AMPK link we report here represents an ancient adaptation to repeated cycles of feast and famine.
EXPERIMENTAL PROCEDURES
Strains and Maintenance
C. elegans were routinely grown and maintained on Nematode Growth Media (NGM) seeded with Escherichia coli OP50. The wild-type strain was N2 Bristol. The following C. elegans strains were used: MGH55 daf-16(mgDf47) 3×, CB4037 glp-1(e2141), MGH274 aak-2(ok524) 4×, MGH275 aak-1(tm1944) 4×, MGH276 aak-1(tm1944);aak-2(ok524), NL2098 rrf-1(pk1417) 2×, NL3511 ppw-1(pk1425) 2×, GR1373 eri-1(mg366) 5×, AGD467 uthEx490, SS104 vars-2/glp-4(bn2ts) 2× (vars-2/glp-4(bn2ts) encodes missense mutation Gly296Asp (Rastogi et al., 2015)).
Genome-Wide Fat RNAi Screen
RNAi analysis for fat regulatory genes was conducted as previously described (Pino et al., 2013) in eri-1 C. elegans. Phenotypes from 18,179 RNAi clones were analyzed in duplicate for fixative Nile red fat levels and compared to animals treated with empty RNAi vector. From this, 1364 clones were selected as having an altered fat phenotype based upon one replicate resulting in fat levels ≥2 standard deviations away or both replicates ≥1 standard deviation away from the empty vector mean. In the secondary screen, the 1364 clone sub-library was assayed for significant fat phenotypes in the eri-1 strain for an additional 6 biological replicates, identifying 475 fat regulatory genes (represented by 514 independent, sequence verified RNAi clones) based on significant P-value with Bonferroni step-down statistical correction.
Starvation/Exercise Screen
N2 animals fed individually on 475 fat regulatory gene RNAi library were either harvested at L4 stage (Fed), or washed twice and transferred to fresh 150 μl M9 minimal liquid media in 96-well U-bottom plates (Falcon). Animals were suspended in either M9 (Starved and Exercised) or M9 containing 100 mM 2,3-butanedione monoxime (BDM) (Sigma) paralytic agent (Starved). Starvation was carried out at 20°C for 16–20 hours with 90 RPM orbital shaking to prevent sedimentation of worms (n = 4 biological replicates). Clustering was performed using the R/Bioconductor kmeans function, using a least squares analysis to determine the number of clusters.
Starvation Survival Analysis
For the starvation analysis screen, we prepared 96 well plates with the 475 fat regulatory gene RNAi hits. To each well 60 synchronized L1 animals were added and monitored for growth at 20°C. When control animals reached mid-L4 larval stage, the animals were recovered from the RNAi plate with two washes of M9 + 0.005% Triton X-100 into a 96 well round bottom tissue culture plate, washed 3 times with M9 to remove bacteria and detergent, brought to a volume of 130 μl M9, and shaken at 180 RPM at 20°C in a humidified chamber. Wells were monitored microscopically survival. Death was confirmed by fully plating the contents of the well onto NGM agar. For longitudinal starvation survival analysis, animals were grown on 10 cm RNAi plates until mid L4 larval stage (except Figure S3F, where animals were starved either as mid-L4 or after an additional day on plates with food containing 50 μg/ml 5-fluorodeoxyuridine (FUDR) as day 1 adults). 5000–10000 worms were rinsed from the bacterial lawn, washed 3× with M9, resuspended in 10 ml M9 supplemented with 50 μg/ml FUDR in 50 ml glass flasks, and held at 20°C on a shaker at 90 RPM. Aliquots were analyzed for survival at indicated times. Data were analyzed by non-linear curve fit using Prism software and significance determined based upon the mean survival using a sum-of-squares test.
Fixative Nile Red Body Fat Measurement
Body fat mass was measured as previously described (Pino et al., 2013). All analyses were performed on identically staged adult worms (unless otherwise stated). Body fat mass was scored by analysis of Nile Red-stained C. elegans lipid droplets using MATLAB scripts, which use brightfield image processing to detect worms and the GFP/FITC channel for quantitation.
Biochemical Triacylglycerol (TG)/Phospholipid (PL) Measurement
TG/PL was determined as previously described on 5000 identically staged adult worms (unless otherwise stated) by solid phase extraction (SPE), fatty acid methyl ester (FAME) derivitization, and GC/MS analysis (Pino et al., 2013). Normalized total abundance of each lipid species was used for TG/PL calculations.
Proteasome Activity Measurement
Proteasome activity was measured as previously described (Vilchez et al., 2012). Briefly, 5000 synchronized L2/L3 C. elegans larvae were collected and washed three times in M9 buffer, resuspended in 600 μl of lysis buffer (250 mM Sucrose, 50 mM Tris pH 7.4, 5 mM MgCl2, 0.5 mM EDTA, 2 mM ATP and 1 mM DTT), and subjected to 2 rounds of 20 second high intensity pulse sonication on ice. Lysates were centrifuged at 10,000× g 20 minutes at 4°C. The soluble fraction with exception of the surface layer was isolated and added to AMC substrates (Enzo Life Sciences) to monitor the chymotrypsin-like, caspase-like and trypsin-like enzymatic activities. The reactions were carried out in 100 pl of reaction buffer (50 mM Tris pH 7.5, 1 mM MgCl2, 25 mM KCl, 10 mM NaCl with 75 μM AMC substrate and 50–150 μg of total protein), and three observations were made per sample over the course of 40 minutes on a SpectraMax M3 (Molecular Devices, LLC) microplate reader at 20°C using (excitation 360nm and emission 460nm). Proteasome inhibitor MG132 was supplied at 50 μM to determine background rates of non-proteasomal substrate hydrolysis.
Pharyngeal Pumping Rates
Pumping rate was determined for 10–12 synchronized, well-fed day late L4 stage animals per strain/RNAi grown on the same food source using a Canon Vixia HF S30 HD video camera attached to a Nikon SMZ1500 microscope. Pharyngeal contractions in 20-second time periods were counted using iMovie (Apple) with 30 frame-per-second capture rate slowed down to ¼ speed, and pumping rates per minute were calculated.
Oxygen Consumption
Synchronized, late L4 stage worms were washed 3 times in M9 medium. Oxygen consumption of 2500 worms was measured immediately in 1.5 mL of M9 medium using a Strathkelvin 928 6-channel Clark electrode respirometer (n = 6 per strain/RNAi, normalized to total dry weight).
Longevity Assay
Longevity assays were performed as previously described (Soukas et al., 2009). Briefly, synchronous L1 animals were placed on RNAi plates seeded with the appropriate RNAi clone. As day 1 adults, 100 animals per genotype were transferred to fresh RNAi plates with the corresponding RNAi supplemented with 50 μM FUDR solution. Live, dead and censored worms were calculated every 2–3 days in the worm populations by scoring movement with gentle prodding when necessary. Data were analyzed and statistics performed through OASIS (http://sbi.postech.ac.kr/oasis/surv/).
Statistical Analysis
Sample sizes were chosen to detect a difference of 50% assuming a standard deviation of 20% with a P value of 0.05 and a power of 80%. This equated to a minimum of biological triplicates, and often experiments were repeated in 4× to 6× biological replicates as indicated in the figure legends. Statistical tests performed to compare groups are indicated in each figure legend. No samples were excluded from the analysis. All data were blinded and only unblinded following completion of the analyses. No strict randomization was conducted, as identical populations of synchronous C. elegans were used for each experiment. GraphPad Prism software was used for all statistical analyses unless otherwise indicated.
Supplementary Material
Supplemental Table S1. Effect of RNAi Against Each of 514 Fat Regulatory Gene RNAi Targeting 475 Unique Genes on Fat Levels in eri-1 Animals. Relevant to Figure 1
Supplemental Table S4. Effect of RNAi Against Each of 475 Fat Regulatory Genes on Fat Mass Under Fed, Starved and Starved/Exercised Conditions and on Starvation Survival.
Relevant to Figure 2
Supplemental Table S5. Tabular Starvation Survival Data for Experimental Replicates, Non-Linear Regression Analysis. Relevant to Figures 3, 5, and 6
Supplemental Table S7. Fat Levels of Wild-Type and daf-16, akt-1, akt-2, hif-1, ire-1, and xbp-1 Mutant Animals Treated with ARS RNAi. Relevant to Figure 4
HIGHLIGHTS.
Opposing proteostasis pathways regulate C. elegans fat and starvation survival.
Extended starvation survival with ARS RNAi requires elevated proteasome activity.
Proteasome RNAi shortens starvation survival and blocks AMPK activation.
AMPK is the critical determinant of starvation survival with altered proteostasis.
Acknowledgments
We thank J. Avruch for discussions. Thanks to the NIH/NIDDK funded Boston Area Diabetes Endocrinology Research Center (P30DK057521) and the Nutrition and Obesity Research Center of Harvard (P30DK040561) for access to Core services. Some strains were provided by the Caenorhabditis Genome Center, which is funded by NIH Office of Research Infrastructure Programs (P40OD010440), and the C. elegans Knockout Consortium. This work was supported by a career development award from the NIH/NIDDK (K08DK087941 to A.A.S.), NIDDK R01DK101522 (to A.A.S.), the Ruth L. Kirschstein Postdoctoral Individual National Service Award from the NIH/NIDDK (5F32DK103471 to C.M.W.) the MGH Endocrine NIH/NIDDK training grant (5T32DK007028 to E.C.P. and C.M.W.), the Ellison Medical Foundation New Scholar in Aging Award (to A.A.S), and the Charles H. Hood Foundation Child Health Research Award (to A.A.S.).
Footnotes
Publisher's Disclaimer: This is a PDF file of an unedited manuscript that has been accepted for publication. As a service to our customers we are providing this early version of the manuscript. The manuscript will undergo copyediting, typesetting, and review of the resulting proof before it is published in its final citable form. Please note that during the production process errors may be discovered which could affect the content, and all legal disclaimers that apply to the journal pertain.
AUTHOR CONTRIBUTIONS
Conceptualization, C.M.W., E.C.P., and A.A.S.; Methodology, C.M.W., E.C.P., C.E.C., and A.A.S.; Software, C.E.C.; Formal Analysis, C.E.C., C.M.W., E.C.P., and A.A.S.; Investigation, C.M.W., E.C.P., L.W., B.Z., M.C.K., S.P.C., and A.A.S.; Writing – Original Draft, C.M.W., E.C.P. and A.A.S.; Writing – Review & Editing, C.M.W., E.C.P., C.E.C., L.W., B.Z., S.P.C., and A.A.S.; Visualization, C.M.W., E.C.P., M.C.K. and A.A.S.; Supervision, A.A.S.; Funding Acquisition, A.A.S.
SUPPLEMENTAL INFORMATION
Supplemental Information includes five figures and seven tables and can be found with this article online.
The following supplemental tables are supplied as Excel files:
References
- Agarwal AK, Xing C, DeMartino GN, Mizrachi D, Hernandez MD, Sousa AB, Martinez de Villarreal L, dos Santos HG, Garg A. PSMB8 encoding the beta5i proteasome subunit is mutated in joint contractures, muscle atrophy, microcytic anemia, and panniculitis-induced lipodystrophy syndrome. American journal of human genetics. 2010;87:866–872. doi: 10.1016/j.ajhg.2010.10.031. [DOI] [PMC free article] [PubMed] [Google Scholar]
- Amherdt M, Harris V, Renold AE, Orci L, Unger RH. Hepatic autophagy in uncontrolled experimental diabetes and its relationships to insulin and glucagon. The Journal of clinical investigation. 1974;54:188–193. doi: 10.1172/JCI107742. [DOI] [PMC free article] [PubMed] [Google Scholar]
- Arima K, Kinoshita A, Mishima H, Kanazawa N, Kaneko T, Mizushima T, Ichinose K, Nakamura H, Tsujino A, Kawakami A, et al. Proteasome assembly defect due to a proteasome subunit beta type 8 (PSMB8) mutation causes the autoinflammatory disorder, Nakajo-Nishimura syndrome. Proc Natl Acad Sci USA. 2011;108:14914–14919. doi: 10.1073/pnas.1106015108. [DOI] [PMC free article] [PubMed] [Google Scholar]
- Arimochi H, Sasaki Y, Kitamura A, Yasutomo K. Differentiation of preadipocytes and mature adipocytes requires PSMB8. Sci Rep. 2016;6:26791. doi: 10.1038/srep26791. [DOI] [PMC free article] [PubMed] [Google Scholar]
- Ashrafi K, Chang FY, Watts JL, Fraser AG, Kamath RS, Ahringer J, Ruvkun G. Genome-wide RNAi analysis of Caenorhabditis elegans fat regulatory genes. Nature. 2003;421:268–272. doi: 10.1038/nature01279. [DOI] [PubMed] [Google Scholar]
- Baugh LR. To grow or not to grow: nutritional control of development during Caenorhabditis elegans L1 arrest. Genetics. 2013;194:539–555. doi: 10.1534/genetics.113.150847. [DOI] [PMC free article] [PubMed] [Google Scholar]
- Baugh LR, Sternberg PW. DAF-16/FOXO regulates transcription of cki-1/Cip/Kip and repression of lin-4 during C. elegans L1 arrest. Curr Biol. 2006;16:780–785. doi: 10.1016/j.cub.2006.03.021. [DOI] [PubMed] [Google Scholar]
- Beanan MJ, Strome S. Characterization of a germ-line proliferation mutation in C. elegans. Development. 1992;116:755–766. doi: 10.1242/dev.116.3.755. [DOI] [PubMed] [Google Scholar]
- Brooks KK, Liang B, Watts JL. The influence of bacterial diet on fat storage in C. elegans. PLoS ONE. 2009;4:e7545. doi: 10.1371/journal.pone.0007545. [DOI] [PMC free article] [PubMed] [Google Scholar]
- Burkewitz K, Morantte I, Weir HJ, Yeo R, Zhang Y, Huynh FK, Ilkayeva OR, Hirschey MD, Grant AR, Mair WB. Neuronal CRTC-1 governs systemic mitochondrial metabolism and lifespan via a catecholamine signal. Cell. 2015;160:842–855. doi: 10.1016/j.cell.2015.02.004. [DOI] [PMC free article] [PubMed] [Google Scholar]
- Cahill G, Owen O, Morgan A. The consumption of fuels during prolonged starvation. Advances in enzyme regulation. 1968;6:143–150. doi: 10.1016/0065-2571(68)90011-3. [DOI] [PubMed] [Google Scholar]
- Cuervo AM, Bergamini E, Brunk UT, Droge W, Ffrench M, Terman A. Autophagy and aging: the importance of maintaining “clean” cells. Autophagy. 2005;1:131–140. doi: 10.4161/auto.1.3.2017. [DOI] [PubMed] [Google Scholar]
- Cunningham KA, Bouagnon AD, Barros AG, Lin L, Malard L, Romano-Silva MA, Ashrafi K. Loss of a neural AMP-activated kinase mimics the effects of elevated serotonin on fat, movement, and hormonal secretions. PLoS genetics. 2014;10:e1004394. doi: 10.1371/journal.pgen.1004394. [DOI] [PMC free article] [PubMed] [Google Scholar]
- Daval M, Diot-Dupuy F, Bazin R, Hainault I, Viollet B, Vaulont S, Hajduch E, Ferre P, Foufelle F. Anti-lipolytic action of AMP-activated protein kinase in rodent adipocytes. J Biol Chem. 2005;280:25250–25257. doi: 10.1074/jbc.M414222200. [DOI] [PubMed] [Google Scholar]
- Falk MJ, Zhang Z, Rosenjack JR, Nissim I, Daikhin E, Nissim I, Sedensky MM, Yudkoff M, Morgan PG. Metabolic pathway profiling of mitochondrial respiratory chain mutants in C. elegans. Molecular genetics and metabolism. 2008;93:388–397. doi: 10.1016/j.ymgme.2007.11.007. [DOI] [PMC free article] [PubMed] [Google Scholar]
- Finn PF, Dice JF. Proteolytic and lipolytic responses to starvation. Nutrition. 2006;22:830–844. doi: 10.1016/j.nut.2006.04.008. [DOI] [PubMed] [Google Scholar]
- Fukuyama M, Sakuma K, Park R, Kasuga H, Nagaya R, Atsumi Y, Shimomura Y, Takahashi S, Kajiho H, Rougvie A, et al. C. elegans AMPKs promote survival and arrest germline development during nutrient stress. Biol Open. 2012;1:929–936. doi: 10.1242/bio.2012836. [DOI] [PMC free article] [PubMed] [Google Scholar]
- Garrow JS, Fletcher K, Halliday D. Body Composition in Severe Infantile Malnutrition. The Journal of clinical investigation. 1965;44:417–425. doi: 10.1172/JCI105155. [DOI] [PMC free article] [PubMed] [Google Scholar]
- Hardie DG. Minireview: the AMP-activated protein kinase cascade: the key sensor of cellular energy status. Endocrinology. 2003;144:5179–5183. doi: 10.1210/en.2003-0982. [DOI] [PubMed] [Google Scholar]
- Hardie DG. AMP-activated protein kinase: an energy sensor that regulates all aspects of cell function. Genes Dev. 2011;25:1895–1908. doi: 10.1101/gad.17420111. [DOI] [PMC free article] [PubMed] [Google Scholar]
- Hardie DG. Organismal carbohydrate and lipid homeostasis. Cold Spring Harbor perspectives in biology. 2012;4 doi: 10.1101/cshperspect.a006031. [DOI] [PMC free article] [PubMed] [Google Scholar]
- Hardie DG, Ross FA, Hawley SA. AMPK: a nutrient and energy sensor that maintains energy homeostasis. Nature reviews Molecular cell biology. 2012;13:251–262. doi: 10.1038/nrm3311. [DOI] [PMC free article] [PubMed] [Google Scholar]
- Hsin H, Kenyon C. Signals from the reproductive system regulate the lifespan of C. elegans. Nature. 1999;399:362–366. doi: 10.1038/20694. [DOI] [PubMed] [Google Scholar]
- Huang da W, Sherman BT, Lempicki RA. Systematic and integrative analysis of large gene lists using DAVID bioinformatics resources. Nature protocols. 2009;4:44–57. doi: 10.1038/nprot.2008.211. [DOI] [PubMed] [Google Scholar]
- Ibba M, Soll D. Aminoacyl-tRNA synthesis. Annual review of biochemistry. 2000;69:617–650. doi: 10.1146/annurev.biochem.69.1.617. [DOI] [PubMed] [Google Scholar]
- Jiang S, Park DW, Gao Y, Ravi S, Darley-Usmar V, Abraham E, Zmijewski JW. Participation of proteasome-ubiquitin protein degradation in autophagy and the activation of AMP-activated protein kinase. Cell Signal. 2015;27:1186–1197. doi: 10.1016/j.cellsig.2015.02.024. [DOI] [PMC free article] [PubMed] [Google Scholar]
- Kamath RS, Fraser AG, Dong Y, Poulin G, Durbin R, Gotta M, Kanapin A, Le Bot N, Moreno S, Sohrmann M, et al. Systematic functional analysis of the Caenorhabditis elegans genome using RNAi. Nature. 2003;421:231–237. doi: 10.1038/nature01278. [DOI] [PubMed] [Google Scholar]
- Kang C, You YJ, Avery L. Dual roles of autophagy in the survival of Caenorhabditis elegans during starvation. Genes Dev. 2007;21:2161–2171. doi: 10.1101/gad.1573107. [DOI] [PMC free article] [PubMed] [Google Scholar]
- Kennedy S, Wang D, Ruvkun G. A conserved siRNA-degrading RNase negatively regulates RNA interference in C. elegans. Nature. 2004;427:645–649. doi: 10.1038/nature02302. [DOI] [PubMed] [Google Scholar]
- Kim JK, Gabel HW, Kamath RS, Tewari M, Pasquinelli A, Rual JF, Kennedy S, Dybbs M, Bertin N, Kaplan JM, et al. Functional genomic analysis of rna interference in C. elegans. Science. 2005;308:1164–1167. doi: 10.1126/science.1109267. [DOI] [PubMed] [Google Scholar]
- Kim KH, Lee MS. Autophagy–a key player in cellular and body metabolism. Nat Rev Endocrinol. 2014;10:322–337. doi: 10.1038/nrendo.2014.35. [DOI] [PubMed] [Google Scholar]
- Kitamura A, Maekawa Y, Uehara H, Izumi K, Kawachi I, Nishizawa M, Toyoshima Y, Takahashi H, Standley DM, Tanaka K, et al. A mutation in the immunoproteasome subunit PSMB8 causes autoinflammation and lipodystrophy in humans. The Journal of clinical investigation. 2011;121:4150–4160. doi: 10.1172/JCI58414. [DOI] [PMC free article] [PubMed] [Google Scholar]
- Kumsta C, Hansen M. C. elegans rrf-1 mutations maintain RNAi efficiency in the soma in addition to the germline. PLoS ONE. 2012;7:e35428. doi: 10.1371/journal.pone.0035428. [DOI] [PMC free article] [PubMed] [Google Scholar]
- Lapierre LR, Gelino S, Melendez A, Hansen M. Autophagy and lipid metabolism coordinately modulate life span in germline-less C. elegans. Curr Biol. 2011;21:1507–1514. doi: 10.1016/j.cub.2011.07.042. [DOI] [PMC free article] [PubMed] [Google Scholar]
- Lee CS, Ho DV, Chan JY. Nuclear factor-erythroid 2-related factor 1 regulates expression of proteasome genes in hepatocytes and protects against endoplasmic reticulum stress and steatosis in mice. The FEBS journal. 2013;280:3609–3620. doi: 10.1111/febs.12350. [DOI] [PMC free article] [PubMed] [Google Scholar]
- Leprivier G, Remke M, Rotblat B, Dubuc A, Mateo AR, Kool M, Agnihotri S, El-Naggar A, Yu B, Somasekharan SP, et al. The eEF2 kinase confers resistance to nutrient deprivation by blocking translation elongation. Cell. 2013;153:1064–1079. doi: 10.1016/j.cell.2013.04.055. [DOI] [PMC free article] [PubMed] [Google Scholar]
- McKay RM, McKay JP, Avery L, Graff JM. C elegans: a model for exploring the genetics of fat storage. Developmental cell. 2003;4:131–142. doi: 10.1016/s1534-5807(02)00411-2. [DOI] [PMC free article] [PubMed] [Google Scholar]
- Millward DJ, Fereday A, Gibson NR, Pacy PJ. Post-prandial protein metabolism. Baillieres Clin Endocrinol Metab. 1996;10:533–549. doi: 10.1016/s0950-351x(96)80696-3. [DOI] [PubMed] [Google Scholar]
- Narbonne P, Roy R. Caenorhabditis elegans dauers need LKB1/AMPK to ration lipid reserves and ensure long-term survival. Nature. 2009;457:210–214. doi: 10.1038/nature07536. [DOI] [PubMed] [Google Scholar]
- O’Rourke EJ, Soukas AA, Carr CE, Ruvkun G. C. elegans major fats are stored in vesicles distinct from lysosome-related organelles. Cell Metab. 2009;10:430–435. doi: 10.1016/j.cmet.2009.10.002. [DOI] [PMC free article] [PubMed] [Google Scholar]
- Pino EC, Webster CM, Carr CE, Soukas AA. Biochemical and high throughput microscopic assessment of fat mass in Caenorhabditis elegans. Journal of visualized experiments: JoVE. 2013 doi: 10.3791/50180. [DOI] [PMC free article] [PubMed] [Google Scholar]
- Priess JR, Schnabel H, Schnabel R. The glp-1 locus and cellular interactions in early C. elegans embryos. Cell. 1987;51:601–611. doi: 10.1016/0092-8674(87)90129-2. [DOI] [PubMed] [Google Scholar]
- Rastogi S, Borgo B, Pazdernik N, Fox P, Mardis ER, Kohara Y, Havranek J, Schedl T. Caenorhabditis elegans glp-4 Encodes a Valyl Aminoacyl tRNA Synthetase. G3 (Bethesda) 2015;5:2719–2728. doi: 10.1534/g3.115.021899. [DOI] [PMC free article] [PubMed] [Google Scholar]
- Rolfe DF, Brown GC. Cellular energy utilization and molecular origin of standard metabolic rate in mammals. Physiological reviews. 1997;77:731–758. doi: 10.1152/physrev.1997.77.3.731. [DOI] [PubMed] [Google Scholar]
- Saudek CD, Felig P. The metabolic events of starvation. Am J Med. 1976;60:117–126. doi: 10.1016/0002-9343(76)90540-4. [DOI] [PubMed] [Google Scholar]
- Schneider-Poetsch T, Ju J, Eyler DE, Dang Y, Bhat S, Merrick WC, Green R, Shen B, Liu JO. Inhibition of eukaryotic translation elongation by cycloheximide and lactimidomycin. Nature chemical biology. 2010;6:209–217. doi: 10.1038/nchembio.304. [DOI] [PMC free article] [PubMed] [Google Scholar]
- Shaw RJ, Kosmatka M, Bardeesy N, Hurley RL, Witters LA, DePinho RA, Cantley LC. The tumor suppressor LKB1 kinase directly activates AMP-activated kinase and regulates apoptosis in response to energy stress. Proc Natl Acad Sci USA. 2004;101:3329–3335. doi: 10.1073/pnas.0308061100. [DOI] [PMC free article] [PubMed] [Google Scholar]
- Siems WG, Schmidt H, Gruner S, Jakstadt M. Balancing of energy-consuming processes of K 562 cells. Cell biochemistry and function. 1992;10:61–66. doi: 10.1002/cbf.290100110. [DOI] [PubMed] [Google Scholar]
- Sijen T, Fleenor J, Simmer F, Thijssen KL, Parrish S, Timmons L, Plasterk RH, Fire A. On the role of RNA amplification in dsRNA-triggered gene silencing. Cell. 2001;107:465–476. doi: 10.1016/s0092-8674(01)00576-1. [DOI] [PubMed] [Google Scholar]
- Singh R, Kaushik S, Wang Y, Xiang Y, Novak I, Komatsu M, Tanaka K, Cuervo AM, Czaja MJ. Autophagy regulates lipid metabolism. Nature. 2009;458:1131–1135. doi: 10.1038/nature07976. [DOI] [PMC free article] [PubMed] [Google Scholar]
- Soukas AA, Kane EA, Carr CE, Melo JA, Ruvkun G. Rictor/TORC2 regulates fat metabolism, feeding, growth, and life span in Caenorhabditis elegans. Genes Dev. 2009;23:496–511. doi: 10.1101/gad.1775409. [DOI] [PMC free article] [PubMed] [Google Scholar]
- Teleman AA, Chen YW, Cohen SM. 4E-BP functions as a metabolic brake used under stress conditions but not during normal growth. Genes Dev. 2005;19:1844–1848. doi: 10.1101/gad.341505. [DOI] [PMC free article] [PubMed] [Google Scholar]
- Thomson TJ, Runcie J, Miller V. Treatment of obesity by total fasting for up to 249 days. Lancet. 1966;2:992–996. doi: 10.1016/s0140-6736(66)92925-4. [DOI] [PubMed] [Google Scholar]
- Tijsterman M, Okihara KL, Thijssen K, Plasterk RH. PPW-1, a PAZ/PIWI protein required for efficient germline RNAi, is defective in a natural isolate of C. elegans. Curr Biol. 2002;12:1535–1540. doi: 10.1016/s0960-9822(02)01110-7. [DOI] [PubMed] [Google Scholar]
- Vilchez D, Morantte I, Liu Z, Douglas PM, Merkwirth C, Rodrigues AP, Manning G, Dillin A. RPN-6 determines C. elegans longevity under proteotoxic stress conditions. Nature. 2012;489:263–268. doi: 10.1038/nature11315. [DOI] [PubMed] [Google Scholar]
- Viollet B, Andreelli F, Jorgensen SB, Perrin C, Flamez D, Mu J, Wojtaszewski JF, Schuit FC, Birnbaum M, Richter E, et al. Physiological role of AMP-activated protein kinase (AMPK): insights from knockout mouse models. Biochem Soc Trans. 2003;31:216–219. doi: 10.1042/bst0310216. [DOI] [PubMed] [Google Scholar]
- Viollet B, Guigas B, Leclerc J, Hebrard S, Lantier L, Mounier R, Andreelli F, Foretz M. AMP-activated protein kinase in the regulation of hepatic energy metabolism: from physiology to therapeutic perspectives. Acta Physiol (Oxf) 2009;196:81–98. doi: 10.1111/j.1748-1716.2009.01970.x. [DOI] [PMC free article] [PubMed] [Google Scholar]
- Viscarra JA, Ortiz RM. Cellular mechanisms regulating fuel metabolism in mammals: role of adipose tissue and lipids during prolonged food deprivation. Metabolism: clinical and experimental. 2013;62:889–897. doi: 10.1016/j.metabol.2012.12.014. [DOI] [PMC free article] [PubMed] [Google Scholar]
- Woods A, Johnstone SR, Dickerson K, Leiper FC, Fryer LG, Neumann D, Schlattner U, Wallimann T, Carlson M, Carling D. LKB1 is the upstream kinase in the AMP-activated protein kinase cascade. Curr Biol. 2003;13:2004–2008. doi: 10.1016/j.cub.2003.10.031. [DOI] [PubMed] [Google Scholar]
- Yen K, Le TT, Bansal A, Narasimhan SD, Cheng JX, Tissenbaum HA. A comparative study of fat storage quantitation in nematode Caenorhabditis elegans using label and label-free methods. PLoS ONE. 2010;5 doi: 10.1371/journal.pone.0012810. [DOI] [PMC free article] [PubMed] [Google Scholar]
- Zungu M, Schisler JC, Essop MF, McCudden C, Patterson C, Willis MS. Regulation of AMPK by the ubiquitin proteasome system. Am J Pathol. 2011;178:4–11. doi: 10.1016/j.ajpath.2010.11.030. [DOI] [PMC free article] [PubMed] [Google Scholar]
Associated Data
This section collects any data citations, data availability statements, or supplementary materials included in this article.
Supplementary Materials
Supplemental Table S1. Effect of RNAi Against Each of 514 Fat Regulatory Gene RNAi Targeting 475 Unique Genes on Fat Levels in eri-1 Animals. Relevant to Figure 1
Supplemental Table S4. Effect of RNAi Against Each of 475 Fat Regulatory Genes on Fat Mass Under Fed, Starved and Starved/Exercised Conditions and on Starvation Survival.
Relevant to Figure 2
Supplemental Table S5. Tabular Starvation Survival Data for Experimental Replicates, Non-Linear Regression Analysis. Relevant to Figures 3, 5, and 6
Supplemental Table S7. Fat Levels of Wild-Type and daf-16, akt-1, akt-2, hif-1, ire-1, and xbp-1 Mutant Animals Treated with ARS RNAi. Relevant to Figure 4