

Abstract
Background
Spasmodic dysphonia is a focal dystonia characterized by involuntary spasms in the laryngeal muscles that occur selectively during speaking. Although hereditary trends have been reported in up to 16% of patients, the causative etiology of spasmodic dysphonia is unclear, and the influences of various phenotypes and genotypes on disorder pathophysiology are poorly understood. In this study, we examined structural alterations in cortical gray matter and white matter integrity in relationship to different phenotypes and putative genotypes of spasmodic dysphonia to elucidate the structural component of its complex pathophysiology.
Methods
Eighty-nine patients with spasmodic dysphonia underwent high-resolution magnetic resonance imaging and diffusion-weighted imaging to examine cortical thickness and white matter fractional anisotropy in adductor versus abductor forms (distinct phenotypes) and in sporadic versus familial cases (distinct genotypes).
Results
Phenotype-specific abnormalities were localized in the left sensorimotor cortex and angular gyrus and the white matter bundle of the right superior corona radiata. Genotype-specific alterations were found in the left superior temporal gyrus, supplementary motor area, and the arcuate portion of the left superior longitudinal fasciculus.
Conclusions
Our findings suggest that phenotypic differences in spasmodic dysphonia arise at the level of the primary and associative areas of motor control, whereas genotype-related pathophysiological mechanisms may be associated with dysfunction of regions regulating phonological and sensory processing. Identification of structural alterations specific to disorder phenotype and putative genotype provides an important step toward future delineation of imaging markers and potential targets for novel therapeutic interventions for spasmodic dysphonia.
Keywords: laryngeal dystonia, cortical thickness, diffusion-weighted imaging, genetics
Spasmodic dysphonia (SD) is a laryngeal form of focal dystonia characterized by intermittent spasms in the vocal folds selectively affecting speech production. SD manifests in different clinical forms and has a hereditary predisposition.1 In the most common adductor form (ADSD), hyperadduction of the vocal folds leads to voice breaks on vowels and strained voice quality. In a rare abductor (ABSD) form, overabduction of the vocal folds leads to voice breaks on voiceless consonants and breathy voice quality.
The causative pathophysiology of SD remains unclear. Typically, SD has a sporadic onset, with only up to 16% of patients reporting a familial history of dystonia.1,2 Several structural abnormalities underlying the speech sensorimotor network have been described as potential contributors to disorder pathophysiology in SD patients compared with healthy subjects.3–9 In one of the first studies, Simonyan and colleagues showed abnormal integrity of white matter in the genu of the internal capsule, lentiform nucleus, thalamus, and cerebellum.7 Follow-up studies have extended these findings by identifying further alterations in white matter underlying inferior frontal gyrus and associative pathways that are also shared with other task-specific dystonias and dystonic voice tremor.3,5,6 Gray matter abnormalities in SD patients compared with healthy controls have been reported to involve bilateral primary sensorimotor and premotor cortex, superior/middle temporal, supramarginal, inferior frontal gyri, inferior parietal lobule, insula, putamen, thalamus, and cerebellum.4,8,9 Some of these structural abnormalities were found to underlie functional alterations during symptomatic speech production4 and subclinically altered temporal discrimination.8 Despite these recent advances in mapping structural changes in SD compared with the healthy state, little is still known about neural alterations that contribute to SD hereditary predisposition and its distinct clinical phenotypes. This missing knowledge is critically important for advancing our general understanding of SD pathophysiology as well as for identification of SD structural imaging markers as potential targets for novel therapeutic interventions.
In this study, we aimed to characterize phenotype- and genotype-specific structural abnormalities in large cohorts of ADSD versus ABSD and sporadic versus familial SD, respectively, by examining cortical thickness (CT) using high-resolution MRI and white matter integrity using fractional anisotropy (FA) of diffusion-weighted images (DWIs). CT and FA measures were chosen because of their highly heritable nature.10–13 SD patients were grouped to examine (1) the effects of a clinically homogeneous genotype (sporadic) on phenotypical (ADSD; ABSD) differences in brain abnormalities (sporadic ADSD vs sporadic ABSD) and (2) the effects of a homogeneous phenotype (ADSD) on genotypical (sporadic; familial) differences in brain alterations (sporadic ADSD vs familial ADSD). We further regrouped the patients to examine (3) the effects of heterogeneous genotypes (sporadic + familial) on phenotypical (ADSD; ABSD) differences in brain alterations (a combined group of sporadic + familial ADSD vs a combined group of sporadic + familial ABSD), as well as (4) the effects of clinically heterogeneous phenotypes (ADSD + ABSD) on genotypical (sporadic; familial) differences in brain abnormalities (a combined group of ADSD + ABSD sporadic patients vs a combined group of ADSD + ABSD familial patients). It is important to note that in the absence of a specific test for an SD gene, we used the term homogeneous to refer to those groups that were stratified based on the same clinical phenotype (eg, ADSD) or putative genotype (eg, sporadic). The term heterogeneous referred to those groups, in which both clinical phenotype and genotype were mixed (ADSD + ABSD or sporadic + familial). Based on a patient’s clinical history of the disorder, a patient without any familial history of SD and/or other isolated dystonias was considered to have sporadic SD, whereas a patient with a history of at least 1 other blood relative affected with SD and/or other isolated dystonias was considered to have familial SD. Similarly, stratification of patients into ABSD and ADSD groups was based on a patient’s clinical characteristics of one or another type of voice symptoms.
We hypothesized that differences shared by both homogeneous and heterogeneous groups would reflect genotype- and phenotype-specific alterations, whereas differences unique to each group would suggest phenotype-genotype interactions. Based on previous studies,3–9,14 we hypothesized that different phenotypic and genotypic structural alterations would be found within the primary and association pathways of sensorimotor integration and processing for speech motor output.
Material and Methods
Study Participants
Eighty-nine patients (72 women/17 men, 55 ± 13 years old, SD onset at 38 ± 17 years old) were recruited for the study. Sixty patients had sporadic SD, and 29 patients had a family history of SD and/or other isolated dystonias. The family history of dystonia was examined in all patients; the patients’ pedigrees were charted up to their V–VII generations. The sporadic SD group comprised 30 ADSD patients and 30 ABSD patients. The familial SD group included 22 ADSD and 7 ABSD patients. A clinical diagnosis of ADSD and ABSD was established based on voice/speech acoustic examination, neurological evaluation, and fiberoptic nasolaryngoscopy. Patients were individually matched between groups by age, sex, and handedness (Table 1).
TABLE 1.
Demographics of a total of 89 SD patients assigned to different groups based on their phenotypes and putative genotypes
| Sporadic versus familial
|
Sporadic versus familial
|
ADSD versus ABSD
|
ADSD versus ABSD
|
|||||
|---|---|---|---|---|---|---|---|---|
| Homogeneous group
|
Heterogeneous group
|
Homogeneous group
|
Heterogeneous group
|
|||||
| Sporadic | Familial | Sporadic | Familial | ADSD | ABSD | ADSD | ABSD | |
| n | 23 (AD) | 22 (AD) | 30 (7AB/23AD) | 29 (7AB/22AD) | 30 (SPOR) | 30 (SPOR) | 37 (30SPOR/7FAM) | 37 (30SPOR/7FAM) |
| Sex, female/male | 18/5 | 19/3 | 24/6 | 24/5 | 23/7 | 26/4 | 29/8 | 31/6 |
| Age (y), mean ± s.d. | 56 ± 11 | 56 ± 15 | 56 ± 12 | 56 ± 15 | 56 ± 12 | 53 ± 13 | 56 ± 13 | 54 ± 12 |
| SD duration, mean ± s.d. | 14 ± 11 | 21 ± 14 | 16 ± 13 | 20 ± 14 | 17 ± 13 | 15 ± 9 | 17 ± 12 | 16 + 11 |
| Age of onset (y), mean ± s.d. | 42 ± 13 | 35 ± 16 | 40 ± 13 | 36 ± 17 | 39 ± 16 | 38 ± 12 | 39 ± 17 | 38 ± 12 |
| Handedness (Edinburgh Inventory) | Right | |||||||
| Language | Monolingual native English | |||||||
| Cognitive status | Mini-Mental State Examination ≥ 27 points | |||||||
| Genetic status | Negative for DYT1, DYT6, DYT4, and DYT25 | |||||||
FAM, familial; SPOR, sporadic.
All patients were right-handed, native English speakers. None had any neurological (other than SD), laryngeal, or psychiatric problems. All patients tested negative for known dystonia mutations, including DYT1, DYT4, DYT6, and DYT25. Patients who received botulinum toxin injections participated in the study at least 3 months after the last injection, when they were fully symptomatic.
ADSD and ABSD patients were compared using both genotypically homogenous (including only the sporadic form) and genotypically heterogeneous (combining the sporadic and familial forms) groups (Table 1). In the genotypically homogeneous group, a comparison was performed between 30 sporadic ADSD (23 women/7 men, aged 56 ± 12 years) and 30 sporadic ABSD (26 women/4 men, aged 53 ± 13 years). Both ADSD and ABSD groups had a similar age at onset (ABSD, 38 ± 12 years; ADSD, 39 ± 16 years) and duration of the disorder (ABSD, 15 ± 9 years; ADSD, 17 ± 13 years), all P ≥ 0.56. In the genotypically heterogeneous group, a comparison was made between a combined group of 30 sporadic and 7 familial ADSD patients (29 women/8 men, aged 56 ± 13 years) and a combined group of 30 sporadic and 7 familial ABSD patients (31 women/6 men, aged 54 ± 12 years) with a similar age at onset (ABSD, 38 ± 12 years; ADSD, 39 ± 17 years) and duration of the disorder (ABSD, 16 ± 11 years; ADSD, 17 ± 12 years), all P ≥ 0.64). Sporadic patients included in the heterogeneous group were the same as those used in the homogeneous group.
Sporadic and familial SD patients were compared using both phenotypically homogenous (including only ADSD) and phenotypically heterogeneous (combining ADSD and ABSD) groups (Table 1). In the phenotypically homogeneous group, a comparison was made between 23 sporadic ADSD patients (18 women/5 men, aged 56 ± 11 years) and 22 familial ADSD patients (19 women/3 men, aged 56 ± 15 years). Both sporadic and familial patients had a similar age at onset (sporadic SD, 42 ± 13 years; familial SD, 35 ± 16 years) and duration (sporadic SD, 14 ± 11 years; familial SD, 21 ± 14 years) of the disorder (all P ≥ 0.07). In the phenotypically heterogeneous group, a comparison was performed between a combined group of 23 ADSD and 7 ABSD sporadic patients (24 women/6 men, aged 56 ± 12 years) and a combined group of 22 ADSD and 7 ABSD familial patients (24 women/5 men, aged 56 ± 15 years), with a similar age at onset (sporadic, 40 ± 13 years; familial, 36 ± 17 years) and duration of SD (sporadic, 16 ± 11 years; familial, 20 ± 14 years), all P ≥ 0.21. The ADSD patients included in the heterogeneous group were the same as used in the homogeneous group.
All patients provided written informed consent prior to study participation, which was approved by the Institutional Review Board of the Icahn School of Medicine at Mount Sinai. The same cohort of SD patients has been examined for their structural abnormalities in comparison with healthy subjects in our previous study.5
Image Acquisition
Data were collected on a 3T Philips scanner equipped with an 8-channel head coil. High-resolution T1-weighted images were acquired using a 3-D magnetization-prepared rapid acquisition gradient echo sequence (3D-MPRAGE: TR = 7.5 milliseconds, TE = 3.4 milliseconds, TI = 819 milliseconds, FA = 8°, FOV = 210 mm, 172 slices, 1-mm thickness). DWIs were acquired using a single-shot spin-echo EPI sequence with 60 noncollinear directions and a nondiffusion image (b0; TR = 8900 milliseconds, FOV = 240 mm, matrix 128 × 128 mm, 2-mm thickness, b = 1000/mm2).
Images Analysis
CT analysis was performed following the standard processing pipeline of the FreeSurfer software package as described previously.4,15 Each volume was visually inspected for accuracy of the cortical boundaries and manually edited to remove nonbrain tissue within the cortical boundary. CT measures were calculated based on the shortest distance between GM/WM and GM/CSF boundaries at each vertex on the tessellate surface.16 CT maps were smoothed using a Gaussian isotropic kernel (1 0mm) at full width at half maximum.
DWIs were preprocessed using the FSL DTI toolbox to correct for motion and eddy current artifacts.5 The FA maps were registered to the standard MNI space through linear and nonlinear transformations in AFNI software.17 Following the tract-based spatial statistics (FSL TBSS) pipeline,18 a white-matter skeleton was created at a 0.2 FA threshold.
Statistical Analysis
Between-group comparisons were performed to examine respective homogeneous and heterogeneous groups of (1) ADSD vs ABSD and (2) familial SD vs sporadic SD using independent 2-sample t tests (AFNI 3dttest++) at family-wise error-corrected P ≤ 0.01 (0.05/4 comparisons). These t tests were performed by solving a voxelwise regression problem to estimate the mean of input data and their slopes with respect to variations in the covariates. Patients’ age and gender were included as covariates to account for dependent variations in obtained measures. Covariates were included to remove the residual effects of 1 or more variables at the group level.
Statistical testing did not include cluster enhancement. Correction for multiple comparisons at a cluster level was performed for both CT and FA measures to ensure that each reported region reached statistical significance. The cluster significance threshold was set a priori at P ≤ 0.01.
Direct comparisons between homogeneous and heterogeneous groups or between clinical phenotype and putative genotype were not performed. Statistical significance was assessed within each of the examined groups separately. We visualized the results from these independent analyses to demonstrate the landscape of alterations that are dependent on inclusion/exclusion of a specific patient population.
Clinical Correlates of Structural Alterations in SD
To evaluate the relationship between structural abnormalities and clinical characteristics of SD, we recorded the production of symptomatic speech sentences, including 20 sentences eliciting ADSD symptoms and 20 sentences eliciting ABSD symptoms. These recordings were anonymized, randomized, and blindly rated by an experienced speech-language pathologist. SD symptoms were assessed by counting the number of SD-characteristic voice breaks in each sentence.4,5,19 Information on SD onset and duration was obtained from the medical history. Pearson’s correlation coefficients were used to test the relationship between SD severity (voice breaks), age at SD onset and disorder duration with mean CT and FA values in the clusters that significantly differed between the examined groups at a Bonferroni-corrected P ≤ 0.01 (0.05/3 independent variables).
Results
Baseline abnormalities between the same SD patients and age- and gender-matched healthy subjects were reported in our previous study.5
Phenotype-Specific Structural Alterations: ADSD Versus ABSD
Comparisons between genotypically homogenous groups of sporadic ADSD and sporadic ABSD found CT differences in the left laryngeal/orofacial and respiratory regions of the primary sensorimotor cortex (Table 2, Fig. 1-IA), angular gyrus, and FA differences in the right splenium of the corpus callosum (CC) and superior corona radiata (SCR) (see Table 2 and Figure 1-IIA).
TABLE 2.
Statistically significant differences in cortical thickness and fractional anisotropy between ABSD and ADSD as well as familial and sporadic SD patients
| ADSD versus ABSD | ||||
|---|---|---|---|---|
|
| ||||
| Homogeneous group (sporadic only) | ||||
| Cortical thickness | Region | t score | Coordinates (x,y,z) | Area (mm2) |
| L sensorimotor (laryngeal/orofacial) | 3.9 | −47 −10 31 | 94 | |
| L angular gyrus | 3.8 | −46 −69 22 | 83 | |
| L sensorimotor (respiratory) | 3.6 | −16 −32 59 | 81 | |
| Fractional anisotropy | Region | t score | Coordinates (x,y,z) | Cluster size |
| R superior corona radiata (csp, cpt, str) | 4.83 | 20, −19, 39 | 295 | |
| R corpus callosum (splenium) | 4.62 | 22, −50, 21 | 236 | |
| Heterogeneous group (sporadic + familial) | ||||
| Cortical thickness | Region | t score | Coordinates (x,y,z) | Area (mm2) |
| L angular gyrus | 4.1 | −4 −69 22 | 103 | |
| L sensorimotor (respiration) | 3.4 | −14 −32 61 | 86 | |
| L insula | 3.5 | −56 | 81 | |
| Fractional anisotropy | Region | t score | Coordinates (x,y,z) | Cluster size |
| R superior corona radiata (csp, cpt, str) | 4.56 | 20 −18 39 | 236 | |
| Sporadic SD versus familial SD | ||||
|---|---|---|---|---|
|
| ||||
| Homogeneous group (ADSD only) | ||||
| Cortical thickness | Region | t score | Coordinates (x,y,z) | Area (mm2) |
| L superior temporal gyrus | 4 | −77 | 193 | |
| R insula | 3.2 | 42 −8 1 | 161 | |
| R SMA | 3.2 | 3 −25 72 | 82 | |
| Fractional anisotropy | Region | t score | Coordinates (x,y,z) | Cluster size |
| R sagittal stratum (ifo/ilf, ptr) | 4.2 | 42, −33, −11 | 84 | |
| L superior longitudinal fasciculus | −4.2 | −44, −34, 33 | 53 | |
| Heterogeneous group (ADSD + ABSD) | ||||
| Cortical thickness | Region | t score | Coordinates (x,y,z) | Area (mm2) |
| L superior temporal gyrus | 4.3 | −77 | 224 | |
| R middle temporal gyrus | 3 | 67 −31 −15 | 132 | |
| R SMA | 3.3 | 4 −25 73 | 91 | |
| Fractional anisotropy | Region | t score | Coordinates (x,y,z) | Cluster size |
| L superior longitudinal fasciculus | −4.02 | −44 −35 33 | 91 | |
For each significant cluster in the CT analyses, peaks of t-test score, P value, peak coordinates, area (mm2, CT analyses), and cluster size (FA analyses) are reported.
ifo, inferior fronto-occipital fasciculus; ilf, inferior longitudinal fasciculus; ptr, posterior thalamic radiation; csp, corticospinal tract; cpt, corticopontine tract; str, superior thalamic radiation; CC, corpus callosum; L, left hemisphere; R, right hemisphere.
FIG. 1.
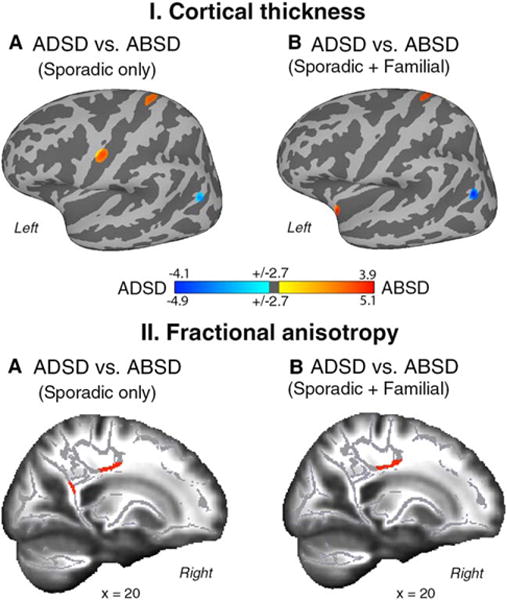
Group statistics of the comparison between ADSD and ABSD patients for cortical thickness (CT, panel I) and fractional anisotropy (FA, panel II). Regions of altered CT are superimposed on the inflated cortical surface of the MNI_305 template and thresholded at Pcorr < 0.01 with a minimum surface area of 80 mm2. TBSS results are shown on a series of sagittal slices of the subjects’ average FA maps transformed in the MNI standard brain. Maps were thresholded at Pcorr < 0.01 with a minimum cluster size of 50 voxels. The color bar represents t scores of group statistical comparisons. (A) Differences between homogeneous groups of ABSD and ADSD patients. (B) Differences between heterogeneous groups of ABSD and ADSD patients.
Comparisons between genotypically heterogeneous groups of familial+sporadic ADSD and familial+sporadic ABSD patients found CT changes in the left respiratory region of the primary sensorimotor cortex, anterior insula, and angular gyrus (Table 2, Fig. 1-IB), as well as FA differences in white matter extending from the CC to the right SCR underlying the precentral gyrus (Table 2, Fig. 1-IIB).
These data point to structural alterations in the left respiratory region of the primary sensorimotor cortex, angular gyrus, and right SCR as phenotype-specific abnormalities that are independent of the SD putative genotype (Fig. 3B). In contrast, differences in the laryngeal/orofacial representation of the left sensorimotor cortex, insula, and CC splenium may represent neural correlates of SD linked to interactions between its phenotype and genotype.
FIG. 3.
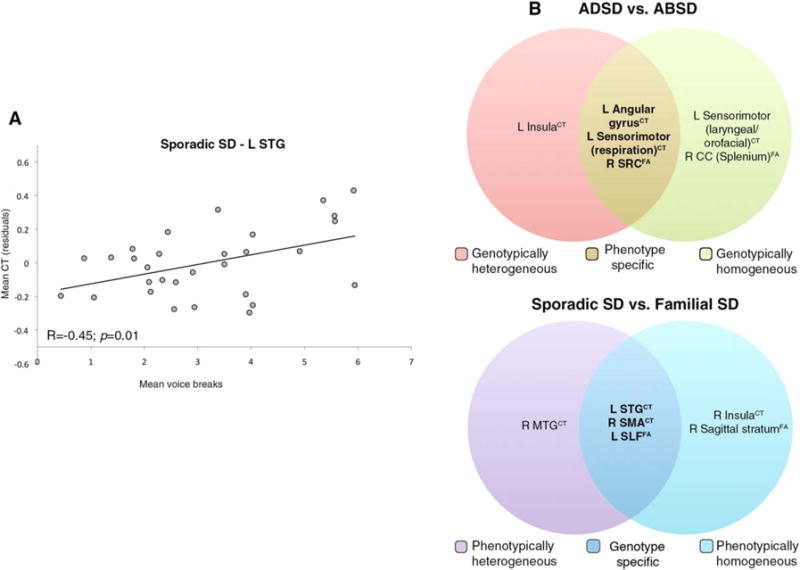
(A) Correlation between CT and mean number of voice breaks in the STG. (B) Diagram visually summarizing core genotypic and phenotypic alterations in CT and FA measures. CT, cortical thickness; FA, fractional anisotropy; STG, superior temporal gyrus; SCR, superior corona radiata; CC, corpus callosum; SMA, supplementary motor area; SLF, superior longitudinal fasciculus; MTG, middle temporal gyrus.
Genotype-Specific Structural Alterations: Sporadic Versus Familial SD
Comparisons between phenotypically homogenous groups of sporadic ADSD and familial ADSD patients found CT differences in the left superior temporal gyrus (STG), right insula, and supplementary motor area (SMA-proper; Table 2, Fig. 2-IA), as well as FA changes in the arcuate portion of the left superior longitudinal fasciculus (SLF) underlying the supramarginal gyrus (SMG) and right sagittal stratum (Table 2, Fig. 1-IIA).
FIG. 2.
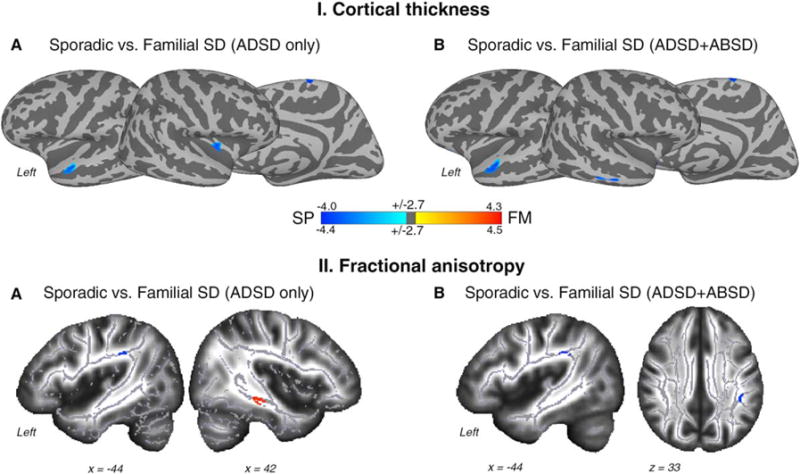
Group statistics of the comparison between sporadic and familial SD patients for cortical thickness (CT, panel I) and fractional anisotropy (FA, panel II). Regions of altered CT are superimposed on the inflated cortical surface of the MNI_305 template and thresholded at Pcorr < 0.01 with minimum surface area of 80 mm2. TBSS results are shown on a series of sagittal and axial slices of the subjects’ average FA maps transformed in the MNI standard brain. Maps were thresholded at Pcorr < 0.01 with a minimum cluster size of 50 voxels. The color bar represents t scores of group statistical comparisons. (A) Differences between homogeneous groups of sporadic and familial SD patients. (B) Differences between heterogeneous groups of sporadic and familial SD patients.
Comparisons between the phenotypically heterogeneous groups of familial ADSD+ABSD and sporadic ADSD+ABSD patients found CT changes in the left STG, right middle temporal gyrus (MTG), and SMA-proper (Table 2, Fig. 2-IB) and an FA change in the left SLF underlying the SMG (Table 2, Fig. 2-IIB).
These data suggest that genotype-specific structural alterations in the left STG, right SMA, and SLF are independent of the SD clinical phenotype (Fig. 3B), whereas changes in right insula, MTG, and sagittal stratum may reflect phenotype-genotype interactions.
Clinical Correlates of Structural Alterations
We found a positive relationship between CT in the left STG and the mean number of voice breaks (r = 0.44, P = 0.01) in sporadic SD patients only (Fig. 3A). No significant relationships were found between the disorder duration or age at SD onset and CT or FA measures.
Discussion
We have demonstrated that phenotype- and genotype-specific structural alterations characterized the clinical diversity of SD, potentially contributing to the pathophysiology of this disorder. As discussed below, these structural abnormalities were identified within the cortical sensorimotor network, as well as in white matter pathways of the speech production network.20,21
SD Phenotype-Specific Structural Alterations
SD phenotype-specific CT alterations were found in the left dorsal primary sensorimotor cortex, which contains the motor representation of voluntary breathing as used in speech, playing wind instruments, and other voluntary laryngeal behaviors.22,23 Although typical SD patients do not experience apparent spasms in respiratory muscles, the voice quality differs between the ADSD and ABSD forms, with ABSD exhibiting abnormal breathing-voicing coordination during laryngeal spasms. A recent fMRI study showed that SD patients (ABSD more than ADSD) have functional abnormalities in the primary sensorimotor cortex not only during symptomatic syllable production but also during various asymptomatic tasks, including breathing.24 It is plausible that structural alterations in the respiratory motor cortex may underlie the previously identified functional aberrations in this region, collectively reflecting the distinct pathophysiological mechanisms of the voluntary control over adductor (affected in ADSD) and abductor (affected in ABSD) laryngeal muscles. The possibility that distinct aspects of primary motor control distinguish the ADSD and ABSD phenotypes is further supported by our findings of distinct white matter alterations in the precentral gyrus, carrying the descending corticobulbar and corticopontine tracts.
Another prominent feature specific to the SD phenotype was CT alterations in angular gyrus, a parietal associative region controlling heteromodal sensorimotor integration. Angular gyrus receives efferents from Broca’s area and premotor regions via the superior longitudinal fasciculus and from auditory regions via the middle longitudinal fasciculus.25 It partakes in the phonological-articulatory loop of working memory during speech and language production,26,27 whereas its connectivity with the premotor cortex modulates the activity of the primary motor cortex.28 Our recent study demonstrated that ADSD and ABSD phenotypes can be classified based on abnormal functional connectivity of the primary sensorimotor and parietal brain regions.29 As such, the angular gyrus may be one of the important regions for motor-auditory integration in SD, and alterations of this area may affect mapping phonological to articulatory information during speaking.
SD Genotype-Specific Structural Alterations
While the SD phenotype was characterized by primary and secondary sensorimotor alterations, genotype-specific alterations in sporadic vs familial SD were found in the SMA and STG, as well as in the SLF bundle linking motor to posterior temporal cortices. Connected to the primary motor, prefrontal cortex, and subcortical structures, the SMA is a hub of the motor preparatory loop30 that regulates higher-order processing of motor functions. It has been proposed to partake in the dorsal pathway of speech and language processing, underlying articulatory aspects and mapping of motor-to-auditory representations. The portion of SMA showing differences between sporadic and familial SD cases was located in its caudal-most part (SMA-proper), which is involved in the control of learned movements and movement execution.31 This finding suggests that CT differences in SMA may reflect distinct processing of motor functions closer to those performed by the primary motor cortex.
Another characteristic aspect of genotype-specific alterations in SD was the involvement of secondary association processes for speech production.32 In particular, the anterior portion of the STG, where CT changes were observed, is consistent with functional identification of a “voice” area, which has been shown to exhibit greater activation in association with vocal auditory stimuli compared with nonvocal sounds.33–35 This region also showed a positive correlation with SD symptoms in sporadic SD patients, which suggests that abnormalities in STG may particularly affect individuals without a familial history of dystonia.
As auditory-phonological impairments are not clinically apparent in SD patients, the exact role of abnormal temporal areas in its pathophysiology remains unclear. One possibility is that differences in temporal regions between sporadic and familial patients are modulated by alterations in motor areas, as the concerted activity of these regions is necessary for normal speech functions. In support of this hypothesis, our findings show that SD genotypes present not only with alterations in the SMA-proper and temporal areas, but also in the SLF, which connects motor areas in the frontal lobe to temporoparietal regions. The portion of the SLF affected in the comparison between familial and sporadic patients included the arcuate fasciculus, which, by relaying information from the inferior frontal and motor regions to the posterior portion of the STG, allows for integration of motor, phonological, and lexicosemantic aspects of speech and language processing.36 Furthermore, recent neuroimaging evidence shows that, relative to healthy subjects, different forms of task-specific dystonia, including SD, lack a premotor region as a functional connectivity hub but have a new hub not present in healthy subjects in the temporal areas, including the STG and insula.37 When differences in functional network integration were compared between familial and sporadic patients, it was found that the SD genotype was characterized not only by abnormalities in sensorimotor regions, similar to the SD phenotype, but also altered frontoparietal connectivity.29 Thus, in contrast to its phenotype, the SD genotype could present with additional abnormalities in temporal regions for heteromodal sensorimotor integration and cognitive control.
Structural Alterations Common to SD Phenotype and Genotype
Alongside phenotype- and genotype-specific structural alterations, we identified abnormalities that were common to both the SD phenotype and putative genotype. Among these, CT changes in the left laryngeal/orofacial motor cortex and insula as well as in white matter of the right CC splenium were largely consistent with previous neuroimaging studies in SD,4,6,7,24 suggesting a complex pattern of alterations involving the primary motor and association regions. Together with SD phenotype-specific findings in the motor respiratory region, CT changes in the orofacial/laryngeal motor cortex indicate that the pattern of primary sensorimotor abnormalities in SD is less localized and rather extends along the central sulcus, affecting control of the respiratory source as well as articulatory representations of speech.
Differences in CT were also found in the insula. Among other functions, the insula regulates motor aspects of speech processing38 and autonomic responses controlling voluntary respiration.30 Notably, the affected portion of the insula was located in its anterior region, which is connected with the speech motor cortex.39 Thus, it is possible that changes in this area underlie differences in the sensorimotor network reaching from the central sulcus to peri-Sylvian areas primarily involved in motor aspects of speech production.
When SD patients were stratified by their putative genotype, we found common alterations in heteromodal regions (MTG, insula) and association pathways (sagittal stratum) of the temporal lobe. These structural aberrations complement the core SD genotype-specific features described above by expanding the pattern of differences between sporadic and familial patients to the secondary temporal lobe regions involved in integrating auditory/phonological information. Differences in the insula in relation to SD genotype and phenotype suggest that this region may not only be an important substrate of SD, but that its distinct portions may be differentially compromised in different forms of the disorder. In contrast to the insular cluster described in relation to the SD phenotype, insular CT differences in the SD genotype were found in its caudal region, which has extensive connections with Wernicke’s area.39 Thus, although changes in the anterior insula fit the possibility that primary motor laryngeal/orofacial/respiratory alterations discriminate SD phenotypes, differences in its posterior region are consistent with the pattern of temporal regions, suggesting abnormalities of associative processes in the SD genotype.
Differences between familial and sporadic cases in the temporal lobe also extended to white matter underlying the insula and STG, comprising the inferior longitudinal and inferior fronto-occipital fasciculi contained in the sagittal stratum. Providing a hub of integration for information traveling to and from the occipital, temporal and frontal lobes,40 these tracts are part of the ventral stream of language processing, which underlies sensory integration and phonological/lexical processing of speech and language.36 Again, this finding is consistent with the differences we found in CT, indicating that SD genotypes may be best characterized by abnormalities in associative aspects of voice and speech processing. However, the nature of these abnormalities in relation to SD clinical manifestations remains to be elucidated. It should be noted that STG and SLF are moderately to highly heritable.13,41 Thus, interindividual differences in these regions may directly reflect hereditary influences.
Finally, we found that phenotype-related abnormalities may be influenced by genotype in the white matter of the CC splenium. Carrying commissural fibers between parietal, occipital and temporal areas,42 this structure integrates heteromodal information and interhemispheric communication. This finding may explain a bilateral or even somewhat right-hemisphere-localized pattern of abnormalities in SD,7,24,37 despite that fact that speech is a left-hemisphere-dominant behavior.
In summary, our study demonstrated that SD phenotypes may be distinguished on the basis of sensorimotor integration for speech production and pinpointed focal structural abnormalities in areas of the motor control of speech production and auditory-motor integration. By contrast, SD genotypes were associated with structural changes in higher-order extra-Sylvian regions and their connecting pathways, thus suggesting a role of the temporal lobe in genotype-related SD pathophysiology.
Acknowledgments
We thank Amanda Pechman, BA, Ian Farwell, MSG, Heather Alexander, BA, Melissa Choy, BA, and Estee Rubien-Thomas, BA, for their help with patients’ recruitment and data collection.
Funding agencies: This work was supported by the National Institute on Deafness and Other Communication Disorders, National Institutes of Health (R01DC01805 to K.S.).
Footnotes
Relevant conflicts of interest/financial disclosures: none.
References
- 1.Blitzer A, Brin MF, Stewart C. Botulinum toxin management of spasmodic dysphonia (laryngeal dystonia): a 12 year experience in more than 900 patients. Laryngoscope. 1998;108:1435–1441. doi: 10.1097/00005537-199810000-00003. [DOI] [PubMed] [Google Scholar]
- 2.Kirke DN, Frucht SJ, Simonyan K. Alcohol responsiveness in laryngeal dystonia: a survey study. J Neurol. 2015;262(2):1548–1556. doi: 10.1007/s00415-015-7751-2. [DOI] [PMC free article] [PubMed] [Google Scholar]
- 3.Ramdhani RA, Kumar V, Velickovic M, Frucht SJ, Tagliati M, Simonyan K. What’s special about task in dystonia? A voxel-based morphometry and diffusion weighted imaging study. Mov Disord. 2014;29(9):1141–1150. doi: 10.1002/mds.25934. [DOI] [PMC free article] [PubMed] [Google Scholar]
- 4.Simonyan K, Ludlow CL. Abnormal structure-function relationship in spasmodic dysphonia. Cereb Cortex. 2012;22(2):417–425. doi: 10.1093/cercor/bhr120. [DOI] [PMC free article] [PubMed] [Google Scholar]
- 5.Kirke DN, Battistella G, Kumar V, et al. Neural correlates of dystonic tremor: a multimodal study of voice tremor in spasmodic dysphonia. Brain Imaging Behav. 2016 doi: 10.1007/s11682-016-9513-x. [Epub ahead of print] [DOI] [PMC free article] [PubMed] [Google Scholar]
- 6.Kostic VS, Agosta F, Sarro L, et al. Brain structural changes in spasmodic dysphonia: a multimodal magnetic resonance imaging study. Parkinsonism Relat Disord. 2016;25:78–84. doi: 10.1016/j.parkreldis.2016.02.003. [DOI] [PubMed] [Google Scholar]
- 7.Simonyan K, Tovar-Moll F, Ostuni J, et al. Focal white matter changes in spasmodic dysphonia: a combined diffusion tensor imaging and neuropathological study. Brain. 2008;131(Pt 2):447–459. doi: 10.1093/brain/awm303. [DOI] [PMC free article] [PubMed] [Google Scholar]
- 8.Termsarasab P, Ramdhani RA, Battistella G, et al. Neural correlates of abnormal sensory discrimination in laryngeal dystonia. Neuroimage Clin. 2016;10:18–26. doi: 10.1016/j.nicl.2015.10.016. [DOI] [PMC free article] [PubMed] [Google Scholar]
- 9.Waugh JL, Kuster JK, Levenstein JM, et al. Thalamic volume is reduced in cervical and laryngeal dystonias. PLoS One. 2016;11(5):e0155302. doi: 10.1371/journal.pone.0155302. [DOI] [PMC free article] [PubMed] [Google Scholar]
- 10.Eyler LT, Chen CH, Panizzon MS, et al. A comparison of heritability maps of cortical surface area and thickness and the influence of adjustment for whole brain measures: a magnetic resonance imaging twin study. Twin Res Hum Genet. 2012;15(3):304–314. doi: 10.1017/thg.2012.3. [DOI] [PMC free article] [PubMed] [Google Scholar]
- 11.Hutton C, Draganski B, Ashburner J, Weiskopf N. A comparison between voxel-based cortical thickness and voxel-based morphometry in normal aging. Neuroimage. 2009;48(2):371–380. doi: 10.1016/j.neuroimage.2009.06.043. [DOI] [PMC free article] [PubMed] [Google Scholar]
- 12.Hulshoff Pol HE, Schnack HG, Posthuma D, et al. Genetic contributions to human brain morphology and intelligence. J Neurosci. 2006;26(40):10235–10242. doi: 10.1523/JNEUROSCI.1312-06.2006. [DOI] [PMC free article] [PubMed] [Google Scholar]
- 13.Kochunov P, Jahanshad N, Marcus D, et al. Heritability of fractional anisotropy in human white matter: a comparison of Human Connectome Project and ENIGMA-DTI data. Neuroimage. 2015;111:300–311. doi: 10.1016/j.neuroimage.2015.02.050. [DOI] [PMC free article] [PubMed] [Google Scholar]
- 14.Battistella G, Termsarasab P, Ramdhani RA, Fuertinger S, Simonyan K. Isolated focal dystonia as a disorder of large-scale functional networks. Cereb Cortex. 2015:pii. doi: 10.1093/cercor/bhv313. bhv313 [Epub ahead of print] [DOI] [PMC free article] [PubMed] [Google Scholar]
- 15.Segonne F, Dale AM, Busa E, et al. A hybrid approach to the skull stripping problem in MRI. Neuroimage. 2004;22(3):1060–1075. doi: 10.1016/j.neuroimage.2004.03.032. [DOI] [PubMed] [Google Scholar]
- 16.Fischl B, Dale AM. Measuring the thickness of the human cerebral cortex from magnetic resonance images. Proc Natl Acad Sci U S A. 2000;97(20):11050–11055. doi: 10.1073/pnas.200033797. [DOI] [PMC free article] [PubMed] [Google Scholar]
- 17.Taylor PA, Saad ZS. FATCAT: (an efficient) Functional and Tractographic Connectivity Analysis Toolbox. Brain connectivity. 2013;3(5):523–535. doi: 10.1089/brain.2013.0154. [DOI] [PMC free article] [PubMed] [Google Scholar]
- 18.Smith SM, Jenkinson M, Johansen-Berg H, et al. Tract-based spatial statistics: voxelwise analysis of multi-subject diffusion data. Neuroimage. 2006;31(4):1487–1505. doi: 10.1016/j.neuroimage.2006.02.024. [DOI] [PubMed] [Google Scholar]
- 19.Simonyan K, Berman BD, Herscovitch P, Hallett M. Abnormal striatal dopaminergic neurotransmission during rest and task production in spasmodic dysphonia. J Neurosci. 2013;33(37):14705–14714. doi: 10.1523/JNEUROSCI.0407-13.2013. [DOI] [PMC free article] [PubMed] [Google Scholar]
- 20.Fuertinger S, Horwitz B, Simonyan K. The Functional Connectome of Speech Control. PLoS Biol. 2015;13(7):e1002209. doi: 10.1371/journal.pbio.1002209. [DOI] [PMC free article] [PubMed] [Google Scholar]
- 21.Simonyan K, Fuertinger S. Speech networks at rest and in action: interactions between functional brain networks controlling speech production. J Neurophysiol. 2015;113(7):2967–2978. doi: 10.1152/jn.00964.2014. [DOI] [PMC free article] [PubMed] [Google Scholar]
- 22.Ramsay SC, Adams L, Murphy K, et al. Regional cerebral blood flow during volitional expiration in man: a comparison with volitional inspiration. J Physiol. 1993;461:85–101. doi: 10.1113/jphysiol.1993.sp019503. [DOI] [PMC free article] [PubMed] [Google Scholar]
- 23.Simonyan K, Saad ZS, Loucks TM, Poletto CJ, Ludlow CL. Functional neuroanatomy of human voluntary cough and sniff production. Neuroimage. 2007;37(2):401–409. doi: 10.1016/j.neuroimage.2007.05.021. [DOI] [PMC free article] [PubMed] [Google Scholar]
- 24.Simonyan K, Ludlow CL. Abnormal activation of the primary somatosensory cortex in spasmodic dysphonia: an fMRI study. Cereb Cortex. 2010;20(11):2749–2759. doi: 10.1093/cercor/bhq023. [DOI] [PMC free article] [PubMed] [Google Scholar]
- 25.Aboitiz F, Aboitiz S, Garcia RR. The phonological loop A key innovation in human evolution. Curr Anthropol. 2010;51:S55–S65. [Google Scholar]
- 26.Binder JR, Desai RH, Graves WW, Conant LL. Where is the semantic system? A critical review and meta-analysis of 120 functional neuroimaging studies. Cereb Cortex. 2009;19(12):2767–2796. doi: 10.1093/cercor/bhp055. [DOI] [PMC free article] [PubMed] [Google Scholar]
- 27.Baddeley A. Working memory and language: an overview. J Commun Disord. 2003;36(3):189–208. doi: 10.1016/s0021-9924(03)00019-4. [DOI] [PubMed] [Google Scholar]
- 28.Shields J, Park JE, Srivanitchapoom P, et al. Probing the interaction of the ipsilateral posterior parietal cortex with the premotor cortex using a novel transcranial magnetic stimulation technique. Clin Neurophysiol. 2016;127(2):1475–1480. doi: 10.1016/j.clinph.2015.06.031. [DOI] [PMC free article] [PubMed] [Google Scholar]
- 29.Battistella G, Fuertinger S, Fleysher L, Ozelius LJ, Simonyan K. Cortical sensorimotor alterations classify clinical phenotype and putative genotype of spasmodic dysphonia. Eur J Neurol. 2016;23(10):1517–1527. doi: 10.1111/ene.13067. [DOI] [PMC free article] [PubMed] [Google Scholar]
- 30.Ackermann H, Riecker A. The contribution(s) of the insula to speech production: a review of the clinical and functional imaging literature. Brain Struct Funct. 2010;214(5–6):419–433. doi: 10.1007/s00429-010-0257-x. [DOI] [PubMed] [Google Scholar]
- 31.Picard N, Strick PL. Motor areas of the medial wall: a review of their location and functional activation. Cereb Cortex. 1996;6(3):342–353. doi: 10.1093/cercor/6.3.342. [DOI] [PubMed] [Google Scholar]
- 32.Price CJ. The anatomy of language: a review of 100 fMRI studies published in 2009. Ann N Y Acad Sci. 2010;1191:62–88. doi: 10.1111/j.1749-6632.2010.05444.x. [DOI] [PubMed] [Google Scholar]
- 33.Belin P, Zatorre RJ, Lafaille P, Ahad P, Pike B. Voice-selective areas in human auditory cortex. Nature. 2000;403(6767):309–312. doi: 10.1038/35002078. [DOI] [PubMed] [Google Scholar]
- 34.Fecteau S, Armony JL, Joanette Y, Belin P. Is voice processing species-specific in human auditory cortex? An fMRI study. Neuroimage. 2004;23(3):840–848. doi: 10.1016/j.neuroimage.2004.09.019. [DOI] [PubMed] [Google Scholar]
- 35.Petkov CI, Kayser C, Steudel T, Whittingstall K, Augath M, Logothetis NK. A voice region in the monkey brain. Nat Neurosci. 2008;11(3):367–374. doi: 10.1038/nn2043. [DOI] [PubMed] [Google Scholar]
- 36.Hickok G, Poeppel D. Dorsal and ventral streams: a framework for understanding aspects of the functional anatomy of language. Cognition. 2004;92(1–2):67–99. doi: 10.1016/j.cognition.2003.10.011. [DOI] [PubMed] [Google Scholar]
- 37.Battistella G, Termsarasab P, Ramdhani RA, Fuertinger S, Simonyan K. Isolated focal dystonia as a disorder of large-scale functional networks. Cereb Cortex. 2015 doi: 10.1093/cercor/bhv313. [Epub ahead of print] [DOI] [PMC free article] [PubMed] [Google Scholar]
- 38.Riecker A, Mathiak K, Wildgruber D, et al. fMRI reveals two distinct cerebral networks subserving speech motor control. Neurology. 2005;64(4):700–706. doi: 10.1212/01.WNL.0000152156.90779.89. [DOI] [PubMed] [Google Scholar]
- 39.Battistella G, Kumar V, Simonyan K. Structural connectivity of the insula underlies its distinct role in speech and language control. Organization for Human Brain Mapping. 2016 [Google Scholar]
- 40.Mori SW, Wakana S, Poetscher LM, van Zijl PCM. MRI Atlas of the Human White Matter. Elsevier; 2005. [Google Scholar]
- 41.Panizzon MS, Fennema-Notestine C, Eyler LT, et al. Distinct genetic influences on cortical surface area and cortical thickness. Cereb Cortex. 2009;19(11):2728–2735. doi: 10.1093/cercor/bhp026. [DOI] [PMC free article] [PubMed] [Google Scholar]
- 42.Hofer S, Frahm J. Topography of the human corpus callosum revisited—comprehensive fiber tractography using diffusion tensor magnetic resonance imaging. Neuroimage. 2006;32(3):989–994. doi: 10.1016/j.neuroimage.2006.05.044. [DOI] [PubMed] [Google Scholar]