


Abstract
We have developed an end-labelling approach to map the positions of nucleosomes and protein binding sites at nucleotide resolution by footprinting micrococcal nuclease (MNase)-sensitive sites. Using this approach we determined that the MFA2 gene and its upstream control regions have four positioned nucleosomes when transcription is repressed in mating type α cells and that the nucleosomes lose their positioning when the gene became transcriptionally active in mating type a cells. We also detected MNase-hypersensitive sites in the α2 operator region of MFA2 in α cells but not in a cells. These probably result from the change in the local DNA conformation due to protein(s) binding in this region that governs MFA2 transcription.
INTRODUCTION
There are three different cell types in the yeast Saccharomyces cerevisiae, haploid mating type a or α cells and a/α diploid cells (1). The haploid cell type is regulated by expression of genes at the active mating type locus (MAT). In α cells gene products of MATα are the α1 and α2 proteins, essential factors for the regulation of mating type-specific genes in α cells. Mating type-specific gene regulation also requires the product of MCM1, the transcription factor PRTF/GRM (pheromone receptor transcription factor/general regulator of mating), which can bind to the P box (Mcm1 binding site) and act synergistically with the α1 protein as a co-activator of α-specific genes or with the α2 protein as a co-repressor of a-specific genes in α cells (2–5). In S.cerevisiae, five a-specific genes, MFA1, MFA2, STE2, STE6 and BAR1, have an α2 operator, a 31 bp sequence ∼200 bp upstream of the transcription start point (6) consisting of a P box (Mcm1 binding site) flanked by two α2 binding sites. In α cells, the Mcm1 and α2 factors cooperatively bind to the α2 operator in the control region of a-specific genes to repress them. Studies show that repression also requires a protein complex, Ssn6–Tup1, which has been identified as a general transcription repressor in yeast (7).
The repression of mating type a-specific genes in α cells by the mechanism described above is coupled with a different chromatin organization. By analysis of the chromatin structure of the multicopy TRP1/ARS1 yeast plasmid containing the α2 binding site for the α2 repressor, Roth et al. (8) indicated that nucleosomes were stably positioned over sequences adjacent to the α2 binding site in the presence of the repressor (Mcm1/α2). The chromatin structures of two a cell-specific genes, STE6 and BAR1, were analysed and nucleosomes were precisely positioned in α cells but not in a cells (9). These results suggest a relationship between the organization of chromatin and repression of a cell-specific genes in α cells. Recent results also show that the organized chromatin domain of the repressed STE6 gene contains two molecules of Tup1 per nucleosome (10). Deletion of TUP1 results in derepression of the a cell-specific genes and disruption of the positioned nucleosomes adjacent to the α2 operator (11).
One of the mating type a-specific genes, MFA2, encodes an a-factor precursor (12). The upstream control region of MFA2 contains a TATA box and an α2 operator. Since regulation of MFA2 is easily controlled by mating type selection and the size of this gene is small (coding region 117 bp, transcribed region 328 bp), we have adopted MFA2 as a model gene for DNA repair investigations at nucleotide resolution (13–16). Here we describe how our end-labelling method developed to examine DNA damage (13) has been adapted to map nucleosome positions and the regulatory protein binding sites on the MFA2 gene. The technique provides a simple approach to map micrococcal nuclease (MNase)-sensitive sites at nucleotide resolution and allows nucleosomes to be mapped directly on native chromatin rather than on plasmids or PCR amplified copies of genomic chromatin.
MATERIALS AND METHODS
Yeast strains
Strains PSY316 (MATα ade2-101 ura 3-52 leu 2-3,112 Δhis 3-200 lys2 trp1) and PSY316 (MATa ade2-101 ura 3-52 leu 2-3,112 Δhis 3-200 lys2 trp1) were used.
Preparation of total RNA for northern blotting
Yeast total RNA was extracted using a Qiagen RNA extraction kit as per the instructions. RNA electrophoresis, northern transfer of RNA to Gene Screen Plus membranes (DuPont de Nemours), preparation of the membranes after transfer for probing, hybridization and membrane washing were all undertaken as described in Gene Screen Plus Hybridization Transfer Membranes—Transfer and Detection Protocols, as supplied by DuPont de Nemours. The labelling results were obtained and quantified by phosphorimaging (Molecular Dynamics).
Preparation of RNA and DNA probes
For the MFA2 RNA probe: primer A, 5′-biotin-CTATCATCTTCATACAACAATAACTACCA-3′; primer B, 5′-CTAATGATGAGAGAATTGGAATAAATTAG-3′. For the ACT1 RNA probe: primer A, 5′-biotin-GCCGGTTTTGCCGGTGACG-3′; primer B, 5′-CCGGCAGATTCCAAACCCAAAA-3′. For the low resolution nucleosome mapping probe: primer A, 5′-biotin-TACGAGGGAACAGGAAGGTC-3′; primer B, 5′-CAACCAGTCACGGAAAAGCTTTTCG-3′.
Standard PCR was carried out using primers A and B to amplify the sequences of interest. Aliquots of 100 µg washed Dynabeads (Dynal) were added to 5 µl of PCR product to bind to the biotin at the 5′-end of the extended primer A. The Dynabeads with the associated PCR product were collected using a magnetic particle concentrator (Dynal) and the supernatant discarded. The Dynabeads were resuspended in 20 µl of 0.1 N NaOH to denature the double-stranded DNA. The biotinylated strand associated with the beads was collected using a magnetic particle concentrator and washed twice with 60 µl of H2O, then resuspended in 10 µl of H2O with addition of 2 pmol primer B. The tube was incubated at 65°C for 2 min, then allowed to slowly cool to room temperature over 15–30 min. The beads and bound fragments were washed twice with 60 µl of water and resuspended in 15 µl of water. Aliquots of 6 µl of 5× Sequenase reaction buffer (Amersham), 4 µl of dNTP buffer (0.1 mM dTTP, dGTP and dCTP), 2 µl of [32P]dATP (6000 Ci/mmol; Amersham), 2 µl of 0.1 M DTT and 1 µl of Sequenase (Amersham) were added. Primer B was extended using the biotinylated strand as template, at 37°C for 10 min. The beads with the associated double-stranded DNA fragment were washed with 60 µl of water and then resuspended in 100 µl of water. After incubation at 95°C for 5 min the supernatant containing the synthesized radioactive strand (probe) was separated from the beads and transferred to a fresh tube.
Chromatin extraction, MNase treatment and low resolution nucleosome mapping
These were undertaken as described by Thoma (17).
Creating probes for high resolution mapping
Biotin-labelled probes were created complementary to the 3′-ends of each strand of a restriction fragment in MFA2 (13). Probe 1 is complementary to and anneals to the transcribed strand (TS), whereas probe 2 is complementary to and anneals to the non-transcribed strand (NTS). These probes were designed so that at the 5′-end they had an overhang of six dTTPs followed by six dNTPs (in this case gatagc) and then a 5′-biotin. For the RsaI–RsaI restriction fragment, which is 869 bp in length and contains the upstream promoter region, the transcribed region and the downstream termination region of MFA2: probe 1, 5′-biotin-gatagcttttttACACCATCTACTACATAATTAATTGATAGTTTCCT-3′; probe 2, 5′-biotin-gatagcttttttACGGACTTGATGCACGTGAAAAACCATTATTTAAA-3′. For the RsaI–BfaI fragment (286 bp), which is the immediate upstream region of MFA2: probe 1, 5′-biotin-gatagcttttttACACCATCTACTACATAATTAATTGATAGTTTCCT-3′; probe 2, 5′-gatagcttttttGTGATGTCAATGAACGGATGAACGACAGAA-3′. For the AluI–AluI restriction fragment (659 bp), which is located in the further upstream promoter region of MFA2: probe 1, 5′-biotin-gatagcttttttCTGCCAATACCAATTTTCCTTCTGCCAAA-3′; probe 2, 5′-biotin-gatagcttttttCTTTTTCCTCTCGCTTTGTTCTTTTTCC-3′. The sequences in upper case are complementary to MFA2, whereas the sequences in lower case are the overhang modifications. The six dTTPs in the overhang serve as a template directing the polymerization of six radioactive dATPs at the 3′-end of the annealed MFA2 fragments by T7 DNA polymerase. The 5′-biotin binds to Dynabeads and this binding enables the probes and the associated DNA fragments to be separated from the digested DNA solution with a magnetic particle concentrator. The six dNTP (gatagc) overhang was inserted between six dTTPs and the biotin to avoid steric hindrance of the polymerase due to the proximity of the Dynabead.
Purification of single-stranded fragments and radioactive labelling
An aliquot of 30 µg DNA isolated from chromatin samples was digested with 60 U restriction endonuclease(s) (RsaI, BfaI or AluI; Promega) at 37°C for 1 h in a total reaction volume of 200 µl. The enzyme was removed by phenol/chloroform extraction and the DNA then precipitated using 20 µl of 3 M NaAc and 220 µl of isopropanol at –70°C for 10 min. After centrifugation, the DNA pellets were resuspended in 120 µl of TE buffer. Aliquots of 30 µl of 5 M NaCl and 2 pmol probe 1 were added to the samples. The samples were incubated at 95°C for 5 min and then at 60°C for 15 min to allow the probe to anneal to its complementary MFA2 fragments. To each sample were added 100 µg of washed Dynabeads to bind to the biotin at the 5′-end of the probe. The tubes were placed in a magnetic particle concentrator and the Dynabeads with the attached MFA2 fragments were attracted to the wall of the tube. The supernatant containing the MFA2 NTS fragments and other genomic DNA fragments was removed to a fresh tube for purification of the MFA2 NTS following the same procedure as for the TS except using 2 pmol probe 2. The order of retrieval of TS and NTS has no effect on the labelling result, e.g. probe 2 can be used to retrieve the NTS before TS purification. The beads bound with MFA2 fragments were washed with 60 µl of washing buffer (5 mM Tris–HCl, pH 7.5, 0.5 mM EDTA, 1.0 M NaCl) at 60°C for 5 min and the buffer removed. Second and third washes were performed at room temperature with 60 µl of water. The MFA2 fragments were end-labelled with six [α-32P]dATPs by T7 DNA polymerase (Amersham) using the six dTTP overhang in the probe as template. The labelling reaction was complete after 10 min at 37°C. The labelling medium was removed while the Dynabeads with the bound MFA2 fragments were kept on the wall of the Eppendorf tube. Following two washes with 60 µl of water, the labelled MFA2 fragments were eluted from the Dynabeads at room temperature by the addition of 3 µl of formamide loading buffer (95% formamide, 20 mM EDTA, 0.05% Bromophenol blue). The eluted fragments were resolved by electrophoresis on a 6% denaturing polyacrylamide gel. The running buffer was TBE (89 mM Tris base, 89 mM boric acid, 2.5 mM Na2EDTA·2H2O) and electrophoresis was carried out in a field of 40 V/cm. The gel was analysed by phosphorimaging (Molecular Dynamics).
RESULTS
MFA2 mRNA expression levels
MFA2 is actively transcribed by RNA polymerase II in mating type a cells and repressed in mating type α cells. Figure 1 shows RNA blots detecting the level of MFA2 mRNA in PSY316 mating type a and α cells. The mRNA level of ACT1 was used as an internal control to standardise loadings. While transcription of ACT1 was similar in both mating type cells, MFA2 transcription was only detected in a cells.
Figure 1.
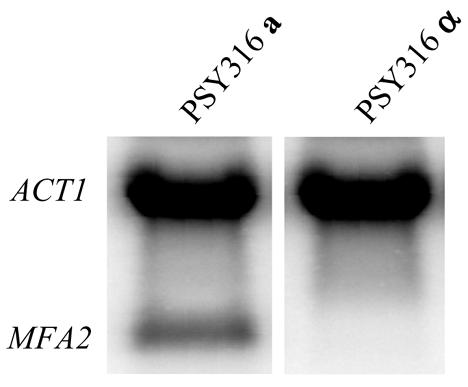
Relative MFA2 mRNA levels in PSY316 a and α mating type cells as determined by northern blot analysis. The loading was standardised using ACT1 mRNA level.
Low resolution mapping of nucleosomes on MFA2
In chromatin, MNase preferentially cuts the linker DNA between nucleosomes, while nucleosomes remain protected. Protected regions of 140–200 bp are interpreted as positioned nucleosomes (17). Chromatin and deproteinized DNA were subjected to limited MNase digestion. The DNA was purified and then digested with the restriction endonuclease BstZ17I, which yields a 2605 bp fragment containing the MFA2 sequence and the control regions. The double-stranded DNA fragments were separated on an agarose gel. Following denaturation, the DNA was transferred to a nylon membrane and hybridized with a 275 nt probe which complements the 3′-end of the BstZ17I fragment. The position of the band indicates the distance of the MNase cutting site from the 3′ restriction site. The autoradiogragh shown in Figure 2 represents the MNase-sensitive sites in the MFA2-containing BstZ17I fragment at low resolution. The strong bands at the top of the gel show the position of the full-length 2605 bp fragment and all the bands below represent shorter fragments due to MNase cutting. The DNA markers on the left of the gel show the actual distance of the sensitive sites from the 3′-end of the BstZ17I fragment. An ∼900 bp region shows a different MNase cutting pattern between a and α cell chromatin. By referring to the size marker, the MFA2 gene and its upstream sequence were located in this region. Some portions in this region in the α cell chromatin are clearly protected from MNase cutting by comparison with the cutting pattern of chromatin extracted from mating type a cells and naked DNA. By analysing the size of the protected portions, two nucleosomes (–2 and –1) were positioned in the promoter region and two nucleosomes (+1 and +2) were positioned in the transcribed region of MFA2. Due to the limitations of the low resolution, the precise positions of the nucleosomes could not be located.
Figure 2.
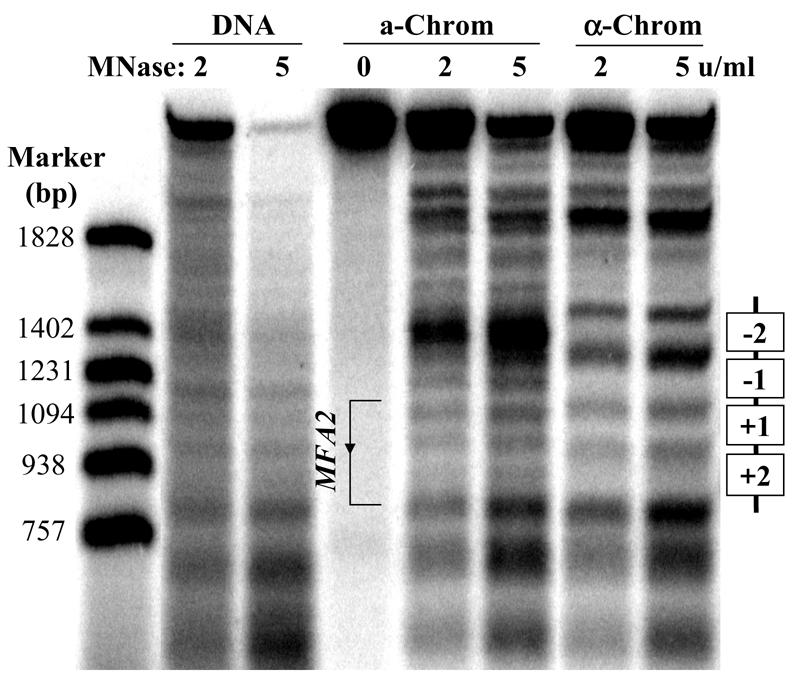
Nucleosome positioning by a low resolution method. The amounts of MNase used are indicated at the top of each lane. The numbers to the left of the markers show the sizes (bp) of the bands. The positioned nucleosomes in α cells are shown as open rectangles to the right of the gel.
High resolution mapping of nucleosomes on MFA2
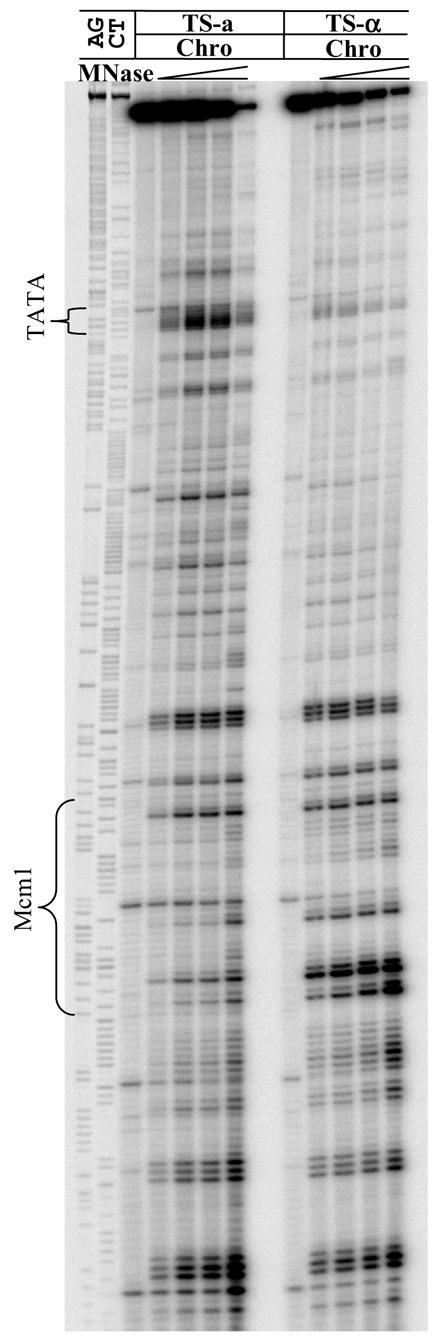
The nucleotide resolution mapping method previously employed to detect UV-induced cyclobutane pyrimidine dimers (CPDs) (13) was first applied to the RsaI and AluI fragments of MFA2 to footprint the MNase-sensitive sites. The RsaI fragment (869 bp) contains the transcribed region of MFA2 and its upstream and downstream flanking sequences. The AluI fragment (659 bp) contains only the upstream control region and overlaps with the RsaI fragment. Figure 3 shows typical gels for the mapping of MNase-sensitive sites in the TS and NTS of the RsaI (Fig. 3A) and AluI (Fig. 3B) fragments of MFA2. The lanes marked AG and CT are reference sequence ladders. For each set of chromatin samples (four lanes, left to right) the MNase used was 0, 1, 2 and 5 U/ml. For each set of naked DNA samples (two lanes, left to right) the MNase used was 2 and 5 U/ml. In the lane without MNase treatment, the strong band at the top of the gel is the full-length fragment. Smaller bands in this lane are from non-specific labelling or spontaneous breakage of the fragment and are treated as a background signal in MNase-treated samples. It is essential to subtract them so as to identify cuts due specifically to MNase. Starting with a low amount of MNase the majority of the restricted DNA fragments remain uncut, presenting a strong band at the top of the gel. With increasing amounts of MNase the signal of the top band decreases and the density of the bands representing smaller fragments due to MNase cutting increases. For easy comparison, the lane with an appropriate amount of MNase treatment (in this case the lanes with 2 U/ml MNase treatment, signal distributed evenly down the lane) was selected for scanning with ImageQuaNT software (Molecular Dynamics). The scanning graphs are shown in Figure 4. The MNase cutting pattern in naked DNA is similar to that in a cell chromatin, but is different from that in α cell chromatin. By referring to the sequence ladder run with the samples, we were able to position four nucleosomes in the MFA2 upstream and transcribed regions in α cells in which MFA2 is repressed. Nucleosome –2 is located upstream of the α2 operator approximately at positions –412 to –272; nucleosome –1 is located in the region between the Mcm1 binding site and the transcription start point approximately at positions –207 to –61 and contains the TATA box in the middle of the nucleosomal DNA. The Mcm1 binding site is located in the linker region between nucleosome –1 and –2. Nucleosome +1 is located in the first half of the transcribed region approximately at positions –59 to +88 and nucleosome +2 is located in the second half of the transcribed region approximately at positions +122 to +254. Nucleosome positioning in one strand was confirmed by a similar analysis of the complementary strand (Figs 3 and 4).
Figure 3.


Typical footprinting autoradiographs showing MNase-sensitive sites in the TS and NTS of the MFA2-containing RsaI restriction fragment (A) and the AluI restriction fragment (B) for PSY316 a and α cells. The Sanger reference sequence is shown along the left hand side in the combinations A and G, C and T. Nucleotide positions are indicated by numbers (relative to the ATG translation start site). The arrow indicates the transcription start site. The Mcm1 binding site and the TATA box are indicated. Chromatin samples from each mating type were treated with increasing amounts of MNase. For each set of chromatin samples (four lanes, left to right) the MNase concentrations used were 0, 1, 2 and 5 U/ml. For each set of naked DNA samples (two lanes, left to right) the MNase concentrations used were 2 and 5 U/ml. The positioned nucleosomes in α cells are indicated as ellipses.
Figure 4.
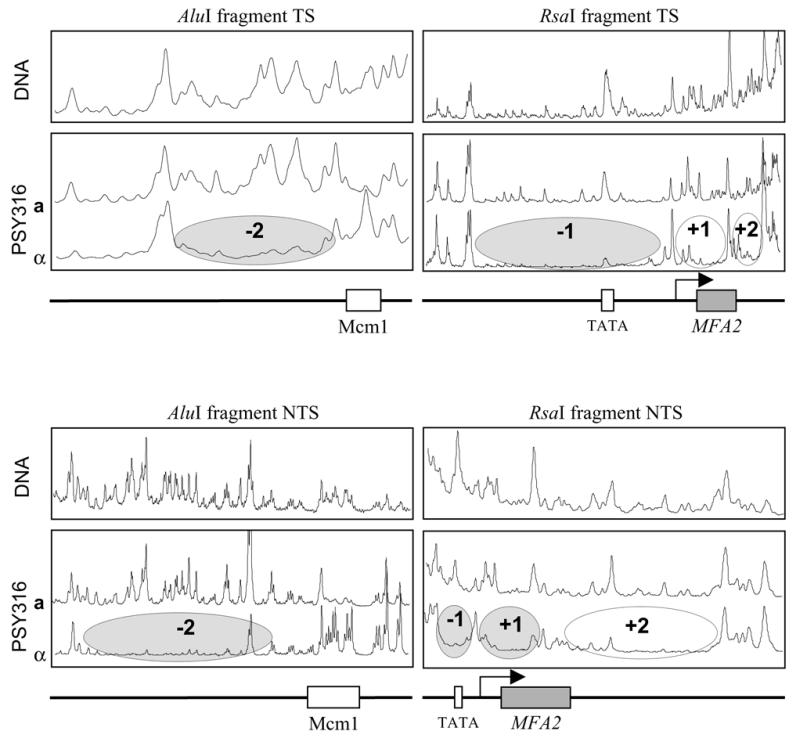
Relative MNase sensitivity is expressed graphically after scanning the TS and NTS gels as shown in Figure 3. (Right) MNase-sensitive sites in the RsaI fragment, which contains the MFA2 transcribed region and its upstream and downstream non-transcribed regions. (Left) MNase-sensitive sites in the AluI fragment, which contains the further upstream control region of MFA2. The arrow indicates the transcription start site. The ellipses represent the positioned nucleosomes in α cells. +1 and +2 are the two nucleosomes located in the transcribed region of MFA2 and –1 and –2 are the two nucleosomes located in its control region.
A possible concern with our approach was consistent retrieval of single-stranded DNA fragments and whether retrieval could vary with their length. To address this possible concern, we applied this approach to a shorter fragment, the RsaI–BfaI fragment (286 bp), which is a part of the RsaI restriction fragment containing the Mcm1 binding site and the TATA box in the upstream control region of MFA2. Figure 5 shows a typical autoradiograph for MNase footprints in the TS of this fragment in a and α cells: the Mcm1 binding site and the TATA box are indicated. The five lanes from left to right for each mating type have samples treated with increasing amounts of MNase: 0, 1, 2, 5 and 10 U/ml chromatin, respectively. The scanning graphs of a lane with an appropriate amount of MNase treatment from each mating type are shown in Figure 6. Comparing the same position in Figures 3 and 4, the MNase cutting patterns in the small RsaI–BfaI fragment and the large RsaI fragment are the same. In the region containing the TATA box, chromatin in a cells shows more MNase sensitivity than in α cells, whereas in the α2 operator, chromatin in α cells is hypersensitive to MNase compared to that in a cells.
Figure 5.
Typical footprinting autoradiographs showing MNase-sensitive sites in the RsaI–BfaI restriction fragment of the TS of the control region of MFA2 for PSY316 a and α cells. The Sanger reference sequence is shown along the left hand side in the combinations A and G, C and T. The Mcm1 binding site and the TATA box are indicated. Chromatin samples from each mating type were treated with increasing amounts of MNase. For each set of samples (five lanes) the MNase concentrations used were 0, 1, 2, 5 and 10 U/ml of chromatin, respectively.
Figure 6.

A comparison of MNase-sensitive sites in the control region of MFA2 in PSY316 a and α cells. The lanes in Figure 3 with an evenly distributed signal (treated with an appropriate amount of MNase, in this case 5 U/ml) were selected for scanning using MD ImageQuaNT software (Molecular Dynamics). The MNase-sensitive regions are shown as peaks.
It should be noted that in the positioned nucleosome regions in α cells we still detected bands due to MNase cutting, especially for the nucleosomal DNA towards the ends of a nucleosome, although the signal of these bands was weaker than that in the same position in a cells. There are three possible explanations for this phenomenon. (i) Chromatin is a dynamic organization of nucleosomes and associated DNA. About 146 bp of nucleosomal DNA winds around a histone octamer. The contact between DNA and histone octamer close to the ends of nucleosomal DNA may not be as tight as at the centre of the nucleosomal DNA and nucleosomes may slide on the DNA in either direction (18). Either of these may provide more accessibility for MNase to the ends of nucleosomal DNA than to DNA at the centre. This may account for the MNase-sensitive sites detected in the nucleosome region towards either end of nucleosomes. (ii) The detected bands reflect MNase cutting in a population of cells. In α cells the chromatin exists in a repressed state at the MFA2 locus, hence MFA2 mRNA is undetectable. The positioned nucleosomes represent the chromatin status of the majority of the cell population. However, there may be a small fraction of cells in which the nucleosomes are not stable or closely overlap or exist at different positions. Hence, MNase cutting in nucleosome-free regions in this small fraction of cells may account for the bands detected in the nucleosomal region which are protected from MNase cutting in the majority of α cells. (iii) Although MNase preferentially cuts double-stranded DNA at linker regions, it may still introduce nicks in the single strand of nucleosomal DNA (17). This high resolution mapping technique not only maps double strand cutting, but also picks out signals due to single-strand breaks. Hence, it is essential to analyse both strands, as we have done here, to position nucleosomes more accurately. Nevertheless, due to the limitation of available MNase cutting sites at the edges of nucleosomes, positions given may vary by a few base pairs.
DISCUSSION
The biotinylated probe-directed enriching and end-labelling method provides researchers with a simple procedure for nucleotide resolution footprinting of MNase-sensitive sites and positioning of nucleosomes. In this paper, the method has been successfully applied to map nucleosomes directly on genomic chromatin rather than on a constructed plasmid or via PCR amplified genomic copies which may introduce bias during a number of cycles of PCR for fragments of different length. The advantages of our approach result from biotinylation of the oligonucleotide, which enables the use of Dynabeads and a magnet to separate the probe with the associated DNA fragments from the solution. This design ensures enrichment of fragments for a strong labelling signal. The purification procedure is simple and not time consuming. Fragment purification using the probes is strand selectable, hence, the two strands of the gene of interest can be purified separately from the same DNA digestion. Additionally, the purified DNA fragments are end-labelled directly on Dynabeads using the probe as template. Since the footprints of MNase-sensitive sites are independent of the length of the restriction fragments, one can use a large restriction fragment for overall mapping and a small restriction fragment for detailed footprints and better resolution. All these features make this procedure simpler and more efficient, with fewer radioactive manipulations. The limitation of this method is that it does require a relatively large amount of DNA (∼30 µg yeast DNA) for measurable cutting signals compared with other mapping methods that rely on a PCR amplified signal (9).
The existence of a set of mating type-specific genes in S.cerevisiae provides an ideal system in which to study chromatin organization as these genes are active or inactive in different mating types. They can be employed to investigate the effects of chromatin organization on transcription and DNA repair. Cell type-specific factors cooperate with several other regulatory proteins, including Mcm1, Ste12, Ssn6 and Tup1, to govern the cell-specific patterns of gene expression, probably through modulation of the chromatin structure of these mating type-specific genes in different mating type cells. Of the a-specific genes (MFA1, MFA2, STE2, STE6 and BAR1), STE6 and BAR1 have been shown to have a nucleosome positioned precisely 15 or 16 bp downstream of the Mcm1/α2 binding site in the promoter region by high resolution mapping (9). This position of a nucleosome in relation to the Mcm1/α2 binding site implies a possible role of binding of Mcm1/α2 in determining the chromatin structure of the related genes. However, binding of Mcm1/α2 is not sufficient in nucleosome organisation, since deletion of TUP1 results in derepression of the a-specific genes and disruption of the positioned nucleosomes adjacent to the Mcm1/α2 binding site (11). As with other a-specific genes, the Mcm1 binding site is located in the promoter region of MFA2. Hence, the chromatin structure of this gene is likely to be organised in the same fashion as other a-specific genes, such as STE6 and BAR1. This has been confirmed by our low and high resolution nucleosome mapping data. Similar to the Mcm1/α2 binding site (CATGTAATTACCGTAAAAGGAAATTACATG) in the promoter region (–264 to –235) of the BAR1 gene, MFA2 has a Mcm1/α2 binding sequence (CATGTATTTACCTATTCGGGAAATTTACATG) in its promoter region (–221 to –251). For MFA2, nucleosome –1 is located in the region downstream of the Mcm1 binding site in mating type α cells: this is consistent with nucleosome mapping for other a-specific genes (9). In a cells the four nucleosomes mapped in α cells in the promoter and transcribed region of the MFA2 gene lost their nucleosomal footprint. Hence, it appears that the chromatin exists in a different state when MFA2 becomes transcriptionally active.
In the TATA box region, the preferential MNase sensitivity in a versus α cells is likely to result from a different organisation of the chromatin. In a cells, the binding of TBP and other RNA polymerase II transcription factors to this region does not hinder MNase cutting. This may be due to the dynamic binding properties of these DNA binding proteins. We cannot rule out the possibility that the binding of regulatory proteins at the TATA box creates MNase-sensitive sites in this region due to a change in local DNA structure. However, in α cells, the TATA box region is located on nucleosome –1, which protects the DNA from MNase cutting.
Since the Mcm1 binding region is located in a linker region between nucleosomes –1 and –2, one might presume that the MNase sensitivity would be the same in a and α cells in this region. However, we observed that MNase-hypersensitive sites exist in this region in α cells but not in a cells. This observation is consistent with a previous report for other a cell-specific genes, STE6 and BAR1 (9). In a cells, Mcm1 binds alone to the DNA in the promoter region, whereas in α cells, α2 factors bind to the DNA at the region flanking the Mcm1 binding site. These data suggest that α2 binding may change the DNA dramatically to a conformation rendering it hypersensitive to MNase.
In summary, we have developed a high resolution method to footprint MNase-sensitive sites and map nucleosome positions. This technique was used to determine the positions of four nucleosomes in the MFA2 gene in haploid α cells of S.cerevisiae. These nucleosomes lost their nucleosomal footprint in a cells, in which the gene is active. We also mapped a hypersensivive site for MNase in the α2 operator region of MFA2 in α cells. Finally, it should be emphasized that adaptation of our technique to detect CPDs at nucleotide resolution (13) provides an elegant approach for examining binding of regulatory proteins to chromatin and positioning of nucleosomes using MNase footprints. By combining this with our original method to detect CPDs one can examine the induction and repair of UV-induced CPDs in relation to chromatin structure using a common approach.
Acknowledgments
ACKNOWLEDGEMENTS
We thank R. S. Conlan for critical reading of the manuscript and discussions. This work was supported by MRC grant G9900118.
References
- 1.Herskowitz I. (1989) A regulatory hierarchy for cell specialization in yeast. Nature, 342, 749–757. [DOI] [PubMed] [Google Scholar]
- 2.Jarvis E.E., Clark,K.L. and Sprague,G.F. (1989) The yeast transcription activator PRTF, a homolog of the mammalian serum response factor, is encoded by the Mcm1 gene. Genes Dev., 3, 936–945. [DOI] [PubMed] [Google Scholar]
- 3.Keleher C.A., Passmore,S. and Johnson,A.D. (1989) Yeast repressor alpha 2 binds to its operator cooperatively with yeast protein Mcm1. Mol. Cell. Biol., 9, 5228–5230. [DOI] [PMC free article] [PubMed] [Google Scholar]
- 4.Hwangshum J.J., Hagen,D.C., Jarvis,E.E., Westby,C.A. and Sprague,G.F. (1991) Relative contributions of Mcm1 and Ste12 to transcriptional activation of a-specific and alpha-specific genes from Saccharomyces cerevisiae. Mol. Gen. Genet., 227, 197–204. [DOI] [PubMed] [Google Scholar]
- 5.Mead J., Zhong,H.L., Acton,T.B. and Vershon,A.K. (1996) The yeast alpha 2 and Mcm1 proteins interact through a region similar to a motif found in homeodomain proteins of higher eukaryotes. Mol. Cell. Biol., 16, 2135–2143. [DOI] [PMC free article] [PubMed] [Google Scholar]
- 6.Wilson K.L. and Herskowitz,I. (1986) Sequences upstream of the STE6 gene required for its expression and regulation by the mating type locus in Saccharomyces cerevisiae. Proc. Natl Acad. Sci. USA, 83, 2536–2540. [DOI] [PMC free article] [PubMed] [Google Scholar]
- 7.Keleher C.A., Redd,M.J., Schultz,J., Carlson,M. and Johnson,A.D. (1992) Sn6-Tup1 is a general repressor of transcription in yeast. Cell, 68, 709–719. [DOI] [PubMed] [Google Scholar]
- 8.Roth S.Y., Dean,A. and Simpson,R.T. (1990) Yeast alpha-2 repressor positions nucleosomes in TRP1 ARS1 chromatin. Mol. Cell. Biol., 10, 2247–2260. [DOI] [PMC free article] [PubMed] [Google Scholar]
- 9.Shimizu M., Roth,S.Y., Szentgyorgyi,C. and Simpson,R.T. (1991) Nucleosomes are positioned with base pair precision adjacent to the alpha-2 operator in Saccharomyces cerevisiae. EMBO J., 10, 3033–3041. [DOI] [PMC free article] [PubMed] [Google Scholar]
- 10.Ducker C.E. and Simpson,R.T. (2000) The organized chromatin domain of the repressed yeast a cell-specific gene STE6 contains two molecules of the corepressor Tup1p per nucleosome. EMBO J., 19, 400–409. [DOI] [PMC free article] [PubMed] [Google Scholar]
- 11.Cooper J.P., Roth,S.Y. and Simpson,R.T. (1994) The global transcriptional regulators, Ssn6 and Tup1, play distinct roles in the establishment of a repressive chromatin structure. Genes Dev., 8, 1400–1410. [DOI] [PubMed] [Google Scholar]
- 12.Michaelis S. and Herskowitz,I. (1988) The a-factor pheromone of Saccharomyces cerevisiae is essential for mating. Mol. Cell. Biol., 8, 1309–1318. [DOI] [PMC free article] [PubMed] [Google Scholar]
- 13.Teng Y.M., Li,S.S., Waters,R. and Reed,S.H. (1997) Excision repair at the level of the nucleotide in the Saccharomyces cerevisiae MFA2 gene: mapping of where enhanced repair in the transcribed strand begins or ends and identification of only a partial Rad16 requisite for repairing upstream control sequences. J. Mol. Biol., 267, 324–337. [DOI] [PubMed] [Google Scholar]
- 14.Teng Y., Longhese,M., McDonough,G. and Waters,R. (1998) Mutants with changes in different domains of yeast replication protein a exhibit differences in repairing the control region, the transcribed strand and the non-transcribed strand of the Saccharomyces cerevisiae MFA2 gene. J. Mol. Biol., 280, 355–363. [DOI] [PubMed] [Google Scholar]
- 15.Meniel V. and Waters,R. (1999) Spontaneous and photosensitiser-induced DNA single-strand breaks and formamidopyrimidine-DNA glycosylase sensitive sites at nucleotide resolution in the nuclear and mitochondrial DNA of Saccharomyces cerevisiae. Nucleic Acids Res., 27, 822–830. [DOI] [PMC free article] [PubMed] [Google Scholar]
- 16.Teng Y. and Waters,R. (2000) Excision repair at the level of the nucleotide in the upstream control region, the coding sequence and in the region where transcription terminates of the Saccharomyces cerevisiae MFA2 gene and the role of RAD26. Nucleic Acids Res., 28, 1114–1119. [DOI] [PMC free article] [PubMed] [Google Scholar]
- 17.Thoma F. (1996) Mapping of nucleosome positions. Methods Enzymol., 274, 197–214. [DOI] [PubMed] [Google Scholar]
- 18.Workman J.L. and Kingston,R.E. (1998) Alteration of nucleosome structure as a mechanism of transcriptional regulation. Annu. Rev. Biochem., 67, 545–579. [DOI] [PubMed] [Google Scholar]