Abstract
Diabetes causes a variety of end-stage organ complications, including diabetic nephropathy. Metabolomics offers an approach for characterizing biofluid metabolic changes, but studies focusing on diabetic nephropathy are limited due to the loss of tissue-specific metabolic information. A microdialysis application for the sampling of intact endogenous metabolites has been developed, utilizing two probes simultaneously inserted into the kidney tissues and jugular vein of rats with type 2 diabetes. The comprehensive and quantitative analysis of 20 diagnostic biomarkers closely realated to type 2 diabetes and its complications were performed. Results indicated that amino acid and nucleotide levels were lower in diabetic rats, revealing that the metabolic pathways of amino acid, as well as purine and pyrimidine, were disturbed. Targeted metabolomics using mass spectrometry was performed to find potential therapeutic biomarkers and related metabolic pathways of Gardenia jasminoides (G. jasminoides) for treating diabetes. Results suggested that seven biomarkers in the kidney and five biomarkers in the blood were related to G. jasminoides. In addition, the marked perturbations of pathways were regulated after treatment with G. jasminoides, including amino acid metabolism and purine metabolism. These biomarkers and metabolic pathways provided new understanding for molecular mechanisms of G. jasminoides for treating diabetes and its complications.
Introduction
Metabolomics strategies can be divided into untargeted and targeted approaches. The emergence of targeted metabolome profiling is an important development in metabolomics. Targeted metabolomics is the measurement of defined groups of metabolites. All or most of the detectable compounds in a given sample were identified and quantified by comparing the sample spectra to a library of reference spectra of pure compounds1–3.
For metabolomics strategy, common sample preparation like extraction, concentration with evaporation or freeze-drying, and derivatization steps are essential4, but these steps may potentially cause bias and contamination of samples, which may lead to misinterpretation of the final results5–7. Therefore, in vivo analytical method of biological tissues is one of the ultimate goals for metabolomics to obtain solid information on metabolome alteration. Microdialysis (MD) is a well-established in vivo analytical sampling method used over the years for monitoring low-molecular-weight hydrophilic compounds from the interstitial space8. MD samples are much cleaner and do not require additional preparation steps that might increase method errors9. Furthermore, MD can be used to monitor the metabolic profiles of specific tissues without the need to take tissue biopsies, namely, tissue-targeted metabolomics9. Tissue-targeted metabolomics is usually applied for investigating the alterations of metabolic profiles in specific tissues and the effects of which could be lost in the complex metabolic signatures of biofluid, including urine or plasma.
Diabetes mellitus, which is one of the most common endocrine metabolic disorders, can cause microvascular and macrovascular complications. Among type 2 diabetes (T2D) patients, approximately 30% of them evolved a diabetic nephropathy (DN), an end-stage renal disease. DN has been didactically categorized into stages based on the values of urinary albumin excretion rate (UAER): microalbuminuria and macroalbuminuria. The cutoff values adopted by the American Diabetes Association10 (timed, 24-h, and spot urine collection) for the diagnosis of microalbuminuria and macroalbuminuria are 30–299 mg/24 h and ≥300 mg/24 h respectively. The basis for the prevention of DN is the treatment of its known risk factors: hypertension, hyperglycemia, smoking, and dyslipidemia11. Progress in the development of treatments for DN has been impeded by an incomplete understanding of disease pathogenesis. Aldose reductase (ALR2) has been widely investigated as an enzyme crucially involved in the pathogenesis of chronic complications associated with diabetes. Our previous study12 found some components in G. jasminoides have high affinity interactions with ALR2 and they were potential aldose reductase inhibitor (ARI). Epalrestat is a noncompetitive and reversible ARI. It reduces the accumulation of intracellular sorbitol which is believed to be the cause of diabetic neuropathy, retinopathy and nephropathy13. Epalrestat is the only ARI commercially available. Hence epalrestat was selected as positive control.
Recently, an increasing number of metabolomics studies have been conducted to characterize T2D and its complications14–19. Previous studies suggested that metabolic alterations occurred in T2D and its complications. Moreover, a series of metabolites like some amino acids15, 16, such as purine, pyrimidine19, and sorbital20, were identified as diagnostic biomarkers of T2D. Thus, these pivotal metabolites were selected as targeted metabolites in our research. In the present study, we used dual-probe microdialysis combined with liquid chromatography (LC) coupled to a triple quadrupole tandem mass spectrometer to directly detect these important potential biomarkers in the blood and kidney tissue of T2D rats. G. jasminoides as traditional Chinese medicines (TCMs) has been used for the treatment of diabetes in clinic. G. jasminoides has been reported to improve T2D in rats21. However, its therapeutic mechanism is still not very clear. Metabolomics is a powerful approach to explore the multi-target therapeutic mechanism underlying the influence of TCMs. The aim of targeted metabolomics analysis is to determine tissue-specific metabolic profiles and metabolic alterations in response to G. jasminoides treatment. In this research, we performed simultaneously qualitative and quantitative analyses of multiple metabolites in the blood and kidney tissues and investigated the mechanism of G. jasminoides for treating diabetes and its complications.
Results
Method validation
A sensitive LC-MS/MS coupled with dual MD method was validated to be able to simultaneously quantify 20 endogenous compound concentrations from the in vivo dialysate. The dynamic range, correlation coefficients, limits of detection (LODs) and limits of quantification (LOQs), and matrix effects for 20 analytes in the analyzed concentration range are shown in Supplementary Table S2. Correlation coefficients, R2, were ranged from 0.9920 to 0.9996, revealing good correlations between concentrations and peak areas. The sensitivity of the method was evaluated by determining the LODs and LOQs of the analytes. As listed in Supplementary Table S2, the limit of quantification of this method was from 0.1 ng·mL−1 to 10 μg·mL−1, which means that the sensitivity is enough for these analytes to be detected in dialysate samples. The LOD range of this method was from 0.075 ng·mL−1 to 1.0 ng·mL−1. Most analytes exhibited good repeatability with inter-day and intra-day relative standard deviations (RSDs) lower than 10%, except for a few analytes, which showed an acceptable repeatability with RSDs between 10% and 12%. Moreover, the accuracy were 100% ± 13%, which revealed that the method was valid for in vivo dialysate sample analysis. The matrix effects of all analytes ranged from 88.12% to 108.97%, which demonstrated that there was no significant matrix interference in this method (see Supplementary Table S3).
Taken all together, these results illustrate the excellent linearity, precision, and accuracy of this method, as well as the general ability of LC-MRM-MS system to serve in the analysis and quantification of small molecules.
Biochemical analyses
Supplementary Table S6 shows the biochemical parameters related to renal functions. Levels of renal function markers, urea nitrogen (BUN), serum creatinine (Scr) and urinary albumin excretion rate (UAER) presented significant higher levels (p < 0.01) in DM group compared with control group. Value of UAER in DM group suggests that marked DN has been developed on diabetic rats (microalbuminuria stage).
Endogenous metabolite changes in blood and kidney tissues
Sorbitol, inosine, adenosine, thymidine, cytidine, and cytosine could not be detected or quantified in blood dialysates but could be quantified in kidney tissue dialysates due to the differences in recovery. As a whole, most metabolite concentration levels in kidney tissue dialysates are higher than in blood dialysates.
In Fig. 1, we can see that the levels of inosine, adenosine, thymidine, cytidine, and cytosine in the group of DM are significantly higher (p < 0.01) compared with control group. For the G-DM group, significant lower levels of thymidine and cytosine (p < 0.01) compared with DM group indicated the possible mechanism of G. jasminoides for treating T2D with DN.
Figure 1.
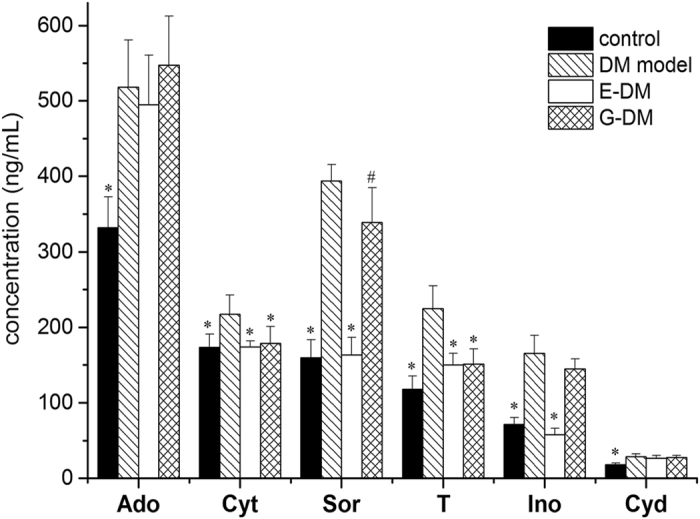
Levels of six analytes only in kidney dialysates among four groups (n = 8 per group). Data presented as mean ± SD. Student’s t test, # p < 0.05, *p < 0.01 vs. DM model group.
For sorbitol, the concentrations were found to be significantly higher (p < 0.01) in DM group than in the control group. Compared with DM group, the level of sorbitol in kidney tissue dialysates was significantly lower (p < 0.05) in G-DM treatment group.
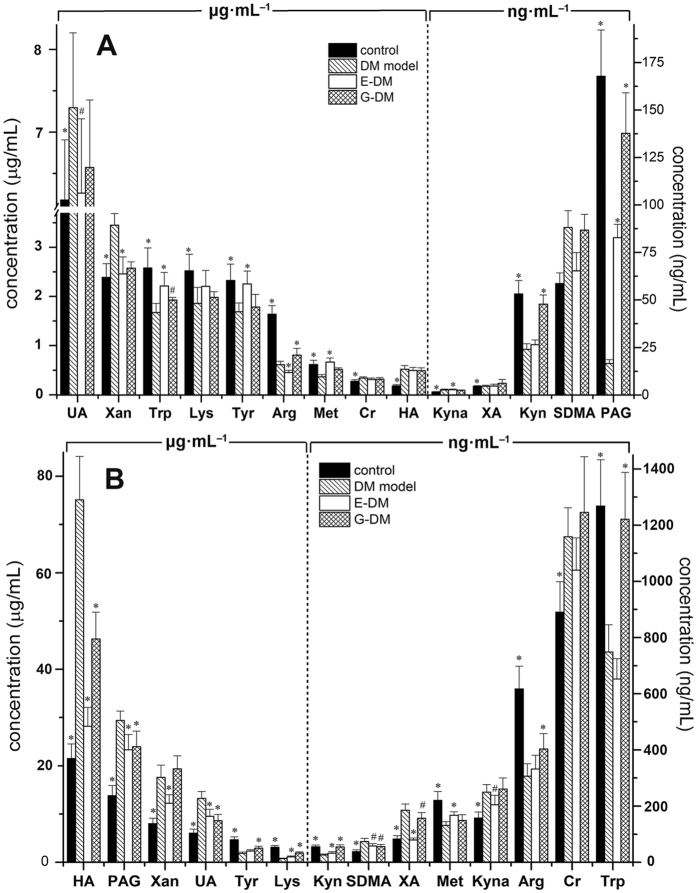
The other 14 analytes could be simultaneously quantified in blood and kidney tissue dialysates from rats (see Fig. 2). Compared with the control group, higher level was observed in six analytes, including xanthine, uric acid, SDMA, creatinine, and hippuric acid in the dialysates of blood for diabetic rats. Xanthurenate was significantly higher (p < 0.01) in diabetic rats of kidney tissues. However, amino acids and their metabolites, including arginine, tryptophan, kynurenine, kynurenate, phenylacetylglycine, tyrosine, methionine, and lysine levels, were significantly lower (p < 0.01) in diabetic rats. In the dialysates of kidney tissues, the ratios of kynurenine to tryptophan in control and DM group were 22.78 and 28.18 respectively, suggesting no significant increase was observed in DM group. However, in the dialysates of blood, the ratios of kynurenine to tryptophan in control and DM group were 48.50 and 69.85 respectively. We noted that the level of phenylacetylglycine in the dialysates of kidney tissues was significantly higher (p < 0.01) compared with that in the control group, which had the opposite trend to blood dialysates. All the other analytes in blood and kidney tissues showed similar change trends. Reduction in glomerular filtration rate was reported in diabetic rat22, which probably contributes to this phenomenon.
Figure 2.
Levels of 14 analytes in blood (A) and kidney (B) dialysates among four groups (n = 8 per group), respectively. Data presented as mean ± SD. Student’s t test, # p < 0.05, *p < 0.01 vs. DM model group.
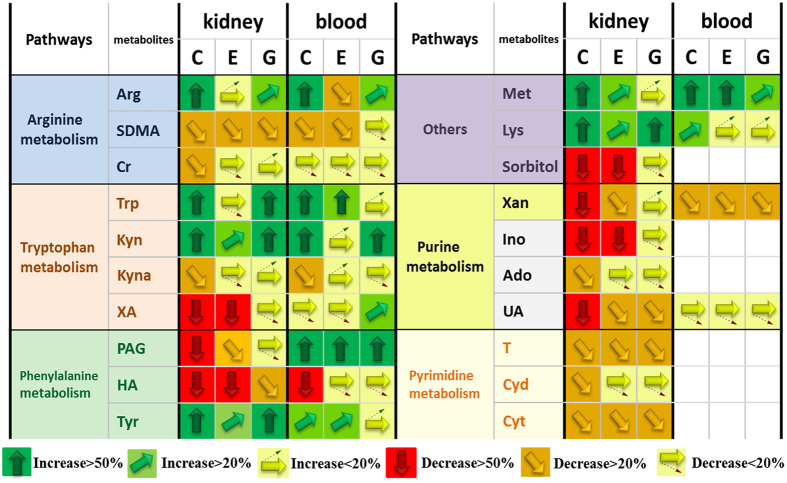
Compared with the DM group, G. jasminoides showed a significant treatment effect (p < 0.05) in regulating the levels of kynurenate, arginine, tryptophan, and phenylacetylglycine in blood dialysates. By comparison, G. jasminoides showed a significant effect (p < 0.05) in regulating much more endogenous metabolites in kidney tissue dialysates, including hippuric acid, phenylacetylglycine, uric acid, SDMA, xanthurenate, arginine, tryptophan, kynurenine, kynurenate, phenylacetylglycine, tyrosine, and lysine. As shown in Fig. 3, G. jasminoides plays a more important effect in regulating the levels of arginine and tryptophan than epalrestat as a control. Both arginine and tryptophan are pivotal metabolites in amino acid metabolism that associate with T2D23. Interestingly, from the quantitative analysis results, we found that G. jasminoides exhibited a better therapeutic effect in targeted kidney tissues than blood. Plasma or urine represents the average metabolic status of the organism and cannot give tissue-specific metabolic profiles. MD sampling can offer more tissue-specific metabolic information in kidney tissues, particularly for the research on DN.
Figure 3.
Vector diagram showing the response of the 20 analytes according to their level change. Analytes with vectors are absolutely quantified. Analytes are presented with names, their metabolic pathways (http://www.kegg.com), and their response to intervention for epalrestat (E) and G. jasminoides (G) in diabetic rats. C presents control group. The analyte amount in the C, E, and G groups is compared with those in the DM group. An arrow pointing straight up (green) means that the particular analyte has increased >50% vs. DM group. An arrow pointing straight down (red) means that the particular analyte has decreased >50% vs. DM group. White boxes mean that metabolite was not detected or quantified in the samples.
Global metabolome profiling of DM, E-DM, G-DM, and control groups
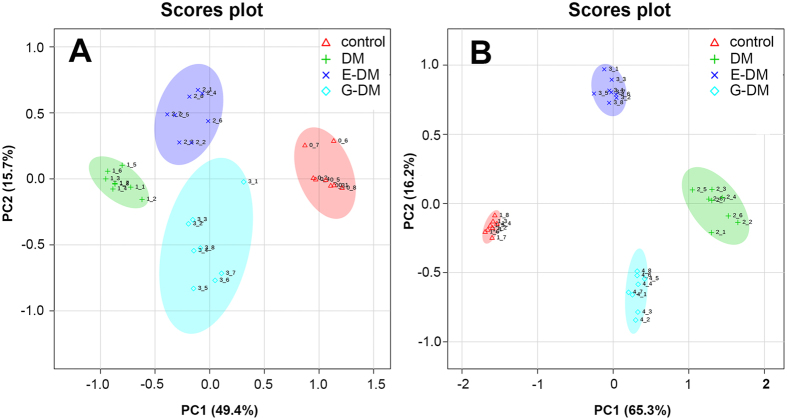
To investigate global metabolomic alterations, the concentration data sets obtained from blood and kidney dialysate samples were integrated and analyzed using principal component analysis (PCA). The variance explained by each principal component (PC) is displayed on the X and Y axis (score plot two-dimensional). In Fig. 4(A), PC1 accounts for 49.4% of the variance, PC2 accounts for 15.7% of the variance. In Fig. 4(B), PC1 accounts for 65.3% of the variance, PC2 accounts for 16.2% of the variance. As shown in Fig. 4, a clear separation is observed among the four groups in both blood and kidney dialysates, suggesting that metabolic perturbations were evident in the rats, dependent on pathological condition and treatment intervention.
Figure 4.
PCA score plots of the control, DM, E-DM, and G-DM groups in blood (A) and kidney (B) dialysates of the first two principal components. The plot displays PC1 on the x axis and PC2 on the y axis.
Discovery of potential therapeutic biomarkers
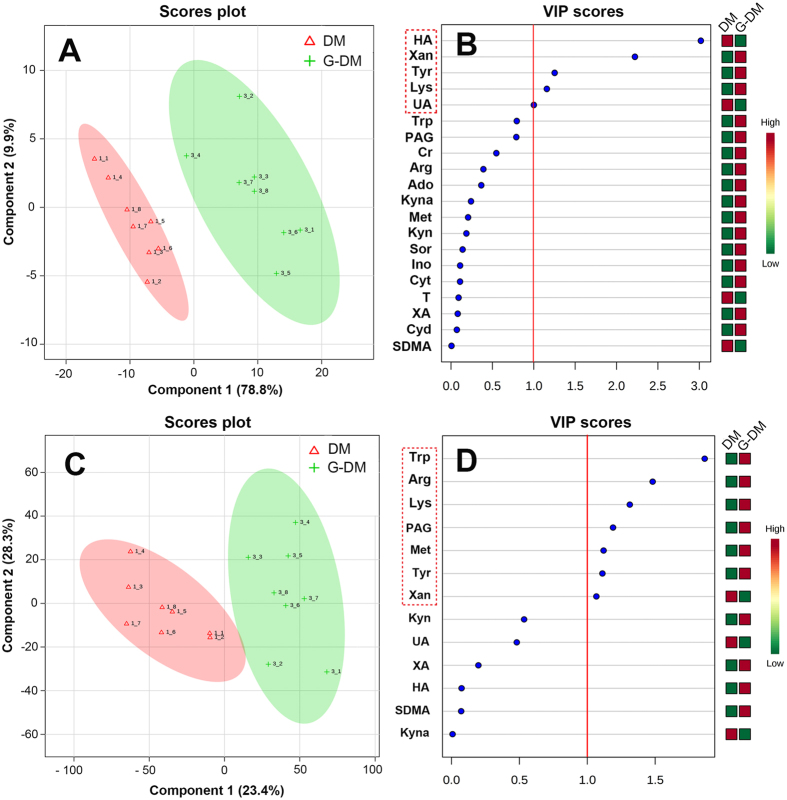
To monitor the treatment effects of G. jasminoides and discover potential therapeutic biomarkers, a partial least-square-discrimination analysis (PLS-DA) model was constructed using the data from blood and kidney dialysates. The score scatter plots for PLS-DA models from both kidney and blood dialysates showed clear differentiation of G-DM and DM groups (Fig. 5A and C). R 2 for the model and Q 2 for the prediction were 0.859 and 0.576 in blood and 0.997 and 0.948 in kidney tissues, respectively. The R 2 and Q 2 illustrated that the PLS-DA models were reliable. The variable importance in the projection (VIP) values were also applied to screen potential biomarkers. Using the VIP cut-off value (>1), the numbers of metabolites discriminating against the G-DM from the DM group were determined (Fig. 5B and D). In total, seven biomarkers in the kidney and five biomarkers in the blood were identified (Fig. 6).
Figure 5.
PLS-DA score plots showing a significant separation between G-DM and DM groups in the kidney (A) and blood (C); VIP scores representing the most contributing metabolites involved in the separation between G-DM and DM groups in the kidney (B) and blood (D).
Figure 6.
Potential therapeutic biomarkers in blood and kidney by dual-probe microdialysis sampling.
To verify these biomarkers, PLS-DA model was performed using the data of E-DM and DM groups from blood and kidney dialysates, respectively. The score scatter plots for PLS-DA models from both kidney and blood dialysates showed clear differentiation of G-DM and DM groups (Supplementary Fig. S2A and C). R 2 for the model and Q 2 for the prediction were 0.954 and 0.835 in the blood and 0.996 and 0.974 in the kidney tissues, respectively. Similarly, six biomarkers in the kidney and four biomarkers in the blood were identified (Supplementary Fig. S2B and D). Compared with G-DM vs. DM model, E-DM vs. DM model has less biomarkers, and PAG is the unique biomarker for epalrestat treatment in the kidney. Other biomarkers are shared with G-DM vs. DM model, which probably imply similar therapeutic effects between G. jasminoides and epalrestat.
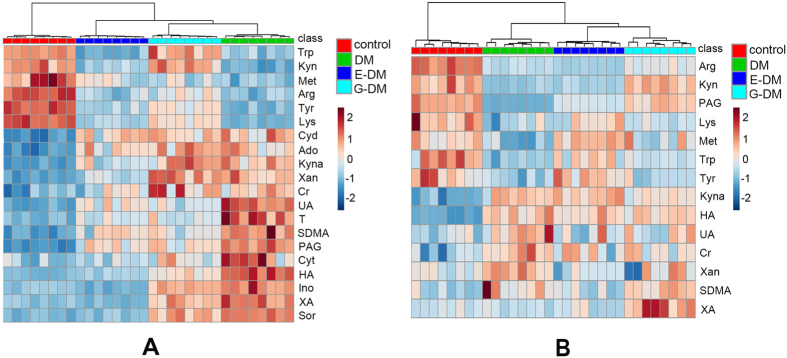
Hierarchical clustering is technique in pattern recognition. Agglomerative hierarchical clustering begins with each sample as separate cluster and then proceeds to combine them until all the samples belong to one cluster. Results are presented as heat maps (Fig. 7). Overall, the model types do group together based upon the metabolite expression patterns of the blood and kidney dialysate samples, which can be seen in the clustering on the top of Fig. 7. Furthermore, metabolite patterns separated the four model types (control, DM, E-DM, and G-DM groups, marked with different colors) in blood dialysates as well as in kidney dialysates.
Figure 7.
Heat maps of normalized metabolite concentrations in (A) kidney and (B) blood dialysates. Columns represent the samples (control, DM, E-DM, and G-DM groups), and rows represent the metabolites. The data were already normalized by using mean-centered.
Metabolic pathway analysis
Metabolic pathway analysis (MetPA) (http://metpa.metabolomics.ca) is a web-based metabolomics tool used to identify relevant pathways that are most likely to be associated with the condition under study. The impact factor of pathways analysis with MetPA was applied to evaluate the importance of the pathways on the development of diabetes in this study. Supplementary Table S4 shows eight disturbed metabolic pathways as the most relevant pathways involved in T2D. Obviously, five disturbed metabolic pathways among them were regulated by treatment with G. jasminoides. Results suggested that the therapeutic mechanism of G. jasminoides involved amino acid and purine metabolism.
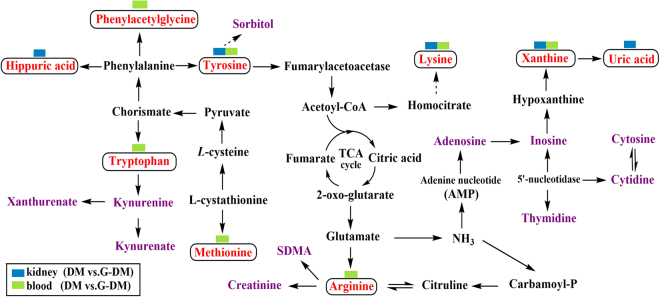
In addition, the correlation networks of the main potential biomarkers of diabetes and the therapeutic effects of G. jasminoides on diabetic rats are intuitively described in Fig. 8. On top of the potential biomarkers, one rectangular strip is composed of different colors to represent the different groups, as illustrated in the legend.
Figure 8.
Correlation networks of main potential biomarkers in response to the therapeutic effects of G. jasminoides on diabetic rats. The potential biomarkers (VIP > 1) are marked as red; one rectangular strip above the potential biomarker contains two colors corresponding to blood and kidney.
Discussion
Tryptophan metabolism
In our study, a significant lower level of tryptophan (p < 0.01) was found in diabetic rats. For xanthurenate and kynurenate, concentrations were shown to be significantly higher (p < 0.01) in the blood and kidney tissues of diabetic rats than the normal rats. Tryptophan is an essential amino acid that can be metabolized through methoxyindole and kynurenine pathways. The majority (about 95%) of tryptophan is metabolized by the kynurenine pathway (KP)24, leading to the production of various metabolites, including kynurenate and xanthurenate. The key enzymes of tryptophan to kynurenine conversion are tryptophan 2,3-dioxygenase (TDO) and indoleamine 2,3-dioxygenase (IDO), which are activated by stress hormones or inflammatory factors. Previous study suggested the diabetogenic effects of KP metabolites, such as xanthurenate-induced hyperglycemia25; the increased urine excretion of xanthurenate in rat model of diabetes26; and the biological activity of insulin by kynurenine, xanthurenate, kynurenate, and their derivatives27. Thus, overproduction of diabetogenic kynurenine, xanthurenate, and kynurenate was one of the mechanisms of chronic stress- or chronic low-grade inflammation-induced development of T2D28. The increased urine excretion of xanthurenate was reported in 3 pre-diabetic29 and 20 T2D patients26 which were consistent with our findings. Kynurenine/tryptophan ratio is frequently used as an indicator of IDO activity30. In the blood, kynurenine/tryptophan ratio increased in DM models compared with normal rats. The results show that TDO is probably activated by stress hormones or inflammatory factors in diabetic rats. However, no increase in kynurenine/tryptophan ratio in DM models was observed in kidney tissues, suggesting that other mechanisms might be involved.
Arginine metabolism
Increased SDMA and creatinine along with decreased levels of arginine were observed in diabetic rats in our study. Nitric oxide (NO) is generated from arginine by the enzyme synthase (NOS). Previous study showed that the physiological levels of NO played an important role in regulating the oxidation of metabolic intermediates, insulin sensitivity, and hemodynamics in animals and humans31. During arginine depletion, NOS generated reactive oxygen species (ROS) in lieu of NO and can thus increase oxidative stress32. Oxidative stress is widely accepted as being associated with T2D. SDMA and its stereoisomer asymmetric dimethylarginine (ADMA) are produced during the post-translational methylation of arginine residues by protein arginine methyl transferases (PRMTs) in proteins33. SDMA was fully eliminated through the kidney and strongly related to renal function34, including creatinine clearance35. Further study indicated that the plasma levels of SDMA were significantly higher (p < 0.01) in patients with type 1 diabetes (T1D) based on the controls35. The results are in agreement with our findings.
Lysine metabolism
The observed reduction of lysine in diabetic rats was related to the mechanisms below. Research in humans and rodents has indicated that lysine potentiate glucose stimulated insulin secretion. Lysine ingestion resulted in a small decrease in serum glucose and an increase in glucagon and insulin concentrations36, 37. In addition, the reversible acetylation of lysine in an organ led to the long-term complications of diabetes, including DN38.
Phenylalanine metabolism
In our study, the levels of tyrosine are lower and the levels of hippuric acid are higher in diabetic rats. Phenylalanine and tyrosine are aromatic amino acids (AAAs). Studies corroborated results that linked increases in the AAAs with obesity and T2D39, 40. Tyrosine is a semi-essential amino acid that is only synthesized by the hydroxylation of phenylalanine by the enzyme phenylalanine hydroxylase. Chronic renal impairment was associated with decreased plasma concentrations of tyrosine41. Similarly, in our study, tyrosine depletion in diabetic rats was associated with an increased risk of having renal impairment. Hippuric acid is produced in the gut by microorganisms using glycine and benzoic acid as building blocks42. Phenylacetate was transformed from phenylalanine through the action of gut microbiota; phenylacetate was combined with glycine to form phenylacetylglycine43. The notion that intestinal microbiota as a key player in the onset and development of diabetes is becoming more widely accepted. Higher levels of some bacterial metabolites have been detected in urine samples of diabetic rats44. Furthermore, an important role of the gut in the pathogenesis of T1D has been suggested, due not only to the intestinal microbiota but also to altered intestinal permeability and immunity44, 45.
Purines and pyrimidines metabolism
The significant higher levels of uric acid and xanthine (p < 0.01) were observed in diabetic rats. Purines and pyrimidines are the basic constituents of DNA and RNA. Purine and pyrimidine metabolism is associated with the development of diabetes and DN19. During purine metabolism, hypoxanthine is accumulated and is further metabolized to xanthine and uric acid by xanthine dehydrogenase or xanthine oxidase, along with the generation of ROS. High serum uric acid (SUA) is associated with the increased risk of the development of chronic kidney disease in T2D46. In addition to chronic kidney disease, some studies reported that the elevated levels of SUA were associated with hypertension, coronary heart disease, and stroke47, 48.
Polyol pathway
The levels were found to be significantly higher (p < 0.01) in diabetic rats in our study. Sorbitol occurs naturally and is also produced synthetically from glucose. Excessive sorbitol seriously blocks the cell membrane pervasion and ultimately leads to chronic complications of diabetes.
In summary, we applied dual-probe microdialysis combined with liquid chromatography coupled to a triple quadrupole tandem mass spectrometer, which enables the qualitative and quantitative analysis of endogenous metabolites, simultaneously to measure their levels in the kidney tissues and blood obtained from T2D rats. Results indicated that the change trends of metabolites in the blood and kidney tissues were highly synchronized. As we known, blood passes through the glomeruli and forms the original urine and renal tubule reabsorbs and continues to separate substances from the original urine in kidney, thus making the constituents in the kidney tissues parallel to the blood. Amino acid levels were lower, but the nucleotide metabolite levels were higher in diabetic rats compared with those in the normal rats. Targeted metabolomics analysis showed the global metabolic alterations of diabetic rats before and after G. jasminoides treatment. Furthermore, potential therapeutic biomarkers were discovered, which were related to multiple biochemical processes, such as phenylalanine, tyrosine, and tryptophan biosynthesis, tryptophan metabolism, tyrosine metabolism, arginine and proline metabolism, and purine metabolism. Among them, the metabolic perturbations of phenylalanine, tyrosine, and tryptophan biosynthesis; tryptophan metabolism; and purine metabolism were regulated after G. jasminoides treatment in kidney tissues. Results provided a unique perspective on localized metabolic information of T2D and its complications, which gave us new insights into the pathogenesis of diabetes as well as the discovery of targets for clinical diagnosis and treatment.
Methods
Reagents and chemicals
Sorbitol (Sor); xanthine (Xan); inosine (Ino); adenosine (Ado); uric acid (UA); thymidine (T); cytidine (Cyd); cytosine (Cyt); arginine (Arg); symmetric dimethylarginine (SDMA); creatinine (Cr); tryptophan (Try); kynurenine (Kyn); kynurenate (Kyna); xanthurenate (XA); phenylacetylglycine (PAG); hippuric acid (HA); tyrosine (Tyr); methionine (Met); lysine(Lys); N, N-dimethylphenylalanine (N, N-Phe); and streptozotocin (STZ) were purchased from Sigma-Aldrich (USA). HPLC-grade methanol, formic acid, and acetic acid were purchased from Fisher Scientific (USA). Water was obtained from Millipore Milli-Q Ultra-pure water purification system (Belgium). Ringer’s solution (145 mM Na+, 1.2 mM Ca2+, 4 mM K+, and 0.1 mM ascorbic acid pH 7.0) and anticoagulant citrate dextrose (ACD) solution (3.5 mM citric acid, 7.5 mM sodium citrate, and 13.6 mM dextrose) were prepared as perfusate for microdialysis. Epalrestat was obtained from the Yangtze River Pharmaceutical Group (Taizhou, China). The extract of G. jasminoides had been prepared and identified in our previous study49.
Animal experiment
Male Sprague–Dawley rats (180–200 g) were obtained from the Experimental Animal Center of Jilin University (Jilin, China). The rats were bred in a 12 h light and 12 h dark cycle with regulated temperature (23 ° ± 2 °C) and humidity (40%–80%). Animal welfare and experimental procedures were approved by the Animal Research Ethics Committee of Jilin University and all methods were performed in accordance with the relevant guidelines and regulations. After one-week adaptation, the rats were randomly divided into four groups: control group, diabetes model (DM) group, E-DM group, and G-DM group. The control group received a standard diet. The other groups were fed with high-fat and high-sucrose chow (18% lard, 3% cholesterol, 20% sucrose, and 59% standard rat chow) as DM group. After 10 weeks of feeding, diabetic rats were given STZ (35 mg/kg BW in citrate buffer)50. Rats presenting blood glucose levels lower than 16.7 mmol·L−1 were excluded from the diabetic rat group. After the confirmation of diabetes, the E-DM group (positive control) and G-DM group received an orally administered epalrestat (0.35 mg/kg BW) and G. jasminoides (4.4 g/kg BW) via a gastric tube once a day for another 12 weeks. The control group and DM group were administered with distilled water 2 mL for 12 weeks.
Dual-probe MD of blood and kidney tissues
Blood and kidney microdialysis systems consisted of a microdialysis syringe pump (CMA/402, CMA, Stockholm, Sweden), microdialysis probes, and a stereotaxic frame. The dialysis probes (Microbiotech AB, Stockholm, Sweden) for the blood (molecular weight cut-off of 20 kDa) and kidney (molecular weight cut-off of 6 kDa) were 10 mm in length.
On the day of microdialysis, the probes were perfused with Ringer’s solution at a constant flow rate (1 μL·min−1) by using a micro-infusion pump. The animals were initially anesthetized with sodium pentobarbital (40 mg/kg) and immobilized in a supine position. The blood microdialysis probe was inserted into the jugular vein to the right atrium. The animals were placed in the lateral decubitus position prior to the surgical removal of the skin and muscle. The linear microdialysis probe was inserted through the kidney medulla with the aid of a needle, which was removed after insertion. Then, two probes were perfused with ACD solution and Ringer’s solution at a flow rate of 1 μL·min−1, respectively. After the stabilization period, the dialysates from the blood and kidney tissues were collected at 30 min intervals for 3 h into the fraction collector (MAB 85). The dialysates were preserved at −80 °C before analysis.
LC-MS/MS conditions
LC–MS/MS analysis was performed with a Waters ACQUITY UPLC system (Waters Corp., Milford, MA, USA) connected to a Xevo TQ MS spectrometer with an electrospray ion source (ESI) (Waters, Manchester, UK). Chromatographic separation was carried out on a Waters UPLC BEH Shield RP18 column (100 mm × 2.1 mm, 1.7 μm) using gradient elution. The mobile phase was composed of acetonitrile (A) and water containing 0.1% (v/v) formic acid (B). The injected volume was 5 μL, and a flow rate of 200 μL·min−1 was applied during the gradient elution. The elution program was as follows: 0–3 min, 1% A (isocratic); 3–9.5 min, 1%–40% A (linear increase); 9.5–12.5 min, 40%–80% A (linear increase); 12.5–13 min, 80%–100% A (linear increase); 13–16 min, 100% A (isocratic); 16–18 min, 100%–10% B (linear decrease); and 18–19 min, 10%–1% A (linear decrease). Data were acquired in positive ion mode. The source parameters for the MS were set as follows: a capillary voltage of 3.0 kV; source temperature, 150 °C; desolvation temperature, 350 °C; desolvation gas flow, 800 L·h−1; and cone gas flow, 50 L·h−1. Nitrogen was used as the cone and desolvation gas, and argon was used as the collision gas. Multiple reaction monitoring (MRM) transitions for 21 analytes, as well as their respective cone voltages and collision energies, are listed in Supplementary Table S5.
In vitro relative recovery
To measure in vitro recovery, blood and kidney probes were perfused at a flow rate of 1 μL·min−1 and placed in a stirred vial containing all standards in Ringer’s solution. The relative recovery (RR) was calculated as follows:
| 1 |
where C out is the ratio between the concentrations in the dialysate; C in is the concentration in the medium surrounding the probe51.
The average values of in vitro relative recovery of blood and kidney probes for 20 analytes are listed in Supplementary Table S1. The in vitro RR values could be affected by the temperature and perfusion rate. In addition, in vitro RR values are dependent on the nature of analytes and the tissue investigated, and these values were used to correct analyte concentrations determined in kidney and blood of rats.
Method validation and endogenous metabolite quantitation
Method validation has been shown in Supplementary Method validation.
MD technique enables the direct detection of endogenous compounds such as metabolites without sample preparation, particularly for tissue sampling. More importantly, MD is a well-established in vivo sampling method that may cause minimal perturbation to biological systems. In vivo dual-probe MD combined with LC-MS/MS, which enables the quantitative analysis of endogenous metabolites, was applied to simultaneously measure metabolite levels in the blood and kidney tissues of rats. Under optimized conditions, the MRM transitions in positive mode are shown in Supplementary Fig. S1. The above developed method was applied to analyze the blood and kidney tissue dialysates obtained from rats. The extracted ion chromatograms of dialysates in kidney tissues indicated that all analytes were identified and quantified in a single LC-MRM-MS run. The levels of endogenous metabolites were calculated based on their respective calibration curves (Supplementary Table S2) and relative recovery values (Supplementary Table S1). Then, their corresponding concentration levels in the blood and kidney tissues are shown in Fig. 1 and Fig. 2.
Biochemical analyses (shown in Supplementary Biochemical analyses online)
Data processing and statistical analysis
LC-MS/MS data were acquired using the MassLynx V4.1 software and processed for the calibration and quantification of the analytes using the Targetlynx V4.1 software. Statistical analysis was managed with SPSS 18.0 version software, and p < 0.05 was considered to be a significant difference for Student’s t test.
PLS-DA, PCA, and heat maps were generated by using MetaboAnalyst 3.0 (http://www.metaboanalyst.ca.)52. Data were mean-centered and divided by the square root of standard deviation of each variable.
Electronic supplementary material
Acknowledgements
The authors gratefully acknowledge the support by the National Natural Science Foundation of China (No. 81373952, 81473537, 81530094).
Author Contributions
F.R.S. designed and supervised the entire study. F.R.S. and Z.Q.L. planned the experiments. L.W. and Z.F.P. performed experiments. L.W., Z.F.P. and S.L. collected the MS data and performed the statistical analysis. L.W. wrote the manuscript. F.R.S., Z.Q.L. and S.L. revised the manuscript. F.R.S., L.W. and S.L. elucidated the implications of the results.
Competing Interests
The authors declare that they have no competing interests.
Footnotes
Electronic supplementary material
Supplementary information accompanies this paper at doi:10.1038/s41598-017-10172-w
Publisher's note: Springer Nature remains neutral with regard to jurisdictional claims in published maps and institutional affiliations.
References
- 1.Wishart DS. Quantitative metabolomics using NMR. Trac.-trend Anal. Chem. 2008;27:228–237. doi: 10.1016/j.trac.2007.12.001. [DOI] [Google Scholar]
- 2.Cajka T, et al. Toward Merging untargeted and targeted methods in mass spectrometry-based metabolomics and lipidomics. Anal. Chem. 2016;88:524–545. doi: 10.1021/acs.analchem.5b04491. [DOI] [PubMed] [Google Scholar]
- 3.Yang, C. et al. Comparative metabolomics of breast cancer. Pac. Symp. Biocomput. 181–192 (2007). [PubMed]
- 4.Shen, S. et al. Metabolomic analysis of mouse embryonic fibroblast cells in response to autophagy induced by acute starvation. Sci. Rep. 6 (2016). [DOI] [PMC free article] [PubMed]
- 5.Scalbert A, et al. Mass-spectrometry-based metabolomics: limitations and recommendations for future progress with particular focus on nutrition research. Metabolomics. 2009;5:435–458. doi: 10.1007/s11306-009-0168-0. [DOI] [PMC free article] [PubMed] [Google Scholar]
- 6.Hollywood K, et al. Metabolomics: Current technologies and future trends. Proteomics. 2006;6:4716–4723. doi: 10.1002/pmic.200600106. [DOI] [PubMed] [Google Scholar]
- 7.Soga T, et al. Quantitative metabolome analysis using capillary electrophoresis mass spectrometry. J. Proteome Res. 2003;2:488–494. doi: 10.1021/pr034020m. [DOI] [PubMed] [Google Scholar]
- 8.Cudjoe E, et al. Solid-Phase Microextraction: A complementary in vivo sampling method to microdialysis. Angew. Chem. 2013;52:12124–12126. doi: 10.1002/anie.201304538. [DOI] [PubMed] [Google Scholar]
- 9.Price KE, et al. Development of tissue-targeted metabonomics. Part 1. Analytical considerations. J. Pharm. Biomed. Anal. 2008;46:737–747. doi: 10.1016/j.jpba.2007.11.035. [DOI] [PMC free article] [PubMed] [Google Scholar]
- 10.American Diabetes Association: Nephropathyin diabetes (Position Statement). Diabetes Care27, S79-S83 (2004).
- 11.Gross JL, et al. Diabetic nephropathy: diagnosis, prevention, and treatment. Diabetes care. 2005;28:164–176. doi: 10.2337/diacare.28.1.164. [DOI] [PubMed] [Google Scholar]
- 12.Wang L, et al. Characterization of interaction property of multi-components in Gardenia jasminoides with aldose reductase by microdialysis combined with liquid chromatography coupled to mass spectrometry. Rapid Commun. Mass Spectrom. 2016;30:87–94. doi: 10.1002/rcm.7620. [DOI] [PubMed] [Google Scholar]
- 13.Ramirez MA, et al. Epalrestat: an aldose reductase inhibitor for the treatment of diabetic neuropathy. Pharmacotherapy. 2008;28 doi: 10.1592/phco.28.5.646. [DOI] [PubMed] [Google Scholar]
- 14.Lin, X. et al. Metabolic effects of basic fibroblast growth factor in streptozotocin-induced diabetic rats: A H-1 NMR-based metabolomics investigation. Sci. Rep. 6 (2016). [DOI] [PMC free article] [PubMed]
- 15.Pi Z, et al. Effect of acarbose on content of urinary endogenous metabolites of diabetic rats. J. Liq. Chromatogr. Rel. Technol. 2014;37:2478–2489. doi: 10.1080/10826076.2013.850719. [DOI] [Google Scholar]
- 16.Wang C, et al. Classification of type 2 diabetes rats based on urine amino acids metabolic profiling by liquid chromatography coupled with tandem mass spectrometry. J. Chromatogr. 2013;B935:26–31. doi: 10.1016/j.jchromb.2013.07.016. [DOI] [PubMed] [Google Scholar]
- 17.Lin S, et al. Beyond glucose: metabolic shifts in responses to the effects of the oral glucose tolerance test and the high-fructose diet in rats. Mol. Biosyst. 2011;7:1537–1548. doi: 10.1039/c0mb00246a. [DOI] [PubMed] [Google Scholar]
- 18.Wang, Q. et al. Application of online microdialysis coupled with liquid chromatography–tandem mass spectrometry method in assessing neuroprotective effect of Coptidis Rhizoma on diabetic rats. Anal. Methods (2014).
- 19.Xia J-F, et al. Ultraviolet and tandem mass spectrometry for simultaneous quantification of 21 pivotal metabolites in plasma from patients with diabetic nephropathy. J. Chromatogr. B. 2009;877:1930–1936. doi: 10.1016/j.jchromb.2009.05.047. [DOI] [PubMed] [Google Scholar]
- 20.Gallagher EJ, et al. Polyol accumulation in muscle and liver in a mouse model of type 2 diabetes. J. Diabetes Complications. 2016;30:999–1007. doi: 10.1016/j.jdiacomp.2016.04.019. [DOI] [PMC free article] [PubMed] [Google Scholar]
- 21.Zhang CY, et al. Genipin inhibits UCP2-mediated proton leak and acutely reverses obesity- and high glucose-induced beta cell dysfunction in isolated pancreatic islets. Cell Metab. 2006;3:417–427. doi: 10.1016/j.cmet.2006.04.010. [DOI] [PubMed] [Google Scholar]
- 22.Zhao HJ, et al. Endothelial nitric oxide synthase deficiency produces accelerated nephropathy in diabetic mice. J. Am. Soc. Nephrol. 2006;17:2664–2669. doi: 10.1681/ASN.2006070798. [DOI] [PMC free article] [PubMed] [Google Scholar]
- 23.Wijekoon EP, et al. Amino acid metabolism in the Zucker diabetic fatty rat: effects of insulin resistance and of type 2 diabetes. Can. J. Physiol. Pharmacol. 2004;82:506–514. doi: 10.1139/y04-067. [DOI] [PubMed] [Google Scholar]
- 24.Schwarcz R, et al. Kynurenines in the mammalian brain: when physiology meets pathology. Nat. Rev. Neurosci. 2012;13:465–477. doi: 10.1038/nrn3257. [DOI] [PMC free article] [PubMed] [Google Scholar]
- 25.Kotake Y. Xanthurenic acid, an abnormal metabolite of tryptophan and the diabetic symptoms caused in albino rats by its production. J. Vitaminol. (Kyoto) 1955;1:73–87. doi: 10.5925/jnsv1954.1.2_73. [DOI] [PubMed] [Google Scholar]
- 26.Ikeda S, et al. Urinary excretion of xanthurenic acid and zinc in diabetes: 1) Separation of xanthurenic acid-Zn2+ complex by ion-exchange chromatography. Acta Vitaminol. Enzymol. 1984;6:23–28. [PubMed] [Google Scholar]
- 27.Meyramov G, et al. Diabetogenic activity of xanturenic acid determined by its chelating properties. Transplant. Proc. 1998;30:3923–3923. doi: 10.1016/S0041-1345(98)00788-X. [DOI] [PubMed] [Google Scholar]
- 28.Oxenkrug G. Insulin resistance and dysregulation of tryptophan-kynurenine and kynurenine-nicotinamide adenine dinucleotide metabolic pathways. Mol. Neurobiol. 2013;48:294–301. doi: 10.1007/s12035-013-8497-4. [DOI] [PMC free article] [PubMed] [Google Scholar]
- 29.Manusadz. V, et al. Mass-spectrometric identification of xanthurenic acid in prediabetes. Vopr. Med. Khim. 1974;20:95–97. [PubMed] [Google Scholar]
- 30.Brandacher G, et al. Bariatric surgery cannot prevent tryptophan depletion due to chronic immune activation in morbidly obese patients. Obes. Surg. 2006;16:541–548. doi: 10.1381/096089206776945066. [DOI] [PubMed] [Google Scholar]
- 31.Jobgen WS, et al. Regulatory role for the arginine-nitric oxide pathway in metabolism of energy substrates. J. Nutr. Biochem. 2006;17:571–588. doi: 10.1016/j.jnutbio.2005.12.001. [DOI] [PubMed] [Google Scholar]
- 32.Ganz, T. et al. Serum asymmetric dimethylarginine and arginine levels predict microvascular and macrovascular complications in type 2 diabetes mellitus. Diabetes Metab. Res. Rev (2016). [DOI] [PubMed]
- 33.Siroen MPC, et al. The clinical significance of asymmetric dimethylarginine. Annu. Rev. Nutr. 2006;26:203–228. doi: 10.1146/annurev.nutr.26.061505.111320. [DOI] [PubMed] [Google Scholar]
- 34.Kielstein JT, et al. Symmetric dimethylarginine (SDMA) as endogenous marker of renal function - a meta-analysis. Nephrol. Dial. Transpl. 2006;21:2446–2451. doi: 10.1093/ndt/gfl292. [DOI] [PubMed] [Google Scholar]
- 35.Cighetti G, et al. Dimethylarginines in complicated type 1 diabetes: Roles of insulin, glucose, and oxidative stress. Free Radic. Biol. Med. 2009;47:307–311. doi: 10.1016/j.freeradbiomed.2009.05.007. [DOI] [PubMed] [Google Scholar]
- 36.Kalogeropoulou D, et al. Lysine ingestion markedly attenuates the glucose response to ingested glucose without a change in insulin response. Am. J. Clin. Nutr. 2009;90:314–320. doi: 10.3945/ajcn.2008.27381. [DOI] [PubMed] [Google Scholar]
- 37.Liu Z, et al. Dose- and glucose-dependent effects of amino Acids on insulin secretion from isolated mouse islets and clonal INS-1E beta-cells. Rev. Diabet. Stud. 2008;5:232–244. doi: 10.1900/RDS.2008.5.232. [DOI] [PMC free article] [PubMed] [Google Scholar]
- 38.Kosanam H, et al. Diabetes induces lysine acetylation of intermediary metabolism enzymes in the kidney. Diabetes. 2014;63:2432–2439. doi: 10.2337/db12-1770. [DOI] [PubMed] [Google Scholar]
- 39.Jambocus, N. G. S. et al. An investigation into the antiobesity effects of morinda citrifolia L. leaf extract in high fat diet induced obese rats using a H-1 NMR metabolomics approach. J. Diabetes Res (2016). [DOI] [PMC free article] [PubMed]
- 40.Huffman KM, et al. Relationships between circulating metabolic intermediates and insulin action in overweight to obese, inactive men and women. Diabetes Care. 2009;32:1678–1683. doi: 10.2337/dc08-2075. [DOI] [PMC free article] [PubMed] [Google Scholar]
- 41.Pena MJ, et al. Urine and plasma metabolites predict the development of diabetic nephropathy in individuals with Type 2 diabetes mellitus. Diabet. Med. 2014;31:1138–1147. doi: 10.1111/dme.12447. [DOI] [PubMed] [Google Scholar]
- 42.Nicholson JK, et al. Gut microorganisms, mammalian metabolism and personalized health care. Nat. Rev. Microbiol. 2005;3:431–438. doi: 10.1038/nrmicro1152. [DOI] [PubMed] [Google Scholar]
- 43.Bohus E, et al. Temporal metabonomic modeling of L-arginine-induced exocrine pancreatitis. J. Proteome Res. 2008;7:4435–4445. doi: 10.1021/pr800407j. [DOI] [PubMed] [Google Scholar]
- 44.Zhang S, et al. Correlative and quantitative H-1 NMR-based metabolomics reveals specific metabolic pathway disturbances in diabetic rats. Anal. Biochem. 2008;383:76–84. doi: 10.1016/j.ab.2008.07.041. [DOI] [PMC free article] [PubMed] [Google Scholar]
- 45.Vaarala O, et al. The “perfect storm” for type 1 diabetes - the complex interplay between intestinal microbiota, gut permeability, and mucosal immunity. Diabetes. 2008;57:2555–2562. doi: 10.2337/db08-0331. [DOI] [PMC free article] [PubMed] [Google Scholar]
- 46.Lee J-J, et al. Serum uric acid concentration is associated with worsening in severity of diabetic retinopathy among type 2 diabetic patients in Taiwan-A 3-year prospective study. Diabetes Res. Clin. Pract. 2014;106:366–372. doi: 10.1016/j.diabres.2014.07.027. [DOI] [PubMed] [Google Scholar]
- 47.Ren Y, et al. Uric acid, renal function and risk of hypoglycaemia in Chinese type 2 diabetes patients. Diabetes-Metab. Res. 2016;32:875–882. doi: 10.1002/dmrr.2809. [DOI] [PubMed] [Google Scholar]
- 48.Kim ES, et al. Serum uric acid level is associated with metabolic syndrome and microalbuminuria in Korean patients with type 2 diabetes mellitus. J. Diabetes Complications. 2011;25:309–313. doi: 10.1016/j.jdiacomp.2010.09.004. [DOI] [PubMed] [Google Scholar]
- 49.Wang L, et al. A strategy for identification and structural characterization of compounds from Gardenia jasminoides by integrating macroporous resin column chromatography and liquid chromatography-tandem mass spectrometry combined with ion-mobility spectrometry. J. Chromatogr. 2016;1452:47–57. doi: 10.1016/j.chroma.2016.05.026. [DOI] [PubMed] [Google Scholar]
- 50.Srinivasan K, et al. Combination of high-fat diet-fed and low-dose streptozotocin-treated rat: A model for type 2 diabetes and pharmacological screening. Pharmacol. Res. 2005;52:313–320. doi: 10.1016/j.phrs.2005.05.004. [DOI] [PubMed] [Google Scholar]
- 51.Steuerwald AJ, et al. In vitro characterization of an in situ microdialysis sampling assay for elastase activity detection. J. Pharm. Biomed. Anal. 2006;40:1041–1047. doi: 10.1016/j.jpba.2005.05.036. [DOI] [PubMed] [Google Scholar]
- 52.Xia J, et al. MetaboAnalyst 3.0-making metabolomics more meaningful. Nucleic Acids Res. 2015;43:W251–W257. doi: 10.1093/nar/gkv380. [DOI] [PMC free article] [PubMed] [Google Scholar]
Associated Data
This section collects any data citations, data availability statements, or supplementary materials included in this article.


