


Abstract
A reliable and robust method for measuring the expression of alternatively spliced transcripts is an important step in investigating the significance of each variant. So far, accurate quantification of splice variants has been laborious and difficult due to the intrinsic limitations of conventional methods. The many advantages of real-time PCR have made this technique attractive to study its application in quantification of splice isoforms. We use skipping of exon 37 in the NF1 gene as a model to compare and evaluate the different strategies for quantitating splice variants using real-time PCR. An overview of three different possibilities for detecting alternative transcripts is given. We propose the use of a boundary-spanning primer to quantify isoforms that differ greatly in abundance. We describe here a novel method for creating a reliable standard curve using one plasmid containing both alternative transcripts. In addition, we validate the use of an absolute standard curve based on a dilution series of fluorometrically quantified PCR products.
INTRODUCTION
Alternative splicing is a widespread process used in higher eukaryotes to regulate gene expression and functional diversification of proteins. A reliable and robust method for measuring the expression levels of splice variants is an important step in investigating the significance of each variant. Four methods are commonly used to quantify alternative transcripts: northern blotting (1), ribonuclease protection assay (1–3), semi-quantitative RT–PCR (4) and competitive RT–PCR (5,6). All these methods have their intrinsic limitations. Northern blotting is time-consuming, requires relatively large amounts of RNA, and is only suitable for determining relative concentrations of mRNA transcripts that occur in moderate to high abundance. RNase protection analysis is more sensitive than northern blotting, absolute RNA levels can be determined and small sequence variations can be detected. However, it is not sensitive enough to detect low abundance transcripts and the technique is also time-consuming. Semi-quantitative PCR reactions must be stopped and quantified in the early exponential phase, which is of course different for every sample depending on the initial target concentration. Competitive PCR has been commonly used, but its dynamic range is limited to a target-to-competitor ratio of about 1:10 to 10:1. Furthermore, different competitors must be designed for every new target and a large series of reactions with different competitor:target ratios has to be analysed, which makes this quantification method labour intensive.
Recently, a real-time quantitative PCR method was developed that overcomes the limitations associated with conventional quantification methods. Using this method, PCR product accumulation is continuously monitored during cycle progression by means of fluorescent detection chemistries. Real-time PCR is characterised by a large dynamic range of quantification, high accuracy, sensitivity and throughput capacity, and requires no post-amplification manipulation, thus avoiding possible carry-over contamination (7–9). This technique may be very well suited to quantitate alternatively spliced transcripts, but so far only three reports using this technique for the study of alternative splicing have been published (10–12). A reason for this might be the difficulty in creating two reliable standard curves for the intrapolation of unknown samples, a critical step in this kind of analysis. Knowledge of the copy number ratio between the corresponding dilution points of both standard curves is essential in order to compare the quantities of one transcript to another.
We describe here a novel method for creating a reliable relative standard curve using one plasmid containing both alternative transcripts. Serial dilutions of this plasmid were used as a standard curve to compare and evaluate a number of real-time quantification strategies that can be used to analyse alternatively spliced mRNAs. In addition, we provide for the first time evidence that reliable absolute standard curves can be generated based on a dilution series of fluorometrically quantified PCR products.
As a model we use in-frame skipping of exon 37 in the Neurofibromatosis type 1 gene (NF1). The NF1 gene comprises 60 exons and codes for a ubiquitously expressed 11–13-kb transcript with an open reading frame of 2818 amino acids (13). Skipping of exon 37 is present in lymphocytes from healthy people, albeit typically at a low level (14). The quantification of this low-abundance transcript allows us to validate the sensitivity and reliability of real-time PCR.
MATERIALS AND METHODS
RNA isolation and cDNA preparation
RNA was isolated from fresh blood leukocytes, melanocytes and from an EBV transformed B-lymphoblastoid cell line from a normal individual using TRIzol LS Reagent (Invitrogen) according to the manufacturer’s instructions. Total RNA (2 µg) was reversed transcribed using SuperScript II Reverse transcriptase (Invitrogen) and random hexamers (AP Biotech). In addition, tissues were obtained as cDNA (skeletal muscle) or RNA (fetal brain, fetal liver, spinal cord, cerebellum) from Clontech.
Plasmid construction
The NF1 cDNA region spanning nucleotides 4998–6987 was amplified with primers H4F (5′-G GAG TAC CAA GTA TCA TGA G-3′) and H4R (5′-TAT ACG GAG ACT ATC TAA AGT ATG CAG-3′) (15) using cDNA prepared from RNA extracted from fresh blood leukocytes from a healthy individual. The PCR products were cloned in the pCR2.1-TOPO vector (Invitrogen). The subcloned fragments were reamplified with the same primers. Abnormal sized transcripts were sequenced using the Thermo Sequenase fluorescent labelled primer cycle sequencing kit (AP Biotech) and analysed on an ALF-Express automated DNA sequencer (AP Biotech). The vector containing the full-length cDNA (pTOPO-NF1+37) was digested with NheI/PstI and ligated into pUC18 (MBI Fermentas), which was PstI/XbaI digested, generating the pUC18NF1+37 vector. pUC18NF1+37-NF1Δ37 was created by KpnI/BglII cut of the pCR2.1-TOPO vector that contained the transcript lacking exon 37 (pTOPO-NF1Δ37) and the 891 bp fragment was ligated into the pUC18NF1+37 vector that was BamHI/KpnI digested (Fig. 1).
Figure 1.

Schematic representation of the pUC18NF1+37-NF1Δ37 plasmid, which contains both alternative transcripts. ORI, origin of replication; APr, ampicilin resistance gene. Two standard curves are generated from the same serial dilutions, thus providing complete equality of both curves.
As the forward primer, situated in exon 36, can anneal to both transcripts, special attention was given to maximising the distance between the two splice variants, in order to avoid amplification of two PCR products during the short extension time (Figs 1 and 2).
Figure 2.
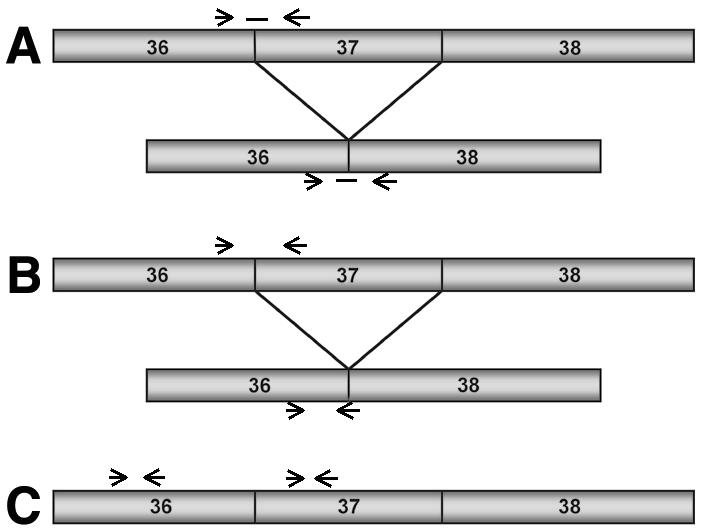
Overview of different possibilities to detect and distinguish alternative splice variants. (A) Detection by a boundary spanning probe. (B) Detection by a boundary spanning primer. (C) Quantification by subtraction, only suitable for equally abundant transcripts.
Primer and probe design
Primers and TaqMan probes (Table 1) were designed using the Primer Express 1.5 software (Applied Biosystems). Primers were purchased from Invitrogen and probes from Eurogentec.
Table 1. Sequences of primer pairs and TaqMan probes.
| Names |
Forward primers |
Reverse primers |
Amplicon |
| Primer pair 1 | 5′-acgagtgtctcatgggcagat-3′ | 5′-tgaatacaagttgacctcatcaagct-3′ | PCR-NF1Δ37 |
| Primer pair 2 | 5′-acgagtgtctcatgggcagat-3′ | 5′-actgttgtaagtgtcaggtccttttaag-3′ | PCR-NF1+37 |
| Primer pair 3 | 5′-cttgttgtctttgggtgtattagca-3′ | 5′-gcagaggcgagtccttgc-3′ | PCR-NF1Δ37′ |
| Probe NF1+37 | 5′-aagcagataatccgtattcttagcaaggcacttga-3′ | ||
| Probe NF1Δ37 | 5′-tccgtattcttagcaaggactcgcctctg-3′ |
Real-time PCR
Amplification reactions for the SYBR Green I assays contained 1× SYBR Green I PCR Mastermix (Applied Biosystems), 3% DMSO and 100 nM of each primer. The PCR conditions were 95°C for 10 min followed by 40 cycles of 95°C for 15 s and 62°C for 1 min. Melting curves were generated after amplification. For the TaqMan assays amplification was performed in 1× TaqMan Universal PCR Master Mix (Applied Biosystems), using 300 nM of each primer and 200 nM probe. The thermal cycling conditions were 95°C for 10 min, 45 cycles of 95°C for 15 s and 60°C for 1 min. For every experiment, 100 ng cDNA (total RNA equivalent) and 0.4 ng Clontech cDNA (mRNA equivalent) were used. Data were collected using the 5700 SDS thermal cycler (Applied Biosystems). Each sample was tested in duplicate and all PCR runs were performed twice.
Standard curves
For the pUC18NF1+37-NF1Δ37 plasmid standard curve, 10-fold serial dilutions were made starting from a plasmid concentration with Ct = 19.5 (Ct = fractional threshold cycle value). Generation of identical duplicates at high Ct-values was significantly improved by diluting pUC18NF1+37-NF1Δ37 in a 10 ng/µl pBR322 containing solution. The dynamic range of the standard curve spanned at least five orders of magnitude.
For generation of the two absolute standard curves, the PCR products (PCR-NF1+37 and PCR-NF1Δ37′) were run on a 3% TBE agarose gel. The fragment was excised and eluted using QIAquick (Qiagen) spin columns. The concentrations of the PCR products were measured using the PicoGreen reagent (Molecular Probes) on a TD-360 fluorometer (Turner Designs). Conversion of micrograms to picomoles was done using the formula: pmol of dsDNA = µg (of dsDNA) × 106 pg/1 µg x 1 pmol/660 pg × 1/Nbp (Nbp = length of the amplicon in bp, dsDNA = double stranded DNA). Equimolar dilutions of both PCR fragments were used to generate the standard curves of at least three orders of magnitude.
RESULTS
Construction and validation of a relative standard curve
In order to investigate the frequency of exon 37 skipping by real-time quantitative PCR, a plasmid was constructed which contained partial NF1 cDNA transcripts lacking exon 37 (NF1Δ37) and containing exon 37 (NF1+37). Exon 36 of both transcripts was separated by 2891 nt in order to avoid amplification of two products by the same forward primer (Figs 1 and 2). Ten-fold serial dilutions of this plasmid were used to obtain a large dynamic range of five orders of magnitude. Two different standard curves were generated from the same series of dilutions using two different primer pairs (Table 1, primer pairs 1 and 2). By using a plasmid containing the two variants in a 1:1 ratio as template, equal quantities can be assigned to each dilution point of the two standard curves (Fig. 1). To test the absolute equality of both standard curves, each plasmid dilution was amplified and subsequently analysed as an unknown sample. This assay was simultaneously performed for the two primer pairs to verify if each tested dilution point resulted in equal quantities, whether it was amplified by primer pair 1 or 2. The paired sample t-test confirmed the equality of both standard curves (P = 0.274 >> 0.05) (Fig. 3).
Figure 3.

Real-time PCR quantification for each dilution point of the pUC18NF1+37-NF1Δ37 plasmid amplified by primer pair 1 (grey) and 2 (black). Equal quantities are observed for each tested dilution point of both standard curves.
Quantification of alternative transcripts using a boundary spanning probe
TaqMan probes encompassing exon 36–37 and 36–38 splice junctions were used to detect full-length (NF1+37) and shortened transcripts (NF1Δ37), respectively (Fig. 2A; Table 1). The primers used to detect the NF1Δ37 transcripts (Table 1, primer pair 1) also enabled amplification of the NF1+37 transcripts, but only the shorter transcript was detected by the probe. To verify the specificity of the probes, each of them was assayed in combination with different concentrations of a cDNA plasmid (pTOPO-NF1+37 or pTOPO-NF1Δ37) containing the transcript normally not recognised by that probe. Even at the highest concentration used (Ct = 26), no fluorescent signal was generated during real-time PCR, confirming the specificity of both probes.
In vivo, the NF1Δ37 transcript is only present at very low levels. To test the influence of excess full-length transcript on detection of the shorter transcript, a dilution series of the shorter transcript was mixed with excess full-length (corresponding Ct = 26.5). Equal amounts of water (instead of full-length cDNA plasmid) were added to a second series of dilutions. Because the probe is specific for the shorter transcript, these two series should result in identical amplification plots. We observed, however, that at low levels of the NF1Δ37 transcript (Ct >31), the presence of the full-length transcript significantly impaired accurate quantification of the low-abundant alternative transcript, probably by depletion of primers or other reagents by co-amplification of NF1+37 transcripts (Fig. 4A). The amplification curve of dilution 4 where full-length was added (blue curve) shows a less steep slope, indicating that the efficiency of amplification is decreasing. Accurate quantification is seriously impaired at higher relative levels of the other isoform. This observed phenomenon is likely to disturb the accurate quantification of the low-abundance NF1Δ37.
Figure 4.

Quantification of NF1Δ37 using a boundary spanning probe (A) or a boundary spanning primer (B). (A) Equal amounts of water (red curves) or NF1+37 (blue curves) were added. Equal Ctvalues are obtained for the first three dilutions. Influence on amplification efficiency from the presence of full-length transcript is already observed for dilution 4 by a reduction of end-point fluorescence and an increase in Ctvalue for the blue curve. At higher Ctvalues quantification is no longer reliable as can be seen for the Ct difference between dilutions 5. (B) No difference is seen between the series with the addition of water (red) and NF1+37 (blue).
Quantification of alternative transcripts using a boundary spanning primer
A different strategy was therefore developed to specifically amplify and quantify the alternative transcript. A primer encompassing the boundary 36–38 was designed for detection of NF1Δ37 (Fig. 2B; Table 1, primer pair 3). This primer pair can be used in combination with a probe or with the double-stranded DNA binding dye SYBR Green I. In this experiment SYBR Green I was used. The specificity of the boundary spanning primer was tested using pTOPO-NF1+37 (Ct = 23), normally not amplified by primer pair 3. Due to the large homology of the 3′ end of exon 36 and 37, PCR conditions had to be optimised (62°C, 3% DMSO) to achieve complete specificity. Using these conditions no aspecific signal was recorded during real-time PCR. In accordance with the test done for the boundary spanning probe, a dilution series of the shorter transcript was mixed with excess full-length (corresponding Ct = 26.5). Equal amounts of water were added to a second and similar series of dilutions. These two series resulted in identical amplification plots, confirming the specificity of the boundary spanning primer (Fig. 4B).
The level of expression of both transcripts in different tissues was determined and quantitative analysis showed the presence of NF1Δ37 at low levels in all tissues examined (Table 2; Fig. 5). The median coefficient of variation (CV) and 90% percentile CV were determined for Ct values and calculated quantities (40 duplicated samples) (Table 3). These descriptive statistics demonstrated very good intra-assay reproducibility. It is of interest to note that CV values based on Ct numbers, although widely used, provide an underestimation of the real variation, due to the exponential nature of PCR and the inherent relationship between Ct numbers and actual quantities. As described, PCR reproducibility is influenced by distribution statistics (Poisson’s law), which can be seen in the larger CV values for quantification of very low copy numbers, as is the case for the NF1Δ37 transcript (e.g. Fig. 5, see duplicated sample for cerebellum). Therefore, replicate quantifications of the same sample should be carried out when working with very low copy numbers. In order to strengthen our conclusions on feasibility and reproducibility, the same quantification strategy was applied to other ‘skipped’ exons in the NF1 gene (29, 30, 29+30) (data not shown). These alternative transcripts are slightly more expressed in comparison with the skip 37 variant, which can be seen in the lower 90% percentile CV values (Table 3).
Table 2. Quantity (%; mean inter-assay CV, 21%) of the transcript lacking exon 37 of the NF1 gene in different tissues.
| Tissue |
Quantity (%) |
| Blood | 0.32 |
| EBV | 1.90 |
| Melanocytes | 0.37 |
| Fetal brain | 0.10 |
| Fetal liver | 0.97 |
| Spin cord | 0.29 |
| Cerebellum | 0.06 |
| Skeletal muscle | 3.21 |
Figure 5.
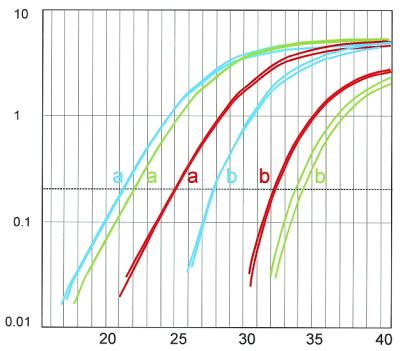
Representative amplification plots of EBV (blue), fetal liver (red) and cerebellum (green). a-curves represent NF1+37, b-curves NF1Δ37.
Table 3. Median coefficient of variation (CV) and 90% percentile CV for Ctvalues and calculated quantities (%).
| |
Median CV (quantity) |
Median CV (Ctvalue) |
90% CV (quantity) |
90% CV
(Ctvalue ) |
| NF1+37 | 3.99 | 0.23 | 14.24 | 0.91 |
| NF1Δ37 | 13.02 | 0.65 | 52.55 | 2.39 |
| NF1+29+30 | 4.34 | 0.26 | 15.23 | 0.92 |
| NF1Δ29, NF1Δ30, NF1Δ29Δ30 | 16.19 | 0.68 | 29.24 | 1.23 |
We can conclude from these results that real-time PCR using a highly specific boundary spanning primer proved to be a sensitive, accurate and reproducible method for quantifying alternative transcripts.
Construction and validation of an absolute standard curve
The accuracy of absolute standard curves is determined by the precise measurement or knowledge of the DNA/RNA template copy numbers. As the absolute equality of both standard curves was already shown using the pUC18NF1+37-NF1Δ37 plasmid, this could be used to demonstrate the accuracy of measuring two different PCR products, generated from the two cDNA variants. We investigated the PicoGreen dsDNA quantitation reagent for its use in generating absolute standard curves. Primer pairs 1 and 3 (Table 1) were used to amplify the two alternative transcripts using pUC18NF1+37-NF1Δ37 as template. After fluorometric determination of the mass concentration with PicoGreen, equimolar concentrations of the two amplicons were serially diluted and amplified by real-time Q-PCR, using the plasmid as standard curve. Figure 6 shows that equal quantities were calculated for all dilution points of both amplicons, demonstrating the reliability of fluorometric determination of DNA concentrations of small PCR products.
Figure 6.

Logarithmic scatterplot of quantities of serial dilutions of PCR-NF1+37 (x-axis) and PCR-NF1Δ37′ (y-axis) products measured by a standard curve based on a dilution series of pUC18NF1+37-NF1Δ37 plasmid DNA.
DISCUSSION
Until recently, quantitative analysis of alternative transcripts has been laborious and hampered by a relatively narrow dynamic range. The many advantages of real-time PCR, such as reproducibility, accuracy and speed, made this technique attractive to study its use in quantification of differential splicing. The small number of studies using this technique for quantification of splice variants probably reflects the difficulties in creating mutually comparable standard curves for each variant.
We have described a novel method for creating a reliable standard curve. We used skipping of exon 37 in the NF1 gene as a model to investigate the quantification of alternative splicing by real-time PCR. Using a plasmid containing the two transcripts in a 1:1 ratio, both standard curves could be generated from the same series of dilutions and results are directly comparable over a large dynamic range. These plasmid standard curves were used to prove for the first time the reliability of an absolute standard curve created by fluorometric DNA concentration measurements.
In general, there are three possible ways to distinguish splice variants: use of a splice junction-specific probe, use of a boundary spanning primer or quantification by subtraction. We compared and evaluated the first two methods. In a first experiment, we used TaqMan probes for discrimination of the different isoforms. Appropriate probe design was shown to be very important as a high similarity was found between the 3′ end of exons 36 and 37. Special attention should always be paid to the boundaries of a skipped exon when designing exon boundary probes in a quantitative splicing assay and specific detection should always be verified using amplification of the variant normally not detected by the probe. Primers used to amplify NF1Δ37 also amplified the NF1+37 cDNA variant, but only NF1Δ37 was detected by the probe. At very low levels of the alternative transcript, this co-amplification impaired the correct quantification probably by depletion of primers or other reagents. The influence of one isoform, in the presence of a 100-fold excess of the other, was also reported by Kafert et al. (10). Although less accurate detection was observed, the assay was estimated to be sensitive enough. We report here that interference is already seen at a 32-fold molar excess (Ct difference of 5) of the other isoform. This influence should be kept in mind when dealing with low-abundance isoforms. Davis-Taber et al. (12) also used a boundary spanning probe for their experiments. Although the variant was highly expressed in skeletal muscle, small intestine and uterus (mean percentage of expression: 39%), the high expression difference between the variants could have impaired accurate quantification in heart (percentage of expression: 3%). Interestingly, multiplex PCR assays are based on the co-amplification of different targets in a single tube. The observed interference in this study suggests that special attention should be given to this phenomenon in multiplex applications, and carefully controlled for.
In a second experiment, a splice junction-specific primer was used for specific amplification of the shorter transcript only, and thus eliminates the above-mentioned problem of co-amplification. A study by Mankertz and Hillenbrand (16) used this strategy to demonstrate the presence or absence of a spliced transcript, but the data were not quantitative. Using splice junction-specific primers, both SYBR Green I and TaqMan probes can be applied for detection. The advantage of a TaqMan probe is that specific hybridisation between probe and target is required to generate a fluorescent signal, thus offering additional specificity (8). The advantage of the double-stranded DNA binding dye SYBR Green I is that it allows detection of any double-stranded DNA, eliminating the need for creating relatively expensive probes, and that multiple dyes bind to a single molecule, increasing the detection sensitivity. Product verification can be achieved by analysing the melting curve of each PCR sample. Amplification artefacts can be distinguished from the specific amplicon by a different melting temperature (17). In this study, we used SYBR Green I in combination with the boundary spanning primer. Careful design of the primer is important. It is advisable that this boundary spanning primer, created for amplification of the shorter transcript, is tested with the full-length transcript, in order to guarantee absolute specificity.
A third possible quantification strategy can be used, but only when dealing with approximately equally abundant alternative transcripts. One primer pair, located in the skipped exon, detects the full-length transcript, whereas another primer pair, located in the preceding or following exon, detects both the full-length and the skipped transcript. Subtraction of the latter by the former value results in the amount of shortened transcripts. Equal abundance of the variants is required because the difference in Ct-values of both amplicons must be significantly higher than the inherent inter-well and inter-assay variation of real-time PCR. Wherever possible, this strategy is the easiest to set up, since no exon spanning primer or probe is required and a reliable standard curve can be generated by using one fragment, such as a PCR product containing both exons. DNase treatment of RNA is a critical issue in this strategy as primer design no longer controls for genomic contamination.
In summary, we propose specific amplification of different isoforms by a boundary spanning primer as the quantification method of choice when the difference in isoform abundance is large. When isoforms are present in approximately equal abundance, specific detection by a TaqMan probe and quantification by the ‘subtraction strategy’ can also be applied.
The generation of an absolute standard curve requires the precise measurement of standard template concentration. DNA concentration measurements for standard curves are commonly used to calculate copy numbers without any control or proof of their reliability. In many studies it is difficult to validate the copy number determination. This is because either the method of concentration measurements was not reported, or a technique with relatively low sensitivity and accuracy (such as absorbency at 260 nm) is employed, or the accuracy and specificity was not demonstrated. Although widely used, caution is called for when using A260 measurements owing to disturbance by the contribution of free nucleotides, proteins and contaminants. Moreover, this technique is characterised by a low sensitivity. This can disturb accurate calculations and have a large influence on the absolute standard curve and the resulting quantities. Equal copy numbers of different products do not necessarily have the same Ct-value in a SYBR Green I assay due to small differences in amplification efficiency and differences in product length, enabling different amounts of SYBR Green I to bind. Our plasmid standard curves were shown to be mutually equal and could thus be used as a tool to validate the reliability of DNA measurements. Two different PCR products (PCR-NF1+37 and PCR-NF1Δ37′) generated from the two alternative transcripts were measured using fluorometric quantification. Equimolar concentrations of both samples were diluted and used as unknown samples in a real-time PCR experiment. Similar quantities for both amplicons were calculated in this experiment, proving for the first time the reliability of generating absolute standard curves by using fluorometric quantification of PCR products.
Quantitative analysis of multiple tissues using SYBR Green I and a boundary spanning primer demonstrated the presence of the cDNA lacking exon 37 in all samples tested, albeit typically at a low level. The assay proved to be fast, reproducible, accurate and sensitive. The significance of skipping of exon 37 is currently not clear. It has been suggested that a functional domain resides in this region (18,19). Loss of heterozygosity in desmoplasmic neurotropic melanoma was most frequently observed at marker IVS38, located in the vicinity of exon 37 (20). This underlines the importance of this region. Further work is needed to investigate whether this shortened transcript also encodes a functional protein. We are currently analysing the general transcription level of NF1 in different tissues and patients in order to look for up or downregulation of different isoforms. To this purpose, the levels of alternative transcripts are normalised to multiple internal control genes as none of the so-called housekeeping genes appears to be expressed at a constant level among different tissues, different stages of development or different persons (J.Vandesompele, K.De Preter, A.De Paepe and F.Speleman, manuscript in preparation).
In conclusion, this study has compared and evaluated different strategies for quantitating alternative splice variants using real-time PCR. We propose the use of well-validated boundary spanning primers to accurately quantify different isoforms, as this strategy is independent of the relative ratio of the different splice variants. A novel method for establishing a reliable standard curve based on one plasmid containing the two alternative transcripts has been described. This has been used as a tool for validating the creation of an absolute standard curve by fluorometric measurement of DNA concentrations.
Acknowledgments
ACKNOWLEDGEMENTS
This work was supported by a grant from Ghent University (BOF 01107799). I.V. is a recipient of a bursary of the Ghent University and J.V. is supported by the Flemish Institute for the Promotion of Scientific Technological Research in Industry (IWT). The authors would like to thank T. Callens and N. Goderis for technical support.
References
- 1.Sambrook J., Fritsch,E.F. and Maniatis,T. (1989) Molecular Cloning: A laboratory Manual, 2nd Edn. Cold Spring Harbor Laboratory Press, Cold Spring Harbor, New York, NY.
- 2.Hod Y. (1992) A simplified ribonuclease protection assay. Biotechniques, 13, 852–854. [PubMed] [Google Scholar]
- 3.Saccomanno C.F., Bordonaro,M., Chen,J.S. and Nordstrom,J.L. (1992) A faster ribonuclease protection assay. Biotechniques, 13, 846–850. [PubMed] [Google Scholar]
- 4.Ferré F. Quantitative or semi-quantitative PCR: reality versus myth. (1992) PCR Methods Appl., 2, 1–9. [DOI] [PubMed] [Google Scholar]
- 5.Becker-André M. and Hahlbrock,K. (1989) Absolute mRNA quantification using the polymerase chain reaction (PCR). A novel approach by a PCR aided transcript titration assay (PATTY). Nucleic Acids Res., 17, 9437–9446. [DOI] [PMC free article] [PubMed] [Google Scholar]
- 6.Gilliland G., Perrin,S., Blanchard,K. and Bunn,H.F. (1990) Analysis of cytokine mRNA and DNA: detection and quantitation by competitive polymerase chain reaction. Proc. Natl Acad. Sci. USA, 87, 2725–2729. [DOI] [PMC free article] [PubMed] [Google Scholar]
- 7.Higuchi R., Fockler,C., Dollinger,G. and Watson,R. (1993) Kinetic PCR analysis: real-time monitoring of DNA amplification reactions. Biotechnology, 11, 1026–1030. [DOI] [PubMed] [Google Scholar]
- 8.Heid C.A., Stevens,J., Livak,K.J. and Williams,P.M. (1996) Real time quantitative PCR. Genome Res., 6, 986–994. [DOI] [PubMed] [Google Scholar]
- 9.Gibson U.E., Heid,C.A. and Williams,P.M. (1996) A novel method for real time quantitative RT–PCR. Genome Res., 6, 995–1001. [DOI] [PubMed] [Google Scholar]
- 10.Kafert S., Krauter,J., Ganser,A. and Eder,M. (1999) Differential quantitation of alternatively spliced messenger RNAs using isoform-specific real-time RT–PCR. Anal. Biochem., 269, 210–213. [DOI] [PubMed] [Google Scholar]
- 11.Favy D.A., Lafarge,S., Rio,P., Vissac,C., Bignon,Y.J. and Bernard-Gallon,D. (2000) Real-time PCR quantification of full-length and exon 11 spliced BRCA1 transcripts in human breast cancer cell lines. Biochem. Biophys. Res. Commun., 274, 73–78. [DOI] [PubMed] [Google Scholar]
- 12.Davis-Taber R., Choi,W., Feng,J., Hoogenboom,L., McNally,T., Kroeger,P., Shieh,C.C., Simmer,R., Brion,J.D., Sullivan,J.P., Gopalakrishnan,M. and Scott,V.E. (2000) Molecular characterization of human SUR2-containing K(ATP) channels. Gene, 256, 261–270. [DOI] [PubMed] [Google Scholar]
- 13.Marchuk D.A., Saulino,A.M., Tavakkol,R., Swaroop,M., Wallace,M.R., Andersen,L.B., Mitchell,A.L., Gutmann,D.H., Boguski,M. and Collins,F.S. (1991) cDNA cloning of the type 1 neurofibromatosis gene: complete sequence of the NF1 gene product. Genomics, 11, 931–940. [DOI] [PubMed] [Google Scholar]
- 14.Messiaen L.M., Callens,T., Mortier,G., Beysen,D., Vandenbroucke,I., Van Roy,N., Speleman,F. and De Paepe,A. (2000) Exhaustive mutation analysis of the NF1 gene allows identification of 95% of mutations and reveals a high frequency of unusual splicing defects. Hum. Mutat., 15, 541–555. [DOI] [PubMed] [Google Scholar]
- 15.Heim R.A., Kam-Morgan,L.N., Binnie,C.G., Corns,D.D., Cayouette,M.C., Farber,R.A., Aylsworth,A.S., Silverman,L.M. and Luce,M.C. (1995) Distribution of 13 truncating mutations in the neurofibromatosis 1 gene. Hum. Mol. Genet., 4, 975–981. [DOI] [PubMed] [Google Scholar]
- 16.Mankertz A. and Hillenbrand,B. (2001) Replication of porcine circovirus type 1 requires two proteins encoded by the viral rep gene. Virology, 279, 429–438. [DOI] [PubMed] [Google Scholar]
- 17.Ririe K.M., Rasmussen,R.P. and Wittwer,C.T. (1997) Product differentiation by analysis of DNA melting curves during the polymerase chain reaction. Anal. Biochem., 245, 154–160. [DOI] [PubMed] [Google Scholar]
- 18.Boddrich A., Robinson,P.N., Schulke,M., Buske,A., Tinschert,S. and Nurnberg,P. (1997) New evidence for a mutation hotspot in exon 37 of the NF1 gene. Hum. Mutat., 9, 374–377. [DOI] [PubMed] [Google Scholar]
- 19.Upadhyaya M., Osborn,M., Maynard,J. and Harper,P. (1996) Characterization of six mutations in exon 37 of neurofibromatosis type 1 gene. Am. J. Med. Genet., 67, 421–423. [DOI] [PubMed] [Google Scholar]
- 20.Gutzmer R., Herbst,R.A., Mommert,S., Kiehl,P., Matiaske,F., Rutten,A., Kapp,A. and Weiss,J. (2000) Allelic loss at the neurofibromatosis type 1 (NF1) gene locus is frequent in desmoplastic neurotropic melanoma. Hum. Genet., 107, 357–361. [DOI] [PubMed] [Google Scholar]