

Abstract
Zinc finger E‐box binding protein 1 (ZEB1) and ZEB2 induce epithelial‐mesenchymal transition (EMT) and enhance cancer progression. However, the global view of transcriptional regulation by ZEB1 and ZEB2 is yet to be elucidated. Here, we identified a ZEB1‐regulated inflammatory phenotype in breast cancer cells using chromatin immunoprecipitation sequencing and RNA sequencing, followed by gene set enrichment analysis (GSEA) of ZEB1‐bound genes. Knockdown of ZEB1 and/or ZEB2 resulted in the downregulation of genes encoding inflammatory cytokines related to poor prognosis in patients with cancer, including IL6 and IL8, therefore suggesting that ZEB1 and ZEB2 have similar functions in terms of the regulation of production of inflammatory cytokines. Antibody array and ELISA experiments confirmed that ZEB1 controlled the production of the IL‐6 and IL‐8 proteins. The secretory proteins regulated by ZEB1 enhanced breast cancer cell proliferation and tumor growth. ZEB1 expression in breast cancer cells also affected the growth of fibroblasts in cell culture, and the accumulation of myeloid‐derived suppressor cells in tumors in vivo. These findings provide insight into the role of ZEB1 in the progression of cancer, mediated by inflammatory cytokines, along with the initiation of EMT.
Keywords: IL‐6, IL‐8, TGF‐β, ZEB1, ZEB2
Abbreviations
- ATCC
American Type Culture Collection
- BM
bone marrow
- CCL
CC chemokine ligand
- CCLE
Cancer Cell Line Encyclopedia
- CD
cluster of differentiation
- CDH1
cadherin‐1
- ChIP‐seq
chromatin immunoprecipitation sequencing
- CSF2 (GM‐CSF)
granulocyte–macrophage colony‐stimulating factor
- CSF3 (G‐CSF)
granulocyte colony‐stimulating factor
- CXCL
chemokine (C‐X‐C motif) ligand
- DMEM
Dulbecco's modified Eagle's medium
- EDTA
ethylenediaminetetraacetic acid
- ELISA
enzyme‐linked immunosorbent assay
- EMT
epithelial‐mesenchymal transition
- ER
estrogen receptor
- ESRP
epithelial splicing regulatory protein
- FBS
fetal bovine serum
- FPKM
fragments per kilobase of exon per million mapped reads
- FSC
forward scatter
- GFP
green fluorescent protein
- GSEA
gene set enrichment analysis
- HBSS
Hanks’ balanced salt solution
- HEPES
4‐(2‐hydroxyethyl)‐1‐piperazineethanesulfonic acid
- HER2
human epidermal growth factor receptor 2
- ICAM‐1
intercellular adhesion molecule 1
- IDO
indoleamine 2,3‐dioxygenase
- IL
interleukin
- JCRB
Japanese Collection of Research Bioresources
- MDSC
myeloid‐derived suppressor cell
- Mo
monocytic
- NEAA
nonessential amino acids
- NES
normalized enrichment score
- PAI‐1
plasminogen activator inhibitor‐1
- PLAUR
plasminogen activator, urokinase receptor
- PMN
polymorphonuclear
- PR
progesterone receptor
- RNA‐seq
RNA sequencing
- RPMI
Roswell Park Memorial Institute
- S.D.
standard deviation
- SDS
sodium dodecyl sulfate
- STAT
signal transducer and activator of transcription
- TGF‐β
transforming growth factor‐β
- ZEB
zinc finger E‐box binding protein
1. Introduction
Breast cancer is a leading cause of cancer death in female patients. It is a heterogeneous disease, similar to cancers of other organs (Badve et al., 2011), and it is an especially troubling disease because healthy young women without any previous history of disease are often affected and show poor prognosis (Anders et al., 2008). In particular, triple‐negative breast cancers that do not express the estrogen receptor (ER), progesterone receptor (PR), and human epidermal growth factor receptor 2 (HER2) are associated with very poor prognosis because they have a strong ability to metastasize, a high risk for relapse, and are refractory to chemotherapy (Anders and Carey, 2009). Among several subtypes of breast cancer, basal‐type breast cancer accounts for most triple‐negative breast cancers and shows a mesenchymal phenotype that is accompanied by high expression of mesenchymal genes including vimentin, and genes involved in the induction of epithelial‐mesenchymal transition (EMT; Neve et al., 2006; Sarrio et al., 2008).
Zinc finger E‐box binding protein 1 (ZEB1) and ZEB2 (also known as δEF‐1 and SIP‐1, respectively) are well‐known transcriptional regulators that induce EMT, which plays important roles in both normal physiological and pathological processes (Eger et al., 2005; Vandewalle et al., 2005; Zhang et al., 2015). While ZEB1 and ZEB2 have many similar properties in transcriptional regulation, they are different in their expression profiles, some molecular and biological functions, including regulation of cell differentiation and disease progression (Postigo and Dean, 2000; Wakamatsu et al., 2001). Epithelial cells lose their adhesive property and become migratory and invasive as they become mesenchymal cells during the EMT process (Nieto et al., 2016; Thiery et al., 2009). Transforming growth factor‐β (TGF‐β) is one of the main cytokines that promotes the EMT (Heldin et al., 2012; Lamouille et al., 2014). Specifically, TGF‐β binds to type I and type II receptors and transduces signals through Smad and non‐Smad signaling pathways (Derynck and Zhang, 2003; Heldin et al., 1997; Massague, 2012). The TGF‐β type I receptor is activated by ligand stimulation and induces the phosphorylation of the receptor‐regulated Smads (R‐Smads), Smad2 and Smad3, which form trimeric complexes with the common‐partner Smad, Smad4. These Smad complexes translocate into the nucleus where they regulate the transcription of various target genes in cooperation with other transcription factors. While expression of ZEB1 and ZEB2 is suppressed by epithelial miR‐200 family of miRNA (Gregory et al., 2008), TGF‐β induces their expression in addition to some other EMT‐related transcription factors, including Snail, and Slug, in certain types of normal and cancer cells (Gregory et al., 2011; Heldin et al., 2012; Miyazono et al., 2012; Xu et al., 2009).
We reported previously that TGF‐β decreases the expression of E‐cadherin through the induction of ZEB1 and ZEB2 in mouse mammary epithelial cells (Shirakihara et al., 2007). We also reported that it induces isoform switching of fibroblast growth factor receptors by alternative splicing, which occurs through downregulation of the expression of epithelial splicing regulatory proteins (ESRPs) by ZEB1 and ZEB2 (Horiguchi et al., 2012). Furthermore, the expression profiles of ZEB1 and ZEB2 are inversely correlated with those of ESRPs in human breast cancer cell lines and tumor specimens (Horiguchi et al., 2012). Consistent with the relationships between the EMT and cancer malignancy, high expression of ZEB1 is associated with poor prognosis of many types of cancer, including breast cancer (Chu et al., 2013; Jang et al., 2015). ZEB2 expression is also reported to be associated with poor prognosis of several types of cancer, although less frequently than ZEB1 (Fang et al., 2013; Prislei et al., 2015). It was recently reported that the EMT is involved in cancer malignancy by contributing not only to metastasis but also to the acquisition of cancer stem cell properties and chemoresistance (Fischer et al., 2015; Ye and Weinberg, 2015; Ye et al., 2015; Zheng et al., 2015). A recent genome‐wide analysis of EMT‐related transcription factor binding regions in pancreatic cancer cells suggested that ZEB1 plays a role in inducing the mesenchymal phenotype by suppressing enhancers that regulate the expression of epithelial genes (Diaferia et al., 2016). However, that analysis focused only on epithelial gene expression that was related to the EMT. Thus, the detailed mechanisms by which ZEB1 and ZEB2 contribute to poor prognosis in cancer remain to be elucidated.
Here, we employed chromatin immunoprecipitation sequencing (ChIP‐seq) and RNA sequencing (RNA‐seq) to investigate the transcriptional program that is regulated by ZEB1 in several basal‐type breast cancer cell lines. We found that ZEB1 directly upregulated the production of inflammatory cytokines in the basal‐type breast cancer cell lines MDA‐231‐D (a highly metastatic clone of MDA‐MB‐231; Ehata et al., 2007) and Hs578T. ZEB2 partially showed similar function, including the induction of interleukin (IL)‐6 and IL‐8 production. Our findings suggested that ZEB1 promotes the proliferation of cancer cells and contributes to the formation of the tumor microenvironment by regulating the expression of inflammatory cytokines. The ZEB1‐regulated inflammatory phenotype identified in this study provides insights into a mechanism that is critical for cancer progression and helps explain the poor prognosis of basal‐type breast cancer.
2. Materials and methods
2.1. Cell culture
The MDA‐231‐D human basal‐type breast cancer cell line, a highly bone metastatic clone of MDA‐MB‐231, was described previously (Ehata et al., 2007) and cultured in Dulbecco's modified Eagle's medium (DMEM; #11965, Thermo Fisher Scientific, Waltham, MA, USA). Hs578T human basal‐type breast cancer cells were obtained for use in this study from the American Type Culture Collection (ATCC, Manassas, VA, USA) and cultured in RPMI1640 (#11875, Thermo Fisher Scientific) with 0.01 mg·mL−1 of insulin (12585‐014, Thermo Fisher Scientific). HCC1954‐Luc human basal‐type breast cancer cells were obtained for use in this study from the Japanese Collection of Research Bioresources (JCRB) Cell Bank (Ibaragi, Osaka, Japan) and cultured in RPMI1640. MCF7 human luminal‐type breast cancer cells were obtained from JCRB and cultured in DMEM with 0.01 mg·mL−1 of insulin. 4T1 mouse breast cancer cells were obtained from the ATCC and cultured in high‐glucose DMEM. WI‐38 and IMR‐90 human lung fibroblast cells were obtained from the ATCC for use in this study and cultured in high‐glucose DMEM. Hs578T, HCC1954‐Luc, MCF7, WI‐38, and IMR‐90 cells were used within 6 months of passage after purchase. All culture media included 10% fetal bovine serum (FBS), 100 units·mL−1 penicillin G, and 100 μg·mL−1 streptomycin. All cells were maintained in a 5% CO2 atmosphere at 37 °C.
2.2. Antibodies and reagents
The following antibodies were used for immunoblotting: anti‐pSTAT3 Tyr705 (D3A7, #9145; Cell Signaling Technology, Danvers, MA, USA), anti‐STAT3 (124H6, #9139; Cell Signaling Technology), anti‐FLAG M2 (F3165; Sigma‐Aldrich, St. Louis, MO, USA), anti‐α‐tubulin (DM1A, T6199; Sigma‐Aldrich), anti‐β‐actin (AC‐15, A5441; Sigma‐Aldrich), anti‐ZEB1 (NBP1‐05987; Novus Biologicals, Minneapolis, MN, USA), and anti‐ZEB2 antibodies (A302‐474A; BETHYL Laboratories, Montgomery, TX, USA). The anti‐ZEB1 antibody (NBP1‐05987) was also used for chromatin immunoprecipitation. Recombinant human TGF‐β (TGF‐β3) and human IL‐6 were obtained from R&D systems (Minneapolis, MN, USA). LY364947 was from Calbiochem, Merck Millipore (Billerica, MA, USA). Cells were not serum‐starved during ligand stimulation.
2.3. RNA interference
Transfection of Stealth Select siRNA (Thermo Fisher Scientific) was performed according to the recommended protocol using Lipofectamine RNAiMAX (Thermo Fisher Scientific). We used two sets of ZEB1, ZEB2, and IL‐6 siRNA: ZEB1 (HSS110548 and HSS186235), ZEB2 (HSS114854 and HSS190654), and IL‐6 (HSS105338 and HSS105339). Control siRNA (Medium GC Complex #2: 12935‐112) was purchased from Thermo Fisher Scientific.
2.4. RNA‐seq and data analysis
RNA‐seq was performed as described previously (Isogaya et al., 2014; Mizutani et al., 2016). cDNA libraries were prepared using the RNeasy Mini Kit with the On‐Column DNase Digestion Set (QIAGEN, Venlo, The Netherlands), Dynabeads mRNA DIRECT Purification Kit, and the Ion Total RNA‐Seq Kit v2 (Thermo Fisher Scientific).
2.5. Chromatin immunoprecipitation, ChIP‐seq, and data analysis
MDA‐231‐D, Hs578T, and MCF7 cells were cultured in 10‐cm plates, and ChIP and ChIP‐seq were performed as described previously (Koinuma et al., 2009; Murai et al., 2015). Data were obtained using the Ion Proton sequencer (Thermo Fisher Scientific). Unfiltered 50‐bp sequence reads were aligned against the human reference genome (NCBI Build 36, hg19). Public anti‐ZEB1 ChIP‐seq data were obtained from GEO (GSM1574278, GSM1010809, GSM803411; ENCODE Project Consortium, 2012). Peaks were called using MACS2 (Zhang et al., 2008). cisgenome software was used to assign a binding site to the nearest gene within 50 kb of a peak (Ji et al., 2011).
2.6. RNA isolation and quantitative RT‐PCR (qRT‐PCR)
Total RNA was extracted using the RNeasy Mini Kit (QIAGEN). First‐strand cDNA synthesis was performed using PrimeScript2 reverse transcriptase and oligo dT primers (TaKaRaBio, Shiga, Japan) according to the manufacturer's instructions. qRT‐PCR was performed using the ABI PRISM7500 Fast Real‐Time PCR System or the StepOnePlus Real‐Time PCR system (Thermo Fisher Scientific) and the Fast Start Universal SYBR Green Master Mix with ROX (Roche Diagnostics, Basel, Switzerland). Mouse and human GAPDH were used for normalization. The primer sequences are shown in Table S1. Data are reported as the means of two technical replicates unless otherwise indicated in the figure legends.
2.7. Preparation of conditioned medium and enzyme‐linked immunosorbent assay (ELISA)
MDA‐231‐D cells and Hs578T cells were seeded (2 × 10⁵ per well in six‐well plates for IL‐6 experiments and 1 × 10⁵ per well in 12‐well plates for IL‐8 experiments). After overnight incubation, siRNA was transfected as described previously, followed by TGF‐β incubation (1 ng·mL−1), LY364947 treatment (1 μm), or a medium change (2 mL per well for six‐well plates and 1 mL per well for 12‐well plates) on the next day of transfection. The supernatant was collected after incubation for 48 h. To prepare the supernatant from HCC1954‐Luc cells, the cells were seeded on a six‐well plate (1 × 10⁵ per well), followed by TGF‐β stimulation, LY364947 (3 μm) treatment, or a medium change (2 mL) the next day. After 48 h of incubation, the supernatant was collected. The concentrations of IL‐6 and IL‐8 were measured using the human IL‐6 Quantikine ELISA Kit and the human CXCL8/IL‐8 Quantikine ELISA Kit (R&D systems), respectively, according to the manufacturer's instructions. Data are reported as the means of two biological replicates.
2.8. Lentiviral vector preparation and infection, and construction of plasmids
Lentiviral expression vectors were obtained from Hiroyuki Miyoshi (RIKEN BioResource Center; present address: Keio University, Tokyo, Japan). Lentiviral vectors were prepared by cotransfection of 293FT cells with pCSII‐EF‐mZEB1 or pCS‐CDF‐CG‐PRE (for EGFP expression) and packaging vectors (pCAG‐HIVgp and pCMV‐VSV‐G‐RSV‐Rev). The medium was changed after 24 h of transfection, and the culture media containing virus particles were collected after incubation for an additional 48 h. cDNAs encoding mouse ZEB1 and human ZEB2 were cloned into lentiviral expression vector or pcDEF3 expression vector. These plasmids were introduced into cells using Lipofectamine 2000 or Lipofectamine 3000 (Thermo Fisher Scientific) according to the recommended protocols.
2.9. Antibody array
The Human Cytokine Antibody Array C2000 (Ray Biotech, Norcross, GA, USA) was used according to the manufacturer's instructions. The LAS‐4000 lumino‐image analyzer (GE Healthcare, Buckinghamshire, UK) was used for chemiluminescence detection, and the strength of each spot was measured using the line profile function of MultiGauge software (FUJIFILM, Tokyo, Japan) and analyzed using the Analysis Tool for AAH‐CYT‐2000 (Ray Biotech).
2.10. Immunoblotting
RIPA buffer (50 mm Tris/HCl (pH 8.0), 150 mm NaCl, 1% NP‐40, 0.1% SDS, and 0.5% sodium deoxycholate) or NP‐40 lysis buffer (1% NP‐40, 150 mm NaCl, 20 mm Tris/HCl pH 7.5) that included Complete EDTA‐free protease inhibitor cocktail (Roche Diagnostics) and Phosphatase Inhibitor Cocktail (EDTA‐free; Nacalai Tesque, Kyoto, Japan) was used for cell lysis. The same amount of proteins was applied to the gels for protein analysis. SDS gel electrophoresis and immunoblotting were performed as described previously (Koinuma et al., 2011), and the signals were analyzed using the LAS‐4000 lumino‐image analyzer. Membranes were incubated with the primary antibodies at 4 °C overnight.
2.11. Tissue array
A tissue array of multiple organ tumors (MC6163) was purchased from US Biomax (Rockville, MD, USA). The paraffin‐embedded array was deparaffinized and rehydrated followed by antigen retrieval using 10 mm sodium citrate buffer (pH 6.0). Endogenous peroxidase activity was blocked by 3.0% hydrogen peroxide. The array was then blocked with Blocking One reagent (Nacalai Tesque) and incubated with anti‐ZEB1 antibody (NBP1‐05987; Novus Biologicals) and human IL‐6 antibody (R&D systems). Anti‐rabbit Alexa488 and anti‐goat Alexa594 were used as the secondary antibodies. The array was mounted with DAPI‐containing mounting medium. Tile scanning was performed using the Leica DMI6000 B inverted microscope with adaptive focus control (Leica Microsystems, Wetzlar, Germany). The signal intensity of each array spot was scored by two researchers (A.K. and Y.T.).
2.12. Tumor model
All animal experiments were performed in accordance with the policies of the animal ethics committee of the University of Tokyo. HCC1954‐Luc cells (4 × 10⁵) were injected into the mammary fat pads of 6‐week‐old female BALB/c nude mice, and 4T1 cells (5 × 10⁵) were injected subcutaneously into BALB/c mice. The lengths and widths of the resulting tumors were measured using calipers, and the tumor volume was calculated as follows: 0.5 × (major axis) × (minor axis)2.
2.13. Senescence‐associated β‐galactosidase (SA‐βGal) staining
Senescent cells were detected using the Senescence β‐Galactosidase Staining Kit (Cell Signaling Technology) according to the manufacturer's instructions.
2.14. Flow cytometry
Primary tumors were isolated from mice, cut into pieces, and digested in RPMI1640 containing 200 U·mL−1 of collagenase, type I (Worthington, Lakewood, NJ, USA) and 10 μg·mL−1 of DNaseI (Roche Diagnostics) for 60 min at 37 °C on a shaking platform. The samples were then washed and filtered through a cell strainer (100‐μm nylon; Corning, Corning, NY, USA). Red blood cells were lysed in Red Blood Cell Lysis Buffer (Roche Diagnostics). The collected cells were incubated with FcR blocking reagent, mouse (Miltenyi Biotec, Bergisch Gladbach, Germany), for 15 min on ice. For flow cytometry, the cells were stained with the following antibodies for 30 min on ice in the dark: CD11b‐APC (M1/70) and Ly6C‐PE (HK1.4) from eBioscience (San Diego, CA, USA), Ly6G‐PE/Cy7 (1A8) and CD45‐Alexa Fluor 700 (30‐F11) from BioLegend (San Diego, CA, USA), and Gr‐1‐FITC (RB6‐8C5) from BD Biosciences (San Jose, CA, USA). The cells were analyzed by Gallios Flow Cytometer (Beckman Coulter, Fullerton, CA, USA) and were further analyzed using flowjo software (TreeStar software, Ashland, OR, USA).
2.15. Isolation and stimulation of mouse bone marrow cells
The femurs and tibias of 6‐ to 8‐week‐old C57BL/6J mice were isolated, and the marrow was flushed with HBSS using a 27‐gauge needle (Thermo Fisher Scientific). Then, the cells were filtered through a cell strainer (100‐μm nylon), and the red blood cells were lysed. Cells (2.5 × 10⁶) were incubated with RPMI1640 supplemented with 2 mm l‐glutamine (Thermo Fisher Scientific), 10 mm HEPES (Thermo Fisher Scientific), 20 μm 2‐mercaptoethanol (Thermo Fisher Scientific), 100 units·mL−1 penicillin G, 100 μg·mL−1 streptomycin, and nonessential amino acids (NEAA; Sigma‐Aldrich) plus 50% HCC‐GFP‐ or HCC‐ZEB1‐conditioned media. After 20 min, the cells were lysed and subjected to immunoblot analysis.
2.16. Statistical analysis
Student's t‐test was used for two‐sample analyses, and the Tukey–Kramer test was used for multisample analyses. Mann–Whitney U‐test was used for in vivo data.
3. Results
3.1. Identification of ZEB1 target genes in breast cancer cells
To determine the genome‐wide distribution of ZEB1‐binding regions in MDA‐231‐D and Hs578T basal‐type breast cancer cells, we performed ChIP‐seq analysis using a validated ZEB1 antibody that did not cross‐react with ZEB2 (Fig. S1A; Horiguchi et al., 2012). We also obtained ChIP‐seq data in MCF7 luminal‐type breast cancer cells. Data were obtained from TGF‐β‐treated cells based on the known functional interaction between Smad signaling and ZEB1 and ZEB2 (Postigo, 2003; Postigo et al., 2003; Verschueren et al., 1999). We identified 32 907 binding regions in MDA‐231‐D cells, 13 514 regions in Hs578T cells, and 281 regions in MCF7 cells that had q‐values < 0.05. Using a more stringent threshold for peak calling, 14 811, 3131, and 108 binding regions were identified in MDA‐231‐D, Hs578T, and MCF7 cells, respectively (q < 10−4). Significant peaks were found at known binding sites (ESRP2 and CDH1 gene loci) in the basal‐type breast cancer cells (Horiguchi et al., 2012), but not at the HBB gene locus, which served as a negative control (Fig. 1A and data not shown). No peaks were found at the ESRP2 and CDH1 gene loci in MCF7 cells, which likely reflected the low expression of ZEB1 in luminal‐type breast cancer cells (Horiguchi et al., 2012). One of the de novo predicted common motifs in the ZEB1‐binding regions in MDA‐231‐D cells matched the known ZEB1‐binding motif, which contained ‘CACCT’ (q = 0.0289) and was found in 38% of the 14 811 binding regions (Fig. 1B). The identified motif was also enriched toward the peak summit positions of ZEB1‐binding regions, supporting the validity of the obtained ChIP‐seq data (Fig. 1C).
Figure 1.
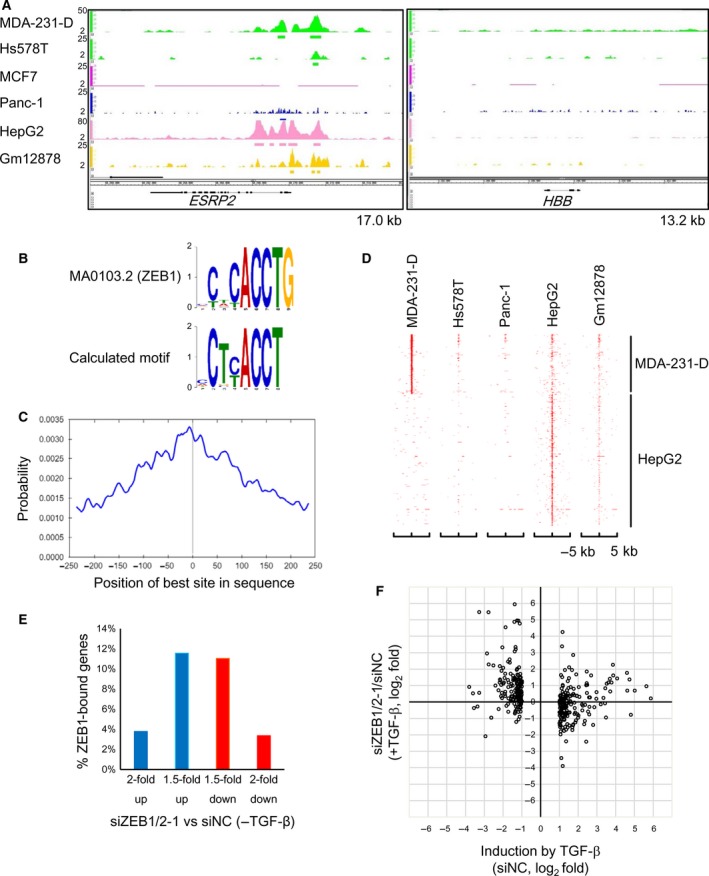
Identification of ZEB1‐binding DNA regions. (A) ZEB1‐binding signals at the ESRP2 and HBB gene loci. The y‐axis scales are not equal as they were adjusted to show the binding signals clearly for each cell line. The kb sizes denote the ranges shown in the panels. The bars below the binding signals indicate the significant binding regions (q < 0.05). (B) De novo motif prediction was performed from the 500‐bp sequences flanking the summit position of each ZEB1‐binding region using the Gibbs Motif Sampler provided by CisGenome. Default parameters were used except for the mean motif length (8), maximum motif length (15), and K (15). The identified E‐box‐like motif was compared to known motifs using the Tomtom motif comparison tool in MEME suite version 4.11.2. The alignment of the calculated motif with a top‐ranked motif (MA0103.2) that was deposited as a ZEB1‐binding site is shown. Y‐axis scale: bits. (C) Motif centrality analysis was performed using the motif calculated in (B) and CentriMo of the MEME suite. The x‐axis indicates the relative position of the best site from the peak summit of each ZEB1‐binding region. (D) A heatmap representation of the ZEB1‐binding regions in the genomes of the indicated cell lines. The y‐axis indicates the union of the ZEB1‐binding regions that were obtained from five cell lines as sorted by the signal intensities of MDA‐231‐D and HepG2. X‐axis: the position of each binding region relative to the peak summits of the ZEB1‐binding regions shown on the y‐axis. (E) Frequencies of the ZEB1‐bound genes showing expression that was up‐ or downregulated more than 1.5‐ or 2‐fold by siRNA targeting ZEB1 and ZEB2 (siZEB1‐1 and siZEB2‐1) in the absence of TGF‐β. Of the 15 175 ZEB1‐bound genes (ZEB1‐binding regions within 50 kb from the transcription start site, TSS), the genes encoding small RNA or showing expression that was < 10 FPKM (fragments per kilobase of exon per million mapped reads) were excluded from the evaluation. In panels (E) and (F), MDA‐231‐D cells were transfected with siRNA and treated with or without 1 ng·mL−1 of TGF‐β for 24 h. RNA‐seq was then performed. siNC, control siRNA. (F) A scatter plot showing the relationship between the effect of ZEB1/2 siRNA (siZEB1‐1 and siZEB2‐1) and TGF‐β as determined by RNA‐seq. ZEB1‐bound, TGF‐β‐regulated genes showing expression that was induced or suppressed ≥ 2‐fold were selected (n = 5975). siZEB1/2‐1, siZEB1‐1 + siZEB2‐1. Each dot represents a single gene.
Our data were then compared to all of the publically available human ZEB1‐binding data for human pancreatic carcinoma Panc‐1, human hepatoblastoma HepG2, and the Gm12878 B‐lymphoblastic cell lines using the same read aligner, peak caller, and parameters (Diaferia et al., 2016; Hensen et al., 2014). We found that MDA‐231‐D cells and HepG2 cells had distinct profiles in terms of their ZEB1‐binding regions and that Hs578T and Panc‐1 cells, but not Gm12878 cells, shared ZEB1‐binding regions with MDA‐231‐D cells (Fig. 1D). Many of the ZEB1‐binding regions in Hs578T and Panc‐1 cells overlapped with those in MDA‐231‐D cells (69.8% and 71.7%, respectively). In contrast, Gm12878 cells shared only 29.3% of their ZEB1‐binding regions with MDA‐231‐D cells, and most of the remaining regions were shared with HepG2 cells, indicating that ZEB1‐binding regions were relatively conserved in basal‐type breast cancer cells, but not in other types of cancer cells.
ZEB1 acts as both a transcriptional activator and repressor (Lehmann et al., 2016; Sanchez‐Tillo et al., 2011). To clarify the global view of ZEB1‐regulated transcription, we performed RNA‐seq using MDA‐231‐D cells. To examine the function of ZEB1 in the context of the EMT, MDA‐231‐D cells were transfected with a combination of siRNA targeting ZEB1 and ZEB2 and were then left untreated or were stimulated with TGF‐β. The amounts of ZEB1 and ZEB2 proteins were efficiently decreased by the siRNA in MDA‐231‐D cells (Fig. S1B) and the specificity of the siRNA was confirmed (Fig. S1C). The ZEB1‐binding regions were present within 50 kb of the transcriptional start site of 14 900 genes, which accounted for 64.0% of the total number of genes analyzed. Of the ZEB1‐bound genes, 5975 were expressed at 10 or more FPKM (fragments per kilobase of exon per million mapped reads), and the number of genes that were either upregulated or downregulated by ZEB1/2 knockdown was similar (Fig. 1E).
We then evaluated the effect of ZEB1/2 siRNA on TGF‐β‐induced changes in the expression of ZEB1‐bound genes. Focusing on the ZEB1‐target genes that were either up‐ or downregulated more than 2‐fold by TGF‐β, we found that knockdown of ZEB1/2 largely upregulated the expression of genes that were downregulated by TGF‐β (Fig. 1F). This tendency was not observed for genes that were upregulated by TGF‐β.
3.2. ZEB1 regulates the expression of inflammatory response genes
To identify the functional signatures of ZEB1‐bound genes that were enriched in MDA‐231‐D cells, gene set enrichment analysis (GSEA) was conducted using MDA‐231‐D cell gene expression data (Fig. 2A). The most notable finding was that the expression of inflammatory response genes was downregulated by the knockdown of ZEB1 and ZEB2 in the TGF‐β‐untreated condition (Fig. 2B). The downregulated genes that were categorized as inflammatory response genes are listed in Table S2, along with positional information about ZEB1 binding. A similar tendency was observed in the TGF‐β‐treated condition; remarkably, the IL1A, CCL20, IL6, SERPINE1, IL8, and IL1B genes were commonly and strongly downregulated in both conditions (Fig. 2C). Focusing on the ZEB1 ChIP‐seq data, peaks were found at the promoter or enhancer regions of the identified genes, including IL6, IL8, and CSF2, in MDA‐231‐D and Hs578T cells, but not in MCF7 cells (Fig. 2D), suggesting that ZEB1 binds and regulates the expression of inflammatory response genes in basal‐type breast cancer cells.
Figure 2.
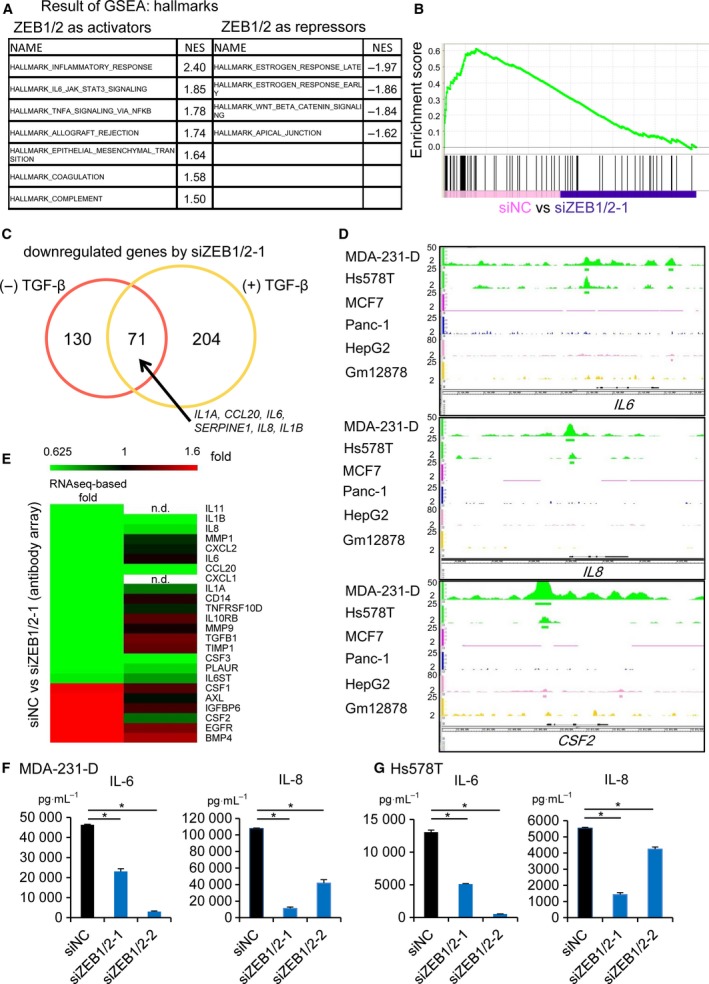
ZEB1 regulates the expression of inflammatory response genes. (A–C) GSEA was performed using the RNA‐seq data in Fig. 1E and F. ZEB1‐bound genes were selected for evaluation. (A) Gene sets in MDA‐231‐D cells that were differentially expressed after treatment with ZEB1/2 siRNA (siZEB1‐1 and siZEB2‐1). The most enriched MSigDB hallmark signatures that had normalized enrichment scores (NES) > 1.5 or < −1.5 are listed. (B) Enrichment plot of the HALLMARK_INFLAMMATORY_RESPONSE gene set. ZEB1‐bound genes (vertical black bars in the bottom panel) were enriched toward the left; ZEB1 and ZEB2 functioned as transcriptional activators. siZEB1/2‐1, siZEB1‐1 + siZEB2‐1. (C) Venn diagram showing the overlap of genes that were downregulated by ZEB1/2‐1 siRNA in the presence and absence of TGF‐β. Genes with maximum FPKM values ≥ 10 in the four samples were selected for further evaluation, and those with fold changes (FPKM (siZEB1/2) + 0.01)/(FPKM(siNC) + 0.01) ≤ 0.5 were defined as downregulated genes. (D) Visualization of the ZEB1 ChIP‐seq data tracks at the IL6,IL8, and CSF2 gene loci. Data are shown as in Fig. 1A. (E) Antibody array analysis of proteins in conditioned medium obtained from serum‐starved MDA‐231‐D cells. ZEB1‐bound genes and genes regulated by ZEB1/2 siRNA according to ChIP‐seq and RNA‐seq analysis are shown in a heat map in the order of downregulation by siRNA (left panel). Conditioned medium was collected from MDA‐231‐D cells treated with ZEB1/2‐1 siRNA and analyzed using an antibody array. The effects of ZEB1/2 siRNA on cytokine secretion are shown in the right panel. Genes were selected according to the following criteria: Maximal expression values (FPKM) were ≥ 10, and there was a fold change ≥ 1.5 in response to ZEB1/2 siRNA. Note that the amount of IL‐6 protein in this cell line was very high and could not be quantitatively evaluated in this array. n.d.: not detected. (F) The effect of ZEB1/2 siRNA on the secretion of IL‐6 and IL‐8 by MDA‐231‐D cells as determined by ELISA. Error bars indicate the S.D. *P < 0.05. (G) The effect of ZEB1/2 siRNA on the secretion of IL‐6 and IL‐8 by Hs578T cells as determined by ELISA. Error bars indicate the S.D. *P < 0.05. In (F) and (G), siZEB1/2‐1, siZEB1‐1 + siZEB2‐1; siZEB1/2‐2, siZEB1‐2 + siZEB2‐2.
Based on these findings, we focused on ZEB1‐regulated secretory proteins. An antibody array detected 174 human cytokines in the conditioned culture media of MDA‐231‐D cells that were transfected with ZEB1/2 siRNA. ZEB1/2 siRNA downregulated secreted IL‐1β, IL‐8, and IL‐1α proteins in MDA‐231‐D cells. The expression levels of the CCL20, PLAUR (plasminogen activator, urokinase receptor), CSF3 (granulocyte colony‐stimulating factor, G‐CSF), and CSF2 (granulocyte–macrophage colony‐stimulating factor, GM‐CSF) proteins were also regulated by ZEB1 (Fig. 2E). Of note, reduction in secreted IL‐6 protein by ZEB1/2 siRNA was not observed because of the saturated signals in both control siRNA‐ and ZEB1/2 siRNA‐treated conditions. We then used two sets of ZEB1/2 siRNA to quantitatively evaluate the effects of ZEB1/2 siRNA on IL‐6 and IL‐8 secretion by MDA‐231‐D cells and Hs578T cells using ELISA and found a similar tendency as in the RNA‐seq analysis (Fig. 2F and G). Notably, the amounts of proteins secreted by MDA‐231‐D cells were comparable to the levels secreted by inflammatory cells, suggesting that IL‐6 and IL‐8 were produced at functional levels (Nastasi et al., 2015; Pazmandi et al., 2012).
3.3. ZEB1 and ZEB2 have similar functions in the regulation of inflammatory cytokine expression
While both ZEB1 and ZEB2 suppress the expression of CDH1 and induce EMT, previous reports have also revealed some different functions between them. We thus evaluated whether ZEB1 and ZEB2 have similar functions in the production of inflammatory cytokines. We knocked down the expression of ZEB1 or ZEB2 and obtained RNA‐seq data from MDA‐231‐D cells. Knockdown of ZEB1 or ZEB2 did not strongly affect each other's protein expression (Fig. S1C). GSEA analysis suggested that siRNA against either ZEB1 or ZEB2 downregulated the expression of inflammatory response genes, including IL6 and IL8, although normalized enrichment score (NES) of inflammatory response genes in one of the ZEB2 siRNA was not more than 1.5 (NES = 1.34; Fig. 3A and Fig. S1D). qRT‐PCR analysis also revealed that expression of IL6 and IL8 was decreased by knockdown of either ZEB1 or ZEB2 (Fig. 3B). Therefore, ZEB1 and ZEB2 have essentially similar functions in the regulation of inflammatory response gene expression, especially IL6 and IL8, in the basal‐type breast cancer cells.
Figure 3.
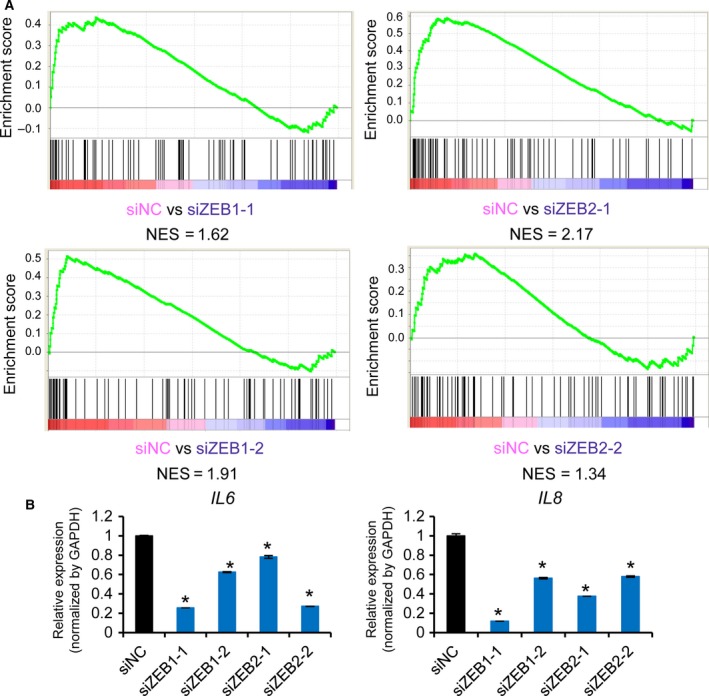
ZEB1 and ZEB2 have similar functions in the regulation of inflammatory cytokines. (A) Enrichment plots of the HALLMARK_INFLAMMATORY_RESPONSE gene set showing the effect of ZEB1 or ZEB2 siRNA in MDA‐231‐D cells. List of genes (vertical black bars in the bottom panel) were the same as Fig. 2B and enriched toward the left; ZEB1 and ZEB2 functioned as transcriptional activators. (B) Effect of ZEB1 or ZEB2 siRNA on the expression of IL6 and IL8 in MDA‐231‐D cells determined by qRT‐PCR. Error bars, S.D. *P < 0.05 compared to siNC.
3.4. TGF‐β affects the production of cytokines and chemokines that are regulated by ZEB1
ZEB1 functions as a transcriptional activator by binding to Smad1, Smad2, and Smad3 and supports their transcriptional activities (Postigo, 2003; Postigo et al., 2003), while ZEB2 inhibits TGF‐β signaling (Verschueren et al., 1999). Based on the similar functions of ZEB1 and ZEB2 on the expression of inflammatory cytokines, we then investigated whether ZEB1 and ZEB2 regulate the expression of inflammatory response genes induced by TGF‐β stimulation. Of the basal‐type breast cancer cell lines, MDA‐231‐D and Hs578T expressed ZEB1 and ZEB2, while HCC1954‐Luc cells showed only small amounts of ZEB1 and ZEB2 proteins (Fig. S2A; Horiguchi et al., 2012). In agreement with the immunoblot data, quantitative evaluation using RNA‐seq data in MDA‐231‐D cells suggested that the expression of ZEB2 was lower than that of ZEB1 (Fig. 4A). Of note, ZEB1 and ZEB2 expression was not upregulated by TGF‐β in MDA‐231‐D cells (Fig. S2B).
Figure 4.
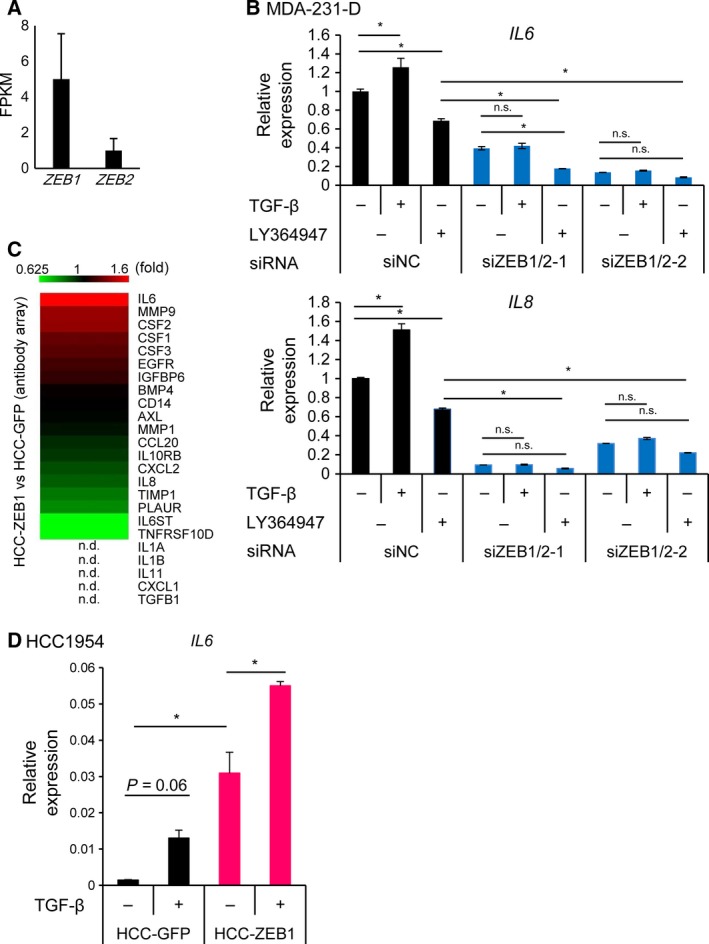
The effect of TGF‐β signaling on the expression of ZEB1‐regulated secretory proteins. (A) The expression of ZEB1 and ZEB2 in MDA‐231‐D cells as determined by RNA‐seq. Error bars, C.I. (B) qRT‐PCR analysis of IL6 and IL8 expression in the presence or absence of TGF‐β (1 ng·mL−1, 48 h) and a TGF‐β inhibitor (LY364947: 1 μm, 48 h) in MDA‐231‐D cells transfected with ZEB1/2 siRNA. Data represent the means of two biological replicates. Error bars, S.D. *P < 0.05; n.s., not significant. siZEB1/2‐1, siZEB1‐1 + siZEB2‐1; siZEB1/2‐2, siZEB1‐2 + siZEB2‐2. (C) A heatmap showing the effect of exogenous ZEB1 expression versus control vector infection as determined by antibody array analysis of the conditioned medium obtained from a 48‐h culture of serum‐starved HCC1954‐Luc cells. The list of proteins is the same as in Fig. 2E, and it is arranged in the order of induction by ZEB1 in HCC1954‐Luc cells. HCC‐ZEB1, ZEB1‐expressing HCC1954‐Luc cells; HCC‐GFP, GFP‐expressing HCC1954‐Luc cells. n.d., not detected using the same criteria as in Fig. 2E. (D) qRT‐PCR analysis to determine the effects of TGF‐β on IL6 expression in HCC1954‐Luc cells that were overexpressing ZEB1. RNA was obtained from the cells 48 h after TGF‐β stimulation. Data are shown as the means of two biological replicates. Error bars, S.D. *P < 0.05.
We found that TGF‐β increased the expression of IL6 and IL8, while LY364947, which is a TGF‐β type I receptor kinase inhibitor, decreased their baseline expression levels (Fig. 4B). The effect of TGF‐β on the expression of IL6 and IL8 was not observed in the absence of ZEB1 and ZEB2. A similar tendency was observed regarding the TGF‐β‐induced expression of CSF2 and CXCL5 (Fig. S2B). Significant induction of IL1B by TGF‐β could not be seen; however, the effect of LY364947 on IL1B expression in the control siRNA‐transfected cells was inhibited by ZEB1/2 siRNA. Consistent results were not obtained regarding the effect of ZEB1/2 siRNA on TGF‐β‐induced CXCL1 expression.
We then exogenously expressed ZEB1 and ZEB2 in HCC1954‐Luc cells by transfection of expression plasmids (Fig. S2C), and found that ZEB1, and to a lesser extent ZEB2, increased the IL6 and IL8 expression. We also established HCC‐1954‐Luc cells stably expressing ZEB1 (HCC‐ZEB1; Fig. S2D). Analysis of secreted proteins from HCC‐ZEB1 cells using an antibody array revealed that ZEB1 induced the production of IL‐6 and CSF2, but not IL‐8, in this cell line (Fig. 4C). IL6 expression in HCC1954‐Luc cells was significantly increased by exogenous ZEB1 expression, similar to its effect in MDA‐231‐D cells (Fig. 4D). In addition, TGF‐β increased the expression of IL6 in the presence of ZEB1 in HCC‐1954‐Luc cells (Fig. 4D). These results suggested that ZEB1 and possibly ZEB2 played a central role in IL6 and IL8 transcription independent of TGF‐β signaling, and simultaneously, they were required for the induction of IL6 and IL8 by TGF‐β. These results also suggested that production of inflammatory cytokines by ZEB1 and ZEB2 is induced in a context‐dependent manner and that expression of ZEB1 and ZEB2 is not sufficient to induce some of the target proteins.
3.5. Correlation of the expression of IL‐6 and IL‐8 with ZEB1 expression in various types of cancer
To evaluate the regulatory functions of ZEB1 in other types of breast cancer cells and cancer tissues, we obtained expression microarray data from the Cancer Cell Line Encyclopedia (CCLE; Barretina et al., 2012) and analyzed the relationship of the expression of ZEB1 with that of inflammatory cytokines, that is, IL6 and IL8, in breast cancer cells. We found that a small subset of the cell lines was ‘double‐positive’ for the expression of ZEB1 and IL6 and/or IL8 (Fig. 5A). In contrast, the expression of ZEB2 was generally low in breast cancer cells compared to THP‐1 cells, an acute myelogenous leukemia cell line with known ZEB2 function (Li et al., 2017), and showed weaker correlation with IL6 and IL8 expression than that of ZEB1 (Fig. S3A). We also examined the relationship between ZEB1 and IL‐6 in other types of cancers using a tissue array of 448 cancer tissues from multiple organs and found other double‐positive cancers (Fig. 5B and Fig. S3B,C). These findings suggested that the transcriptional activation of IL6 by ZEB1 is not restricted to breast cancer cells and tissues and found in a subset of other types of ZEB1‐expressing tumors.
Figure 5.
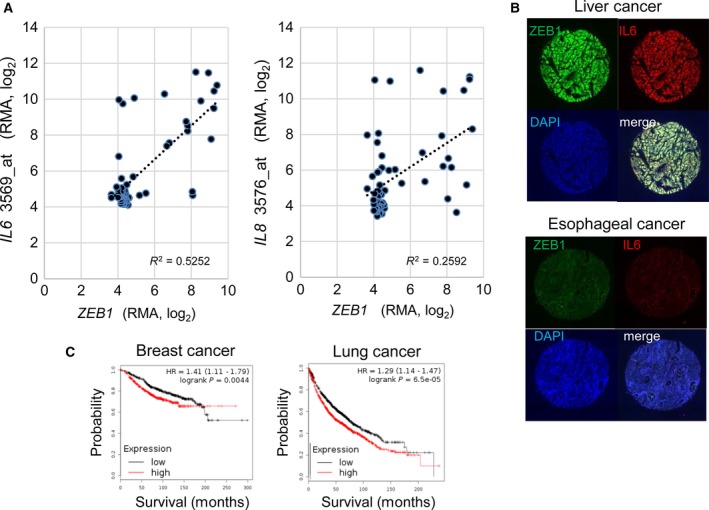
Correlation of the expression of ZEB1 and IL‐6 and other cytokines in various cancers. (A) Correlation analysis of the expression of ZEB1 and cytokines in breast cancer cell lines using data obtained from the Cancer Cell Line Encyclopedia (CCLE). Breast cancer cell lines were selected for the analysis, and each dot represents a cell line. Affymetrix microarray probe IDs for IL6 and IL8 are shown after the gene symbols on the y‐axis. RMA, robust multiarray average. (B) Representative results obtained from the tissue array analysis in Fig. S3. The top panel shows a case that was positive for both nuclear ZEB1 staining (green) and whole‐cell IL‐6 staining (red); scores = 4. The bottom panel shows a case that was negative for both ZEB1 and IL‐6; scores = 1. The samples were counterstained with DAPI to show cell density in the spot. Original magnification: 20 ×. (C) Kaplan–Meier survival curves of breast and lung cancer patients obtained from a public meta‐analysis database and Kaplan–Meier plotter (Gyorffy et al., 2010, 2013). The probability of overall survival of patients as split by median IL6 and IL8 expression is shown. Red: IL6 and IL8 high expression group; black: IL6 and IL8 low expression group.
We then examined the prognostic importance of IL6 and IL8, which are regulated by ZEB1 using publically available meta‐analysis database (Kaplan–Meier plotter, http://kmplot.com/analysis/; Fig. 5C). High expression of IL6 and IL8 was significantly correlated with poor survival in breast cancer and lung cancer, which is consistent with a previous report (Hartman et al., 2013).
3.6. ZEB1 promotes HCC1954‐Luc cell proliferation and tumor growth
Next, we used HCC‐GFP and HCC‐ZEB1 cells to investigate the biological importance of ZEB1‐induced cytokines. Phosphorylation of STAT3 was observed in the absence of IL‐6 expression, suggesting the activation of STAT3 by other pathways, and was moderately enhanced in ZEB1‐expressing HCC1954‐Luc cells (Fig. 6A). ZEB1 promoted the proliferation of HCC1954‐Luc cells (Fig. 6B), and this effect was attenuated by IL6 siRNA (Fig. 6C). Conditioned medium from HCC‐ZEB1 cell culture enhanced the proliferation of the parental HCC1954‐Luc cells (Fig. 6D). These results suggested that secreted factors, especially IL‐6, contributed to the growth of ZEB1‐expressing HCC‐ZEB1 cells in an autocrine manner. We also found that ZEB1 enhanced tumor growth when HCC1954‐Luc cells were grafted into nude mice (Fig. 6E).
Figure 6.
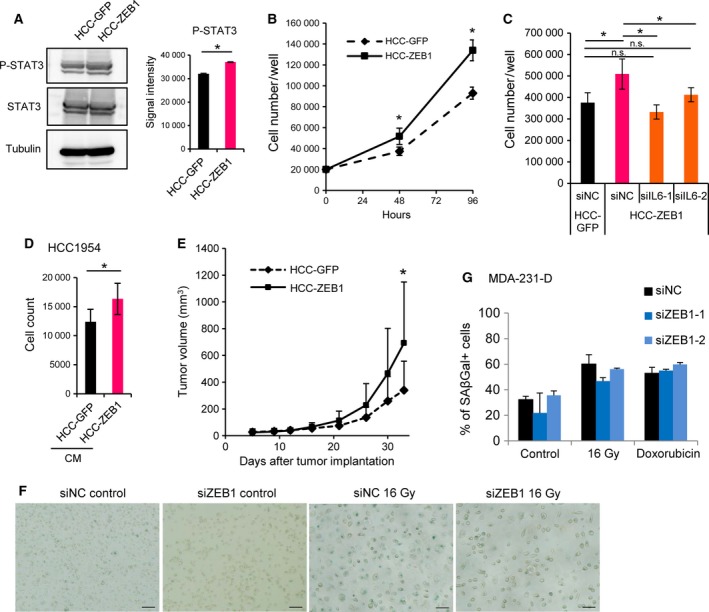
ZEB1 promotes the proliferation and tumor growth of HCC1954‐Luc cells through IL‐6 in an autocrine manner. (A) Tyrosine phosphorylation of STAT3 (P‐STAT3) in control (HCC‐GFP) or ZEB1‐overexpressing (HCC‐ZEB1) HCC1954‐Luc cells. Cell lysates were subjected to immunoblot analysis as indicated. Representative data of two independent experiments are shown. The right panel shows quantification of the P‐STAT3 immunoblot results as the means of two independent experiments. Error bars, S.D.; *P < 0.05. (B) The effect of ZEB1 expression on the number of HCC1954‐Luc cells in vitro using the trypan blue exclusion assay. Data are shown as the means of two independent experiments. Error bars, S.D.; *P < 0.05. (C) The effect of IL‐6 siRNA on the number of ZEB1‐overexpressing HCC1954‐Luc cells. Cells were counted 72 h after siRNA transfection. siIL6, IL6 siRNA. Data are shown as the means of two independent experiments. Error bars, S.D., *P < 0.05 by Tukey–Kramer test. n.s.: not significant. (D) HCC1954‐Luc cells were cultured with conditioned medium from control or ZEB1‐overexpressing HCC1954‐Luc cells, and cells were counted after 96 h of incubation. Conditioned media were replenished every 24 h. CM, conditioned medium. Data are shown as the means of two independent experiments. Error bars, S.D.; *P < 0.05. (E) The volumes of tumors formed from control or ZEB1‐overexpressing HCC1954‐Luc cells that were xenografted into nude mice (n = 15 for control, n = 14 for ZEB1). Error bars, +S.D. *P < 0.05 by the Mann–Whitney U‐test. (F, G) Induction of premature cellular senescence was not affected by ZEB1 siRNA. (F) MDA‐231‐D cells were transfected with siRNA as indicated and stained for SA‐βGal 6 days after 16 Gy of irradiation. Three images were taken for each condition, and representative images are shown. Scale bars: 200 μm. (G) MDA‐231‐D cells were transfected with siRNA as indicated and cellular senescence was induced by 16‐Gy irradiation or 75 μm doxorubicin treatment. In terms of irradiation conditions, siRNA was transfected again 2 days after senescence induction. Cells were stained for SA‐βGal 6 days after treatment. Three images were taken for each condition except for one of the controls (two images), and the percentage of SA‐βGal cells was calculated.
IL‐6, IL‐8, and some other ZEB1‐regulated secretory proteins are related to the senescence‐associated secretory phenotype (Perez‐Mancera et al., 2014). However, the induction of cellular senescence in MDA‐231‐D cells by irradiation or doxorubicin treatment, followed by SA‐βGal staining, failed to show a significant correlation between ZEB1 expression and cellular senescence (Fig. 6F and G).
3.7. Conditioned medium from ZEB1‐expressing MDA‐231‐D cells increases fibroblast growth in a paracrine manner
We further studied the functional relationship between cancer cells and fibroblasts and found that conditioned media from HCC‐ZEB1 and MDA‐231‐D cells upregulated phosphorylated STAT3 in IMR90 and WI38 human fibroblasts (Fig. 7A). Although conditioned medium from HCC‐ZEB1 cells did not increase the growth of IMR90 and WI38 cells (Fig. 7B), conditioned medium from ZEB1/2‐silenced MDA‐231‐D cells significantly decreased the growth of IMR90 and WI38 cells (Fig. 7C). Taken together, these results suggested that ZEB1 expressed in cancer cells contributes to the growth of fibroblasts in paracrine and context‐dependent manners.
Figure 7.
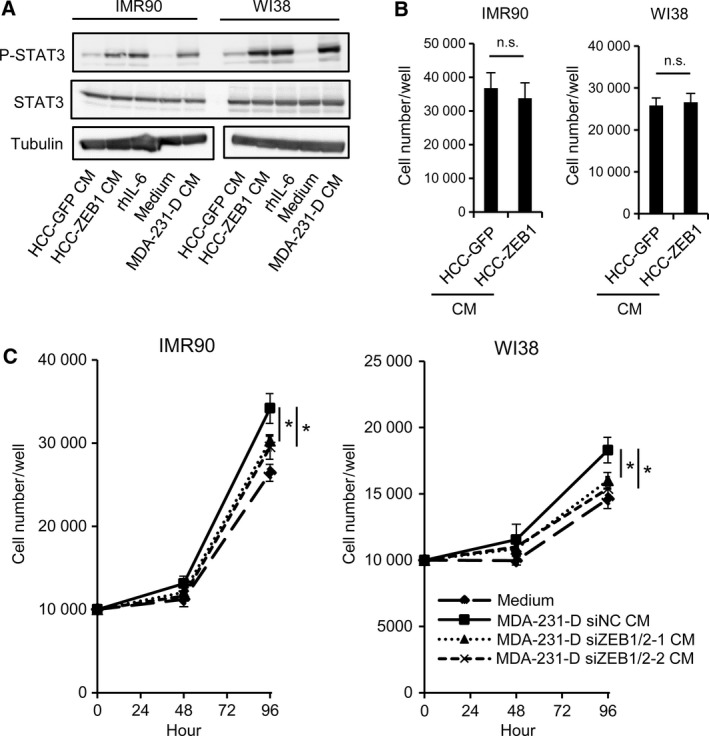
The effect of ZEB1‐regulated secretory factors on fibroblast growth. (A) Tyrosine phosphorylation of STAT3 in IMR90 and WI38 fibroblasts after the addition of conditioned media. Cells were collected 20 min after stimulation, and the cell lysates were subjected to immunoblot analysis as indicated. CM, conditioned medium; rhIL‐6, recombinant human IL‐6 (100 ng·mL−1). (B, C) The effect of conditioned medium from cultured breast cancer cells on fibroblast cell growth. The number of IMR90 and WI38 cells was counted after 72 h of incubation using the trypan blue exclusion assay. Conditioned media were obtained from ZEB1‐overexpressing HCC1954‐Luc cells and control cells (HCC‐GFP) (B), or from ZEB1/2‐silenced MDA‐231‐D cells and control cells (C). siZEB1/2‐1, siZEB1‐1 + siZEB2‐1; siZEB1/2‐2, siZEB1‐2 + siZEB2‐2. Conditioned medium was replenished every 24 h. In panel (C), data are shown as the means of three (IMR90) or four (WI38) biological replicates. CM, conditioned medium; n.s., not significant; *P < 0.05.
3.8. ZEB1 induces myeloid cells that express markers characteristic of polymorphonuclear myeloid‐derived suppressor cells (MDSCs) within tumors
Because ZEB1 regulated the production of inflammatory cytokines, including IL‐6, IL‐8, IL‐1β, CXCL1, and CXCL5, we evaluated the paracrine effect of ZEB1‐regulated secretory proteins in terms of their antitumor immune functions. MDSCs comprise heterogeneous cell populations that have the potential for immunosuppressive activity. MDSCs induce immune tolerance in the tumor microenvironment by suppressing cytotoxic T‐lymphocyte activity (Gabrilovich et al., 2012; Ugel et al., 2015). They are defined as CD11b+ Gr‐1+ cells in mouse and are categorized as polymorphonuclear (PMN)‐MDSCs and monocytic (Mo)‐MDSCs. PMN‐MDSCs are defined as CD11b+ Ly6Clow Ly6G+ cells that express high levels of arginase 1. In contrast, Mo‐MDSCs are defined as CD11b+ Ly6Chigh Ly6G− cells that express high levels of Nos2 (iNOS; Talmadge and Gabrilovich, 2013). The number of MDSCs in tumor tissue is associated with disease stage in patients with breast cancer (Markowitz et al., 2013). To examine the effect of ZEB1‐regulated secretory proteins on the accumulation and maturation of MDSCs in vivo, we established murine breast cancer 4T1 cells that overexpressed mouse ZEB1 (4T1‐ZEB1). We confirmed the increased expression of Il6, Il8, and Il1b mRNA in 4T1‐ZEB1 cells versus 4T1‐GFP cells (Fig. 8A).
Figure 8.
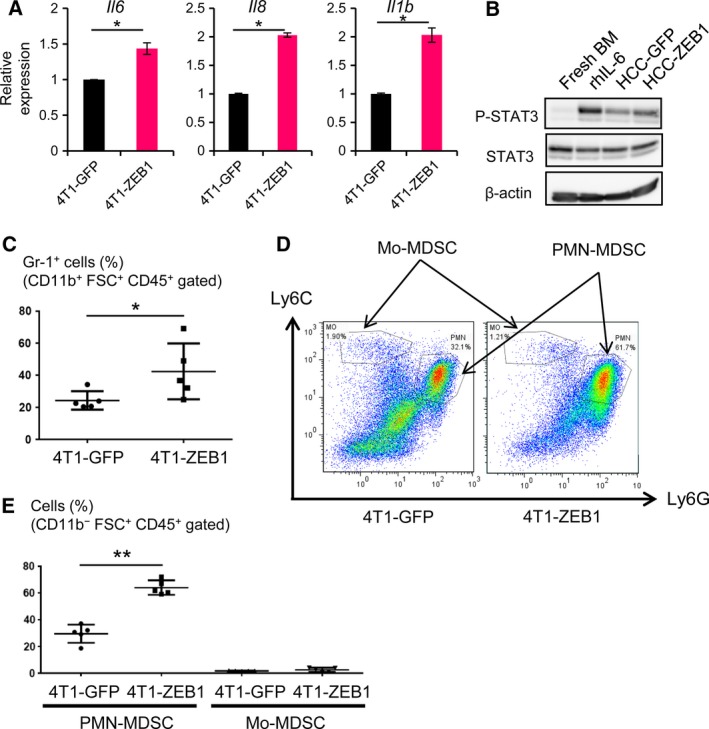
ZEB1‐regulated secretory factors regulate intratumor MDSC populations. (A) qRT‐PCR analysis of the expression of Il6, Il8, and Il1b in ZEB1‐overexpressing mouse breast cancer 4T1 cells. Values were normalized to Gapdh. Error bars, S.D. *P < 0.05 by Student's t‐test. (B) Tyrosine phosphorylation of STAT3 in mouse BM cells after incubation in conditioned media from control GFP (HCC‐GFP) or ZEB1‐overexpressing (HCC‐ZEB1) HCC1954‐Luc cells for 20 min in cell culture. Cell lysates were subjected to immunoblot analysis as indicated. Recombinant human IL‐6 (rhIL‐6: 40 ng·mL−1) was used as a positive control. BM, bone marrow. (C–E) BALB/c mice were injected subcutaneously with ZEB1‐overexpressing 4T1 cells (4T1‐ZEB1). Twenty‐one days after injection, the tumor was removed and analyzed by flow cytometry. 4T1‐GFP, GFP‐expressing control 4T1 cells. (C) Gr‐1‐positive MDSCs (%) in CD11b+ FSC + CD45+‐gated cells in tumor tissues (n = 5). *P < 0.05 by Mann–Whitney U‐test. (D) Quantification of the subpopulation of MDSCs. The gates used to quantify Mo‐MDSCs and PMN‐MDSCs are shown. (E) The percentages of PMN‐MDSCs and Mo‐MDSCs in CD11b+ FSC + CD45+‐gated cells. Data are shown as the medians ± S.D. for the five tumors. **P < 0.01 by Mann–Whitney U‐test.
STAT3 has been reported to be related to the accumulation and expansion of MDSCs (Condamine and Gabrilovich, 2011). To determine whether ZEB1‐regulated secretory proteins affect MDSC development, we focused on STAT3 phosphorylation in mouse bone marrow (BM) cells using conditioned medium from HCC‐ZEB1 cells. We found that STAT3 phosphorylation was enhanced by conditioned medium from HCC‐ZEB1 cells (Fig. 8B).
4T1‐ZEB1 cells were then used in a syngeneic tumor model in immunocompetent BALB/c mice. Tumor size and lung metastasis were not significantly different between 4T1‐ZEB1 cells and 4T1‐GFP cells, possibly because of the highly aggressive nature of 4T1 cells. We then evaluated the accumulation and maturation of MDSCs in the tumor sites by flow cytometry and found that the percentage of Gr‐1‐positive cells was increased in the 4T1‐ZEB1 tumors compared to 4T1‐GFP tumors (Fig. 8C). To characterize the increased MDSCs in more detail, we also evaluated the expression of Ly6C and Ly6G on the cells obtained from tumors to identify PMN‐MDSCs (CD11b+ Ly6Clow Ly6G+) and Mo‐MDSCs (CD11b+ Ly6Chigh Ly6G−; Fig. 8D). We found that the percentage of PMN‐MDSCs in the CD11b+ FSC+ CD45+ population of the cells was significantly increased in 4T1‐ZEB1 tumors, while the percentage of Mo‐MDSCs was not (Fig. 8E). Together with the findings from a report showing the immunosuppressive activity of Ly6G+ PMN‐MDSCs from 4T1 tumor‐bearing mice (Kim et al., 2014), these findings suggested that ZEB1 expression in tumor cells increases the PMN‐MDSC population in CD11b+ cells.
4. Discussion
Expanding and differential roles of ZEB1 and ZEB2 have been identified in various types of cancers in recent years (Chaffer et al., 2013; Krebs et al., 2017; Mejlvang et al., 2007; Morel et al., 2017; Si et al., 2015; Spaderna et al., 2008). ZEB1 is expressed primarily in nonepithelial cells, and a genome‐wide analysis of ZEB1‐binding regions performed in an adipogenesis model clearly shows its physiological importance (Gubelmann et al., 2014). Therefore, it is not surprising that the main consequence of the ectopic expression of ZEB1 differs greatly between cancer cell types. This is because transcription factor binding regions are affected by the epigenetic environment in the cells, which is dynamically regulated by TGF‐β and other extracellular stimuli (Ostuni et al., 2013). The observation that ZEB1 has differential effects on the expression of genes that are either downregulated or upregulated by TGF‐β in MDA‐231‐D cells also supports the importance of cellular context. In addition, Hs578T and Panc‐1 cells showed very similar ZEB1 binding profile, which likely reflected both similar binding strength and regulatory mechanism of ZEB1 binding.
Thus, apart from its general role as an EMT inducer, ZEB1 and ZEB2 may have multiple functions that will be elucidated by analyses in specific cancer types in the future.
Inflammatory cytokines play crucial roles in various aspects of cancer, including cancer development, progression, treatment resistance, and prognosis. IL‐1β promotes colon cancer cell stemness and invasiveness (Li et al., 2012). IL‐8 is also associated with cancer stem cell‐like properties, and its expression correlates with poor prognosis in human pancreatic cancer (Chen et al., 2014). Of these inflammatory cytokines, IL‐6 is reported to play especially important roles in the development of lung and breast cancers (Gao et al., 2007; Sansone et al., 2007). With regard to the effect of these cytokines on the EMT, previous reports focused mainly on the regulation of EMT‐related downstream factors, with ZEB1 reported as a target gene of certain inflammatory cytokines (Liu et al., 2015; Peinado et al., 2007). A recent report suggested that inflammation induces disseminated, dormant cancer cells to form metastatic tumors through functions of ZEB1 (De Cock et al., 2016). It is also reported that ZEB2 is induced by inflammation (Katoh and Katoh, 2009). However, the induction of IL‐6 and IL‐8 by ZEB1 and ZEB2, an inverse relationship that was revealed in this study, has not been investigated in detail.
It is widely accepted that cancer cells show EMT‐like phenotypes due to the production of various cytokines. For example, elevated expression of IL6 and other chemoresistance‐related genes accompanies the EMT in a mouse breast cancer model (Fischer et al., 2015). Our finding that ZEB1 and ZEB2 are inducers of inflammatory cytokines is supported by a report by Suarez‐Carmona et al. (2015) that Slug, Snail, and other EMT‐related transcription factors regulate the production of soluble factors, such as IL‐8, IL‐6, sICAM‐1, PAI‐1, and GM‐CSF/CSF2. Taken together, these data indicate that inflammatory cytokines induce EMT‐related transcription factors and vice versa in certain cancer cells to enhance tumor progression. These processes can be targeted by molecular therapies.
Our findings indicated that ZEB1 and partly ZEB2 regulated the characteristic inflammatory phenotype of breast cancer cells, in part through IL‐6 and IL‐8. The ZEB1‐regulated inflammatory phenotype identified in this study was characterized by enhanced breast cancer cell growth, fibroblast proliferation, and PMN‐MDSC accumulation, although each of these was observed only in certain cell types and was context dependent. The correlation between IL‐6 production and cancer proliferation has been reported in various types of cancers, including lung, prostate, and breast cancers (Gao et al., 2007; Giri et al., 2001; Sansone et al., 2007; Yamaji et al., 2004). IL‐6 secreted by cancer cells activates STAT3, and induces downstream events, including cancer cell proliferation and apoptosis inhibition. Our results support these reports and revealed that IL‐6, as a central soluble factor that was positively regulated by ZEB1, constantly activated STAT3 in HCC1954‐Luc cells and exhibited cell‐proliferating potency both in cell culture and in vivo. IL‐6, which was regulated by ZEB1 and ZEB2 in breast cancer cells, also induced the proliferation of fibroblasts in a context‐dependent manner, suggesting that ZEB1 and ZEB2 regulate the production and function of cancer‐associated fibroblasts, which are the main constituents of tumor microenvironments, thereby enhancing tumor growth (Kalluri and Zeisberg, 2006; Xing et al., 2010).
In terms of MDSCs, IL‐6 strongly induces their accumulation and maturation. IL‐6 is reported to restore the impaired accumulation of MDSCs and tumor progression in tumor‐bearing mice lacking IL‐1β or indoleamine 2,3‐dioxygenase (IDO; Bunt et al., 2007; Smith et al., 2012). Activated STAT3 is the main regulator of IL‐6 in MDSCs, inducing cell survival, cell proliferation (Xin et al., 2009), and immunosuppressive activity (Kujawski et al., 2008). IL‐8 also enhances PMN‐MDSC infiltration into tumor tissues (Kumar et al., 2016; Sandhu et al., 2000). Furthermore, IL‐1β is reported to induce the accumulation of MDSCs (Bunt et al., 2007; Elkabets et al., 2010). In addition to IL‐6, IL‐8, and IL‐1β, another ZEB1‐regulated cytokine, G‐CSF/CSF3, also enhances the accumulation of MDSCs (Talmadge and Gabrilovich, 2013). ZEB1 also regulates the expression of the chemokines CXCL1 and CXCL5, which are the ligands for the CXCR2 receptor, and increases the infiltration of PMN‐MDSCs (Acharyya et al., 2012; Katoh et al., 2013; Toh et al., 2011). Although the present study showed no additional effect of ZEB1 on tumor progression or on the metastasis of 4T1 cells, which may be due to the aggressive nature of the parental 4T1 cells, these observations suggest that inflammatory cytokines induced by ZEB1 play critical roles in the progression of cancer in a context‐dependent manner.
In basal‐type breast cancer cells, high ZEB1 expression was observed even in the absence of TGF‐β (Horiguchi et al., 2012). Of note, in mammary carcinomas that do not express the TGF‐β type II receptor, CXCL5 expression is increased, resulting in the recruitment of MDSCs (Yang et al., 2008). Thus, although TGF‐β induces the expression of ZEB1 and ZEB2, which function as key transcription factors in the induction of the EMT in various types of epithelial cells, TGF‐β signaling and ZEB1 and ZEB2 act in opposite ways in cancer cells in some contexts, including in the regulation of MDSCs, and they play distinct roles in cancer progression.
In conclusion, ZEB1 and ZEB2, through the induction of various cytokines, including IL‐6 and IL‐8, facilitate tumor growth both in autocrine and in paracrine manners in basal‐type breast cancer cells. Future studies will focus on evaluating these extracellular proteins as potential anticancer targets to inhibit the progression of cancer.
Availability of data and materials
The raw ChIP‐seq and RNA‐seq data are available at GEO (GSE89206).
Author contributions
AK and YT performed most of the in vitro experiments, together with SH, MH, JN, YY, and SE, AK, YT, TS, and KT performed the in vivo experiments. AK, YT, and YM performed the immunohistochemistry. AM and DK determined the experimental conditions for the ZEB1 ChIP‐seq analysis. YT, AK, DK, and MM acquired and analyzed the high‐throughput sequencing data. DK and KM designed experiments and analyzed data. TM established the HCC1954‐Luc cells. YT, AK, MM, KM, and DK wrote the manuscript.
Supporting information
Fig. S1. Specificity of ZEB1 and ZEB2 antibodies and the result of GSEA analysis showing the effect of ZEB1 or ZEB2 siRNA in MDA‐231‐D cells.
Fig. S2. The effect of ZEB1/2 siRNA on the expression of inflammatory response genes.
Fig. S3. Tissue array analysis of ZEB1 and IL‐6 expression using fluorescent immunohistochemistry.
Fig. S4. Efficiency of IL6 siRNA and the amount of ZEB1 protein in 4T1 breast cancer cells.
Table S1. Sequences of the primers used for RT‐PCR.
Table S2. A list of ZEB1‐bound inflammatory response genes.
Acknowledgements
We thank Yudai Hirano and Keiko Yuki for technical assistance and members of the Miyazono laboratory for helpful discussions, advice, and reagents. We also thank Drs. Hiroyuki Aburatani and Shuichi Tsutsumi (University of Tokyo) for suggestions regarding the ChIP‐seq experiments. This work was supported by KAKENHI grants‐in‐aid for Scientific Research grants (C) ([15K06831] to DK) and (S) ([15H05774] to KM) from the Japan Society for the Promotion of Science (JSPS), and by a grant from the Japan Agency for Medical Research and Development (AMED) (to DK). This study was conducted as part of a research program of the Project for Development of Innovative Research on Cancer Therapeutics (P‐Direct), AMED. This work was also supported by the Princess Takamatsu Cancer Research Fund (14‐24609 to DK). YT is supported by the Yoshida Scholarship Foundation and by the Graduate Program for Leaders in Life Innovation from the Japan Society for the Promotion of Science.
References
- Acharyya S, Oskarsson T, Vanharanta S, Malladi S, Kim J, Morris PG, Manova‐Todorova K, Leversha M, Hogg N, Seshan VE et al (2012) A CXCL1 paracrine network links cancer chemoresistance and metastasis. Cell 150, 165–178. [DOI] [PMC free article] [PubMed] [Google Scholar]
- Anders CK and Carey LA (2009) Biology, metastatic patterns, and treatment of patients with triple‐negative breast cancer. Clin Breast Cancer 9(Suppl 2), S73–S81. [DOI] [PMC free article] [PubMed] [Google Scholar]
- Anders CK, Hsu DS, Broadwater G, Acharya CR, Foekens JA, Zhang Y, Wang Y, Marcom PK, Marks JR, Febbo PG et al (2008) Young age at diagnosis correlates with worse prognosis and defines a subset of breast cancers with shared patterns of gene expression. J Clin Oncol 26, 3324–3330. [DOI] [PubMed] [Google Scholar]
- Badve S, Dabbs DJ, Schnitt SJ, Baehner FL, Decker T, Eusebi V, Fox SB, Ichihara S, Jacquemier J, Lakhani SR et al (2011) Basal‐like and triple‐negative breast cancers: a critical review with an emphasis on the implications for pathologists and oncologists. Mod Pathol 24, 157–167. [DOI] [PubMed] [Google Scholar]
- Barretina J, Caponigro G, Stransky N, Venkatesan K, Margolin AA, Kim S, Wilson CJ, Lehar J, Kryukov GV, Sonkin D et al (2012) The cancer cell line encyclopedia enables predictive modelling of anticancer drug sensitivity. Nature 483, 603–607. [DOI] [PMC free article] [PubMed] [Google Scholar]
- Bunt SK, Yang L, Sinha P, Clements VK, Leips J and Ostrand‐Rosenberg S (2007) Reduced inflammation in the tumor microenvironment delays the accumulation of myeloid‐derived suppressor cells and limits tumor progression. Cancer Res 67, 10019–10026. [DOI] [PMC free article] [PubMed] [Google Scholar]
- Chaffer CL, Marjanovic ND, Lee T, Bell G, Kleer CG, Reinhardt F, D'Alessio AC, Young RA and Weinberg RA (2013) Poised chromatin at the ZEB1 promoter enables breast cancer cell plasticity and enhances tumorigenicity. Cell 154, 61–74. [DOI] [PMC free article] [PubMed] [Google Scholar]
- Chen L, Fan J, Chen H, Meng Z, Chen Z, Wang P and Liu L (2014) The IL‐8/CXCR1 axis is associated with cancer stem cell‐like properties and correlates with clinical prognosis in human pancreatic cancer cases. Sci Rep 4, 5911. [DOI] [PMC free article] [PubMed] [Google Scholar]
- Chu PY, Hu FW, Yu CC, Tsai LL, Yu CH, Wu BC, Chen YW, Huang PI and Lo WL (2013) Epithelial‐mesenchymal transition transcription factor ZEB1/ZEB2 co‐expression predicts poor prognosis and maintains tumor‐initiating properties in head and neck cancer. Oral Oncol 49, 34–41. [DOI] [PubMed] [Google Scholar]
- Condamine T and Gabrilovich DI (2011) Molecular mechanisms regulating myeloid‐derived suppressor cell differentiation and function. Trends Immunol 32, 19–25. [DOI] [PMC free article] [PubMed] [Google Scholar]
- De Cock JM, Shibue T, Dongre A, Keckesova Z, Reinhardt F and Weinberg RA (2016) Inflammation triggers Zeb1‐dependent escape from tumor latency. Cancer Res 76, 6778–6784. [DOI] [PMC free article] [PubMed] [Google Scholar]
- Derynck R and Zhang YE (2003) Smad‐dependent and Smad‐independent pathways in TGF‐β family signalling. Nature 425, 577–584. [DOI] [PubMed] [Google Scholar]
- Diaferia GR, Balestrieri C, Prosperini E, Nicoli P, Spaggiari P, Zerbi A and Natoli G (2016) Dissection of transcriptional and cis‐regulatory control of differentiation in human pancreatic cancer. EMBO J 35, 595–617. [DOI] [PMC free article] [PubMed] [Google Scholar]
- Eger A, Aigner K, Sonderegger S, Dampier B, Oehler S, Schreiber M, Berx G, Cano A, Beug H and Foisner R (2005) δEF1 is a transcriptional repressor of E‐cadherin and regulates epithelial plasticity in breast cancer cells. Oncogene 24, 2375–2385. [DOI] [PubMed] [Google Scholar]
- Ehata S, Hanyu A, Fujime M, Katsuno Y, Fukunaga E, Goto K, Ishikawa Y, Nomura K, Yokoo H, Shimizu T et al (2007) Ki26894, a novel transforming growth factor‐β type I receptor kinase inhibitor, inhibits in vitro invasion and in vivo bone metastasis of a human breast cancer cell line. Cancer Sci 98, 127–133. [DOI] [PMC free article] [PubMed] [Google Scholar]
- Elkabets M, Ribeiro VS, Dinarello CA, Ostrand‐Rosenberg S, Di Santo JP, Apte RN and Vosshenrich CA (2010) IL‐1β regulates a novel myeloid‐derived suppressor cell subset that impairs NK cell development and function. Eur J Immunol 40, 3347–3357. [DOI] [PMC free article] [PubMed] [Google Scholar]
- Fang Y, Wei J, Cao J, Zhao H, Liao B, Qiu S, Wang D, Luo J and Chen W (2013) Protein expression of ZEB2 in renal cell carcinoma and its prognostic significance in patient survival. PLoS One 8, e62558. [DOI] [PMC free article] [PubMed] [Google Scholar]
- Fischer KR, Durrans A, Lee S, Sheng J, Li F, Wong ST, Choi H, El Rayes T, Ryu S, Troeger J et al (2015) Epithelial‐to‐mesenchymal transition is not required for lung metastasis but contributes to chemoresistance. Nature 527, 472–476. [DOI] [PMC free article] [PubMed] [Google Scholar]
- Gabrilovich DI, Ostrand‐Rosenberg S and Bronte V (2012) Coordinated regulation of myeloid cells by tumours. Nat Rev Immunol 12, 253–268. [DOI] [PMC free article] [PubMed] [Google Scholar]
- Gao SP, Mark KG, Leslie K, Pao W, Motoi N, Gerald WL, Travis WD, Bornmann W, Veach D, Clarkson B et al (2007) Mutations in the EGFR kinase domain mediate STAT3 activation via IL‐6 production in human lung adenocarcinomas. J Clin Invest 117, 3846–3856. [DOI] [PMC free article] [PubMed] [Google Scholar]
- Giri D, Ozen M and Ittmann M (2001) Interleukin‐6 is an autocrine growth factor in human prostate cancer. Am J Pathol 159, 2159–2165. [DOI] [PMC free article] [PubMed] [Google Scholar]
- Gregory PA, Bert AG, Paterson EL, Barry SC, Tsykin A, Farshid G, Vadas MA, Khew‐Goodall Y and Goodall GJ (2008) The miR‐200 family and miR‐205 regulate epithelial to mesenchymal transition by targeting ZEB1 and SIP1. Nat Cell Biol 10, 593–601. [DOI] [PubMed] [Google Scholar]
- Gregory PA, Bracken CP, Smith E, Bert AG, Wright JA, Roslan S, Morris M, Wyatt L, Farshid G, Lim YY et al (2011) An autocrine TGF‐β/ZEB/miR‐200 signaling network regulates establishment and maintenance of epithelial‐mesenchymal transition. Mol Biol Cell 22, 1686–1698. [DOI] [PMC free article] [PubMed] [Google Scholar]
- Gubelmann C, Schwalie PC, Raghav SK, Roder E, Delessa T, Kiehlmann E, Waszak SM, Corsinotti A, Udin G, Holcombe W et al (2014) Identification of the transcription factor ZEB1 as a central component of the adipogenic gene regulatory network. eLife 3, e03346. [DOI] [PMC free article] [PubMed] [Google Scholar]
- Gyorffy B, Lanczky A, Eklund AC, Denkert C, Budczies J, Li Q and Szallasi Z (2010) An online survival analysis tool to rapidly assess the effect of 22,277 genes on breast cancer prognosis using microarray data of 1,809 patients. Breast Cancer Res Treat 123, 725–731. [DOI] [PubMed] [Google Scholar]
- Gyorffy B, Surowiak P, Budczies J and Lanczky A (2013) Online survival analysis software to assess the prognostic value of biomarkers using transcriptomic data in non‐small‐cell lung cancer. PLoS One 8, e82241. [DOI] [PMC free article] [PubMed] [Google Scholar]
- Hartman ZC, Poage GM, den Hollander P, Tsimelzon A, Hill J, Panupinthu N, Zhang Y, Mazumdar A, Hilsenbeck SG, Mills GB et al (2013) Growth of triple‐negative breast cancer cells relies upon coordinate autocrine expression of the proinflammatory cytokines IL‐6 and IL‐8. Cancer Res 73, 3470–3480. [DOI] [PMC free article] [PubMed] [Google Scholar]
- Heldin CH, Miyazono K and ten Dijke P (1997) TGF‐β signalling from cell membrane to nucleus through SMAD proteins. Nature 390, 465–471. [DOI] [PubMed] [Google Scholar]
- Heldin CH, Vanlandewijck M and Moustakas A (2012) Regulation of EMT by TGF‐β in cancer. FEBS Lett 586, 1959–1970. [DOI] [PubMed] [Google Scholar]
- Hensen F, Cansiz S, Gerhold JM and Spelbrink JN (2014) To be or not to be a nucleoid protein: a comparison of mass‐spectrometry based approaches in the identification of potential mtDNA‐nucleoid associated proteins. Biochimie 100, 219–226. [DOI] [PubMed] [Google Scholar]
- Horiguchi K, Sakamoto K, Koinuma D, Semba K, Inoue A, Inoue S, Fujii H, Yamaguchi A, Miyazawa K, Miyazono K et al (2012) TGF‐β drives epithelial‐mesenchymal transition through δEF1‐mediated downregulation of ESRP. Oncogene 31, 3190–3201. [DOI] [PMC free article] [PubMed] [Google Scholar]
- Isogaya K, Koinuma D, Tsutsumi S, Saito RA, Miyazawa K, Aburatani H and Miyazono K (2014) A Smad3 and TTF‐1/NKX2‐1 complex regulates Smad4‐independent gene expression. Cell Res 24, 994–1008. [DOI] [PMC free article] [PubMed] [Google Scholar]
- Jang MH, Kim HJ, Kim EJ, Chung YR and Park SY (2015) Expression of epithelial‐mesenchymal transition‐related markers in triple‐negative breast cancer: ZEB1 as a potential biomarker for poor clinical outcome. Hum Pathol 46, 1267–1274. [DOI] [PubMed] [Google Scholar]
- Ji H, Jiang H, Ma W and Wong WH (2011) Using CisGenome to analyze ChIP‐chip and ChIP‐seq data. Curr Protoc Bioinformatics Chapter 2, Unit2 13. [DOI] [PMC free article] [PubMed] [Google Scholar]
- Kalluri R and Zeisberg M (2006) Fibroblasts in cancer. Nat Rev Cancer 6, 392–401. [DOI] [PubMed] [Google Scholar]
- Katoh M and Katoh M (2009) Integrative genomic analyses of ZEB2: transcriptional regulation of ZEB2 based on SMADs, ETS1, HIF1α, POU/OCT, and NF‐κB. Int J Oncol 34, 1737–1742. [DOI] [PubMed] [Google Scholar]
- Katoh H, Wang D, Daikoku T, Sun H, Dey SK and Dubois RN (2013) CXCR2‐expressing myeloid‐derived suppressor cells are essential to promote colitis‐associated tumorigenesis. Cancer Cell 24, 631–644. [DOI] [PMC free article] [PubMed] [Google Scholar]
- Kim K, Skora AD, Li Z, Liu Q, Tam AJ, Blosser RL, Diaz LA Jr, Papadopoulos N, Kinzler KW, Vogelstein B et al (2014) Eradication of metastatic mouse cancers resistant to immune checkpoint blockade by suppression of myeloid‐derived cells. Proc Natl Acad Sci USA 111, 11774–11779. [DOI] [PMC free article] [PubMed] [Google Scholar]
- Koinuma D, Shinozaki M, Nagano Y, Ikushima H, Horiguchi K, Goto K, Chano T, Saitoh M, Imamura T, Miyazono K et al (2011) RB1CC1 protein positively regulates transforming growth factor‐β signaling through the modulation of Arkadia E3 ubiquitin ligase activity. J Biol Chem 286, 32502–32512. [DOI] [PMC free article] [PubMed] [Google Scholar]
- Koinuma D, Tsutsumi S, Kamimura N, Taniguchi H, Miyazawa K, Sunamura M, Imamura T, Miyazono K and Aburatani H (2009) Chromatin immunoprecipitation on microarray analysis of Smad2/3 binding sites reveals roles of ETS1 and TFAP2A in transforming growth factor β signaling. Mol Cell Biol 29, 172–186. [DOI] [PMC free article] [PubMed] [Google Scholar]
- Krebs AM, Mitschke J, Losada ML, Schmalhofer O, Boerries M, Busch H, Boettcher M, Mougiakakos D, Reichardt W, Bronsert P et al (2017) The EMT‐activator Zeb1 is a key factor for cell plasticity and promotes metastasis in pancreatic cancer. Nat Cell Biol 19, 518–529. [DOI] [PubMed] [Google Scholar]
- Kujawski M, Kortylewski M, Lee H, Herrmann A, Kay H and Yu H (2008) Stat3 mediates myeloid cell‐dependent tumor angiogenesis in mice. J Clin Invest 118, 3367–3377. [DOI] [PMC free article] [PubMed] [Google Scholar]
- Kumar V, Patel S, Tcyganov E and Gabrilovich DI (2016) The nature of myeloid‐derived suppressor cells in the tumor microenvironment. Trends Immunol 37, 208–220. [DOI] [PMC free article] [PubMed] [Google Scholar]
- Lamouille S, Xu J and Derynck R (2014) Molecular mechanisms of epithelial‐mesenchymal transition. Nat Rev Mol Cell Biol 15, 178–196. [DOI] [PMC free article] [PubMed] [Google Scholar]
- Lehmann W, Mossmann D, Kleemann J, Mock K, Meisinger C, Brummer T, Herr R, Brabletz S, Stemmler MP and Brabletz T (2016) ZEB1 turns into a transcriptional activator by interacting with YAP1 in aggressive cancer types. Nat Commun 7, 10498. [DOI] [PMC free article] [PubMed] [Google Scholar]
- Li H, Mar BG, Zhang H, Puram RV, Vazquez F, Weir BA, Hahn WC, Ebert B and Pellman D (2017) The EMT regulator ZEB2 is a novel dependency of human and murine acute myeloid leukemia. Blood 129, 497–508. [DOI] [PMC free article] [PubMed] [Google Scholar]
- Li Y, Wang L, Pappan L, Galliher‐Beckley A and Shi J (2012) IL‐1β promotes stemness and invasiveness of colon cancer cells through Zeb1 activation. Mol Cancer 11, 87. [DOI] [PMC free article] [PubMed] [Google Scholar]
- Liu H, Ren G, Wang T, Chen Y, Gong C, Bai Y, Wang B, Qi H, Shen J, Zhu L et al (2015) Aberrantly expressed Fra‐1 by IL‐6/STAT3 transactivation promotes colorectal cancer aggressiveness through epithelial‐mesenchymal transition. Carcinogenesis 36, 459–468. [DOI] [PMC free article] [PubMed] [Google Scholar]
- Markowitz J, Wesolowski R, Papenfuss T, Brooks TR and Carson WE 3rd (2013) Myeloid‐derived suppressor cells in breast cancer. Breast Cancer Res Treat 140, 13–21. [DOI] [PMC free article] [PubMed] [Google Scholar]
- Massague J (2012) TGFβ signalling in context. Nat Rev Mol Cell Biol 13, 616–630. [DOI] [PMC free article] [PubMed] [Google Scholar]
- Mejlvang J, Kriajevska M, Vandewalle C, Chernova T, Sayan AE, Berx G, Mellon JK and Tulchinsky E (2007) Direct repression of cyclin D1 by SIP1 attenuates cell cycle progression in cells undergoing an epithelial mesenchymal transition. Mol Biol Cell 18, 4615–4624. [DOI] [PMC free article] [PubMed] [Google Scholar]
- Miyazono K, Ehata S and Koinuma D (2012) Tumor‐promoting functions of transforming growth factor‐β in progression of cancer. Ups J Med Sci 117, 143–152. [DOI] [PMC free article] [PubMed] [Google Scholar]
- Mizutani A, Koinuma D, Seimiya H and Miyazono K (2016) The Arkadia‐ESRP2 axis suppresses tumor progression: analyses in clear‐cell renal cell carcinoma. Oncogene 35, 3514–3523. [DOI] [PMC free article] [PubMed] [Google Scholar]
- Morel AP, Ginestier C, Pommier RM, Cabaud O, Ruiz E, Wicinski J, Devouassoux‐Shisheboran M, Combaret V, Finetti P, Chassot C et al (2017) A stemness‐related ZEB1‐MSRB3 axis governs cellular pliancy and breast cancer genome stability. Nat Med 23, 568–578. [DOI] [PubMed] [Google Scholar]
- Murai F, Koinuma D, Shinozaki‐Ushiku A, Fukayama M, Miyaozono K and Ehata S (2015) EZH2 promotes progression of small cell lung cancer by suppressing the TGF‐β‐Smad‐ASCL1 pathway. Cell Discov 1, 15026. [DOI] [PMC free article] [PubMed] [Google Scholar]
- Nastasi C, Candela M, Bonefeld CM, Geisler C, Hansen M, Krejsgaard T, Biagi E, Andersen MH, Brigidi P, Odum N et al (2015) The effect of short‐chain fatty acids on human monocyte‐derived dendritic cells. Sci Rep 5, 16148. [DOI] [PMC free article] [PubMed] [Google Scholar]
- Neve RM, Chin K, Fridlyand J, Yeh J, Baehner FL, Fevr T, Clark L, Bayani N, Coppe JP, Tong F et al (2006) A collection of breast cancer cell lines for the study of functionally distinct cancer subtypes. Cancer Cell 10, 515–527. [DOI] [PMC free article] [PubMed] [Google Scholar]
- Nieto MA, Huang RY, Jackson RA and Thiery JP (2016) EMT: 2016. Cell 166, 21–45. [DOI] [PubMed] [Google Scholar]
- Ostuni R, Piccolo V, Barozzi I, Polletti S, Termanini A, Bonifacio S, Curina A, Prosperini E, Ghisletti S and Natoli G (2013) Latent enhancers activated by stimulation in differentiated cells. Cell 152, 157–171. [DOI] [PubMed] [Google Scholar]
- Pazmandi K, Kumar BV, Szabo K, Boldogh I, Szoor A, Vereb G, Veres A, Lanyi A, Rajnavolgyi E and Bacsi A (2012) Ragweed subpollen particles of respirable size activate human dendritic cells. PLoS One 7, e52085. [DOI] [PMC free article] [PubMed] [Google Scholar]
- Peinado H, Olmeda D and Cano A (2007) Snail, Zeb and bHLH factors in tumour progression: an alliance against the epithelial phenotype? Nat Rev Cancer 7, 415–428. [DOI] [PubMed] [Google Scholar]
- Perez‐Mancera PA, Young AR and Narita M (2014) Inside and out: the activities of senescence in cancer. Nat Rev Cancer 14, 547–558. [DOI] [PubMed] [Google Scholar]
- Postigo AA (2003) Opposing functions of ZEB proteins in the regulation of the TGF‐β/BMP signaling pathway. EMBO J 22, 2443–2452. [DOI] [PMC free article] [PubMed] [Google Scholar]
- Postigo AA and Dean DC (2000) Differential expression and function of members of the Zfh‐1 family of zinc finger/homeodomain repressors. Proc Natl Acad Sci USA 97, 6391–6396. [DOI] [PMC free article] [PubMed] [Google Scholar]
- Postigo AA, Depp JL, Taylor JJ and Kroll KL (2003) Regulation of Smad signaling through a differential recruitment of coactivators and corepressors by ZEB proteins. EMBO J 22, 2453–2462. [DOI] [PMC free article] [PubMed] [Google Scholar]
- Prislei S, Martinelli E, Zannoni GF, Petrillo M, Filippetti F, Mariani M, Mozzetti S, Raspaglio G, Scambia G and Ferlini C (2015) Role and prognostic significance of the epithelial‐mesenchymal transition factor ZEB2 in ovarian cancer. Oncotarget 6, 18966–18979. [DOI] [PMC free article] [PubMed] [Google Scholar]
- Sanchez‐Tillo E, Siles L, de Barrios O, Cuatrecasas M, Vaquero EC, Castells A and Postigo A (2011) Expanding roles of ZEB factors in tumorigenesis and tumor progression. Am J Cancer Res 1, 897–912. [PMC free article] [PubMed] [Google Scholar]
- Sandhu JK, Privora HF, Wenckebach G and Birnboim HC (2000) Neutrophils, nitric oxide synthase, and mutations in the mutatect murine tumor model. Am J Pathol 156, 509–518. [DOI] [PMC free article] [PubMed] [Google Scholar]
- Sansone P, Storci G, Tavolari S, Guarnieri T, Giovannini C, Taffurelli M, Ceccarelli C, Santini D, Paterini P, Marcu KB et al (2007) IL‐6 triggers malignant features in mammospheres from human ductal breast carcinoma and normal mammary gland. J Clin Invest 117, 3988–4002. [DOI] [PMC free article] [PubMed] [Google Scholar]
- Sarrio D, Rodriguez‐Pinilla SM, Hardisson D, Cano A, Moreno‐Bueno G and Palacios J (2008) Epithelial‐mesenchymal transition in breast cancer relates to the basal‐like phenotype. Cancer Res 68, 989–997. [DOI] [PubMed] [Google Scholar]
- Shirakihara T, Saitoh M and Miyazono K (2007) Differential regulation of epithelial and mesenchymal markers by δEF1 proteins in epithelial mesenchymal transition induced by TGF‐β. Mol Biol Cell 18, 3533–3544. [DOI] [PMC free article] [PubMed] [Google Scholar]
- Si W, Huang W, Zheng Y, Yang Y, Liu X, Shan L, Zhou X, Wang Y, Su D, Gao J et al (2015) Dysfunction of the reciprocal feedback loop between GATA3‐ and ZEB2‐nucleated repression programs contributes to breast cancer metastasis. Cancer Cell 27, 822–836. [DOI] [PubMed] [Google Scholar]
- Smith C, Chang MY, Parker KH, Beury DW, DuHadaway JB, Flick HE, Boulden J, Sutanto‐Ward E, Soler AP, Laury‐Kleintop LD et al (2012) IDO is a nodal pathogenic driver of lung cancer and metastasis development. Cancer Discov 2, 722–735. [DOI] [PMC free article] [PubMed] [Google Scholar]
- Spaderna S, Schmalhofer O, Wahlbuhl M, Dimmler A, Bauer K, Sultan A, Hlubek F, Jung A, Strand D, Eger A et al (2008) The transcriptional repressor ZEB1 promotes metastasis and loss of cell polarity in cancer. Cancer Res 68, 537–544. [DOI] [PubMed] [Google Scholar]
- Suarez‐Carmona M, Bourcy M, Lesage J, Leroi N, Syne L, Blacher S, Hubert P, Erpicum C, Foidart JM, Delvenne P et al (2015) Soluble factors regulated by epithelial‐mesenchymal transition mediate tumour angiogenesis and myeloid cell recruitment. J Pathol 236, 491–504. [DOI] [PubMed] [Google Scholar]
- Talmadge JE and Gabrilovich DI (2013) History of myeloid‐derived suppressor cells. Nat Rev Cancer 13, 739–752. [DOI] [PMC free article] [PubMed] [Google Scholar]
- The ENCODE Project Consortium (2012) An integrated encyclopedia of DNA elements in the human genome. Nature 489, 57–74. [DOI] [PMC free article] [PubMed] [Google Scholar]
- Thiery JP, Acloque H, Huang RY and Nieto MA (2009) Epithelial‐mesenchymal transitions in development and disease. Cell 139, 871–890. [DOI] [PubMed] [Google Scholar]
- Toh B, Wang X, Keeble J, Sim WJ, Khoo K, Wong WC, Kato M, Prevost‐Blondel A, Thiery JP and Abastado JP (2011) Mesenchymal transition and dissemination of cancer cells is driven by myeloid‐derived suppressor cells infiltrating the primary tumor. PLoS Biol 9, e1001162. [DOI] [PMC free article] [PubMed] [Google Scholar]
- Ugel S, De Sanctis F, Mandruzzato S and Bronte V (2015) Tumor‐induced myeloid deviation: when myeloid‐derived suppressor cells meet tumor‐associated macrophages. J Clin Invest 125, 3365–3376. [DOI] [PMC free article] [PubMed] [Google Scholar]
- Vandewalle C, Comijn J, De Craene B, Vermassen P, Bruyneel E, Andersen H, Tulchinsky E, Van Roy F and Berx G (2005) SIP1/ZEB2 induces EMT by repressing genes of different epithelial cell‐cell junctions. Nucleic Acids Res 33, 6566–6578. [DOI] [PMC free article] [PubMed] [Google Scholar]
- Verschueren K, Remacle JE, Collart C, Kraft H, Baker BS, Tylzanowski P, Nelles L, Wuytens G, Su MT, Bodmer R et al (1999) SIP1, a novel zinc finger/homeodomain repressor, interacts with Smad proteins and binds to 5′‐CACCT sequences in candidate target genes. J Biol Chem 274, 20489–20498. [DOI] [PubMed] [Google Scholar]
- Wakamatsu N, Yamada Y, Yamada K, Ono T, Nomura N, Taniguchi H, Kitoh H, Mutoh N, Yamanaka T, Mushiake K et al (2001) Mutations in SIP1, encoding Smad interacting protein‐1, cause a form of Hirschsprung disease. Nat Genet 27, 369–370. [DOI] [PubMed] [Google Scholar]
- Xin H, Zhang C, Herrmann A, Du Y, Figlin R and Yu H (2009) Sunitinib inhibition of Stat3 induces renal cell carcinoma tumor cell apoptosis and reduces immunosuppressive cells. Cancer Res 69, 2506–2513. [DOI] [PMC free article] [PubMed] [Google Scholar]
- Xing F, Saidou J and Watabe K (2010) Cancer associated fibroblasts (CAFs) in tumor microenvironment. Front Biosci (Landmark Ed) 15, 166–179. [DOI] [PMC free article] [PubMed] [Google Scholar]
- Xu J, Lamouille S and Derynck R (2009) TGF‐β‐induced epithelial to mesenchymal transition. Cell Res 19, 156–172. [DOI] [PMC free article] [PubMed] [Google Scholar]
- Yamaji H, Iizasa T, Koh E, Suzuki M, Otsuji M, Chang H, Motohashi S, Yokoi S, Hiroshima K, Tagawa M et al (2004) Correlation between interleukin 6 production and tumor proliferation in non‐small cell lung cancer. Cancer Immunol Immunother 53, 786–792. [DOI] [PMC free article] [PubMed] [Google Scholar]
- Yang L, Huang J, Ren X, Gorska AE, Chytil A, Aakre M, Carbone DP, Matrisian LM, Richmond A, Lin PC et al (2008) Abrogation of TGF‐β signaling in mammary carcinomas recruits Gr‐1+CD11b+ myeloid cells that promote metastasis. Cancer Cell 13, 23–35. [DOI] [PMC free article] [PubMed] [Google Scholar]
- Ye X, Tam WL, Shibue T, Kaygusuz Y, Reinhardt F, Ng Eaton E and Weinberg RA (2015) Distinct EMT programs control normal mammary stem cells and tumour‐initiating cells. Nature 525, 256–260. [DOI] [PMC free article] [PubMed] [Google Scholar]
- Ye X and Weinberg RA (2015) Epithelial‐mesenchymal plasticity: a central regulator of cancer progression. Trends Cell Biol 25, 675–686. [DOI] [PMC free article] [PubMed] [Google Scholar]
- Zhang Y, Liu T, Meyer CA, Eeckhoute J, Johnson DS, Bernstein BE, Nusbaum C, Myers RM, Brown M, Li W et al (2008) Model‐based analysis of ChIP‐Seq (MACS). Genome Biol 9, R137. [DOI] [PMC free article] [PubMed] [Google Scholar]
- Zhang P, Sun Y and Ma L (2015) ZEB1: at the crossroads of epithelial‐mesenchymal transition, metastasis and therapy resistance. Cell Cycle 14, 481–487. [DOI] [PMC free article] [PubMed] [Google Scholar]
- Zheng X, Carstens JL, Kim J, Scheible M, Kaye J, Sugimoto H, Wu CC, LeBleu VS and Kalluri R (2015) Epithelial‐to‐mesenchymal transition is dispensable for metastasis but induces chemoresistance in pancreatic cancer. Nature 527, 525–530. [DOI] [PMC free article] [PubMed] [Google Scholar]
Associated Data
This section collects any data citations, data availability statements, or supplementary materials included in this article.
Supplementary Materials
Fig. S1. Specificity of ZEB1 and ZEB2 antibodies and the result of GSEA analysis showing the effect of ZEB1 or ZEB2 siRNA in MDA‐231‐D cells.
Fig. S2. The effect of ZEB1/2 siRNA on the expression of inflammatory response genes.
Fig. S3. Tissue array analysis of ZEB1 and IL‐6 expression using fluorescent immunohistochemistry.
Fig. S4. Efficiency of IL6 siRNA and the amount of ZEB1 protein in 4T1 breast cancer cells.
Table S1. Sequences of the primers used for RT‐PCR.
Table S2. A list of ZEB1‐bound inflammatory response genes.
Data Availability Statement
The raw ChIP‐seq and RNA‐seq data are available at GEO (GSE89206).