

Abstract
Mechanical tensions are usually generated during development at spatially defined regions within tissues. Such physical cues dictate the cellular decisions of proliferation or cell cycle arrest. Yet, the mechanisms by which mechanical stress controls the cell cycle are not yet fully understood. Here, we report that mechanical cues function upstream of Skp2 transcription in human breast cancer cells. We found that YAP, the mechano‐responsive oncogenic Hippo signaling effector, directly promotes Skp2 transcription. YAP inactivation induces cell cycle exit (G0) by down‐regulating Skp2, causing p21/p27 to accumulate. Both Skp2 reconstitution and p21/p27 depletion can rescue the observed defect in cell cycle progression. In the context of a tissue‐mimicking 3D culture system, Skp2 inactivation effectively suppresses YAP‐driven oncogenesis and aberrant stiff 3D matrix‐evoked epithelial tissue behaviors. Finally, we also found that the expression of Skp2 and YAP is positively correlated in breast cancer patients. Our results not only reveal the molecular mechanism by which mechanical cues induce Skp2 transcription, but also uncover a role for YAP‐Skp2 oncogenic signaling in the relationship between tissue rigidity and cancer progression.
Keywords: cancer, cell cycle, mechanical cue, Skp2, YAP
Subject Categories: Cancer, Cell Cycle, Signal Transduction
Introduction
Extracellular matrix (ECM) stiffening, an important diagnostic hallmark of cancer, enhances cell proliferation and disrupts tissue morphology by increasing cellular tension (Levental et al, 2009). As a self‐defense mechanism that suppresses cancer, suspended cells that have detached from their ECM usually undergo cell cycle arrest (Guadamillas et al, 2011). Still, the mechanisms by which such mechanical forces ultimately affect the cell cycle machinery remain unknown. Recent studies implicate YAP (Yes‐associated protein)—the downstream effector of Hippo signaling—as a mechano‐responsive transcriptional co‐activator (Dupont et al, 2011). YAP activation is widespread in many human cancers (Zanconato et al, 2016) where it promotes cell proliferation and survival via its interactions with key transcription factors, particularly TEAD (Moroishi et al, 2015). Although YAP has been suggested as the mediator that links mechanical cues and cell proliferation, the molecular targets downstream of YAP that are directly involved in regulating the cell cycle machinery are poorly understood.
Skp2 is an F‐box protein of the SCF E3 ubiquitin ligase complex that is important in cell cycle progression. Elevated Skp2 expression is associated with several human cancers (Frescas & Pagano, 2008). Some studies have suggested Skp2 protein stabilization as the mechanism underlying the elevated Skp2 levels observed in some tumors (Gao et al, 2009; Inuzuka et al, 2012). One study even found oncogenic PI3K/Akt signaling impairs APC/Cdh1‐mediated Skp2 degradation (Gao et al, 2009). These studies, however, relied primarily on immunohistochemistry (IHC) and were unable to provide clinical evidence proving the up‐regulation of Skp2 protein in human cancers should be attributed to increased Skp2 stability (Gstaiger et al, 2001; Hershko et al, 2001; Yang et al, 2002; Slotky et al, 2005). Other clinical studies found elevated Skp2 mRNA and protein levels correlate significantly with poor patient prognoses (Masuda et al, 2002; Signoretti et al, 2002; Yokoi et al, 2004; Takanami, 2005; Sonoda et al, 2006; Hershko, 2008). In addition, Skp2 mRNA down‐regulation is induced by cellular ECM detachment (Carrano & Pagano, 2001) via an unknown mechanism. Thus, we sought to understand how Skp2 mRNA expression becomes dysregulated in human cancers, expecting this knowledge will contribute to future Skp2‐associated tumor treatments.
Results
Mechanical stress and YAP regulate Skp2 expression
Cellular detachment from the ECM reduces Skp2 transcription (Carrano & Pagano, 2001), but it is unclear how this happens. We first used qPCR to confirm that cellular suspension does indeed down‐regulate Skp2 mRNA expression (Fig 1A). Since ECM adhesions are coupled with the intracellular actin cytoskeleton (Jaalouk & Lammerding, 2009), ECM detachment induces changes in cell shape, the actin cytoskeleton itself, and in the tensile actomyosin structure (Meng et al, 2016). We, therefore, asked whether mechanical stimuli (Dupont et al, 2011) other than ECM detachment can regulate Skp2 transcription. To answer this question, we cultured cells to a dense monolayer (Fig 1B), in a soft ECM substrate (Fig 1C), or in the presence of inhibitors of the actin cytoskeleton (Lat. B) or actomyosin tension (Y27632; Fig 1D). We found cellular suspension as well as all the other low mechanical stimuli we tested reduce Skp2 mRNA levels. These data suggest mechanical cues function as bona fide upstream regulators of Skp2 transcription.
Figure 1. Mechanical stress and YAP regulate Skp2 expression.
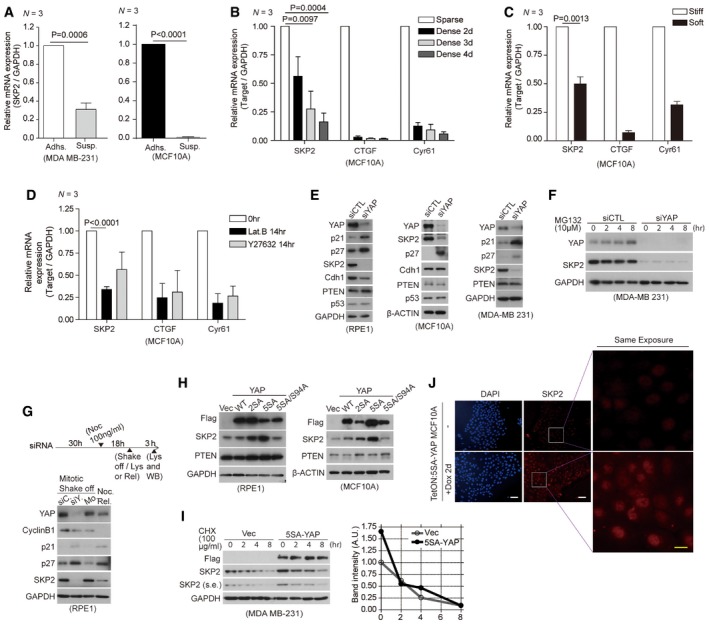
- Relative levels of Skp2 mRNA in MDA‐MB‐231 and MCF10A cells either adherent (Adh.) or suspended (Susp.) for 17 h in poly‐HEMA‐coated dishes as measured by qPCR (N = 3).
- Relative mRNA levels for the indicated genes in MCF10A cells seeded first as sparse (6 × 10³/cm2) or dense (2 × 10⁵/cm2) monolayers. Each density was then harvested after 2, 3, and 4 days for analysis by qPCR. CTGF and Cyr61 were used as positive controls that respond to mechanical cues (N = 3).
- Relative mRNA levels for the indicated genes in MCF10A cells grown on stiff (fibronectin‐coated plastic) or soft (acrylamide hydrogels of 0.7 kPa) substrates for 2 days, as measured by qPCR (N = 3).
- Relative mRNA levels for the indicated genes, as measured by qPCR, in MCF10A cells treated for 14 h with or without Lat. B (5 μM) or Y27632 (40 μM; N = 3).
- Immunoblots of RPE1, MCF10A, and MDA‐MB‐231 cells transfected with control siRNAs (siCTL) or YAP‐specific siRNAs (siYAP).
- Immunoblots with the indicated antibodies. At the indicated time points, whole‐cell lysates were taken from MDA‐MB‐231 cells transfected with the indicated siRNAs and treated with MG132 (10 μM).
- YAP depletion reduces Skp2 expression irrespective of cell cycle phase. (Above) Experimental protocol schematic. (Below) Immunoblots of cells treated with 100 ng/ml nocodazole (Noc) 30 h after siRNA transfection (siC: siControl, siY: siYAP) to arrest them in mitosis. Mitotic cells were then collected via a mechanical shake‐off. As a control, non‐transfected mitotic mock (Mo) cells were washed with PBS several times and released into early G1 (Noc. Rel.).
- Immunoblots of RPE1 and MCF10A cells expressing vector (Vec) or the indicated YAP mutants.
- (Left) Immunoblots of MDA‐MB‐231 cells stably expressing vector or active 5SA‐YAP that were incubated with cyclohexamide (CHX, 100 μg/ml) for the indicated times. (Right) Relative Skp2 immunoblot band intensity normalized to GAPDH.
- Skp2 staining of drug‐inducible 5SA‐YAP‐expressing MCF10A cells (Tet‐ON: 5SA‐YAP) in the absence or presence of doxycycline for 2 days. DAPI was used as a nuclear counterstain. Note that YAP activation increases Skp2 staining in individual nuclei. Scale bars: white (50 μm), yellow (20 μm).
How does mechanical tension affect Skp2 expression? Because YAP has recently emerged as a mechanotransducer (Halder et al, 2012), we speculated it may be involved. Indeed, we found YAP depletion via short interfering RNAs (siRNAs) markedly reduces Skp2 protein levels and induces the known Skp2 targets p21 and p27 (Frescas & Pagano, 2008; Fig 1E). YAP inactivation does not induce p53, however, indicating the induction of p21 is not occurring because of p53 activation (Fig 1E, left). PTEN down‐regulates Skp2 protein stability, at least in part, through Akt1. Akt1 impairs APC/Cdh1‐mediated Skp2 destruction (Gao et al, 2009). YAP is also known to suppress PTEN through miR‐29 (Tumaneng et al, 2012). In our hands, however, YAP inactivation does not increase the levels of either Cdh1 or PTEN (Fig 1E). By treating YAP‐depleted cells with the proteasome inhibitor MG132, we found the Skp2 protein reduction we observed is unlikely due to protein degradation (Figs 1F and EV1A).
Figure EV1. YAP and TEAD directly promote Skp2 transcription in response to mechanical cues.
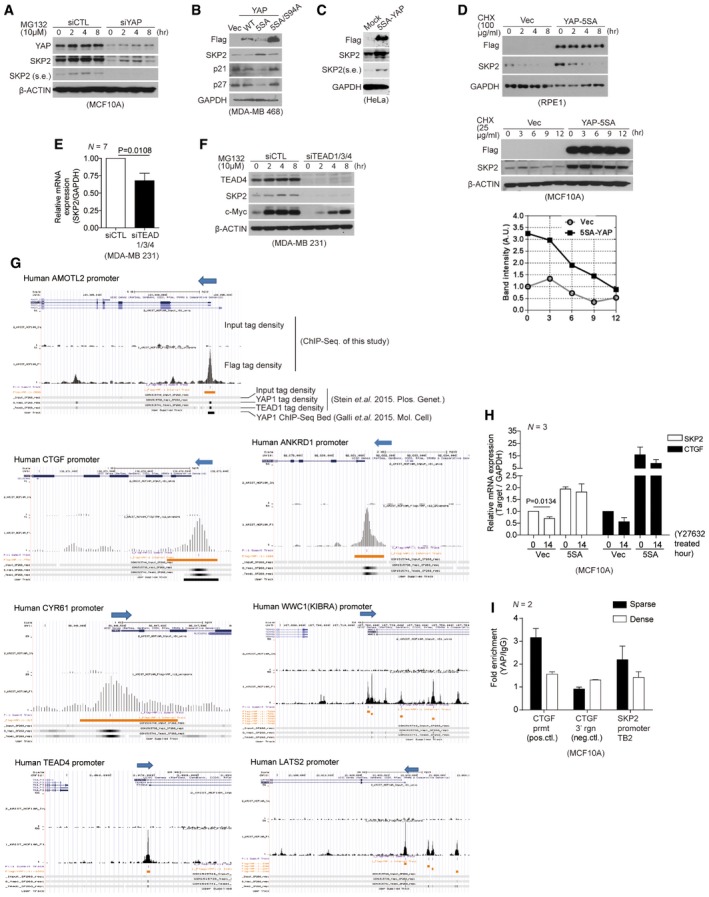
- Immunoblots with the indicated antibodies. At the indicated time points, whole‐cell lysates were taken from MCF10A cells transfected with the indicated siRNAs and treated with MG132 (10 μM).
- Immunoblots of MDA‐MB‐468 cells infected with retroviruses encoding an empty vector (Vec) or the indicated YAP mutant clones.
- Immunoblots of HeLa cells transduced with flag 5SA‐YAP via retroviral infection.
- Immunoblots of RPE1 (above) or MCF10A cells (below) stably expressing vector or 5SA‐YAP and incubated with cyclohexamide (CHX) for the indicated times. Relative Skp2 immunoblot band intensity normalized to β‐actin is also shown for MCF10A cells.
- Relative mRNA levels of the indicated genes, as determined by qPCR, from MDA‐MB‐231 cells transfected with control siRNAs or TEAD1/3/4‐specific siRNAs. Data were collected from seven independent experiments (N = 7).
- MDA‐MB‐231 cells were transfected with control siRNAs or TEAD1/3/4‐specific siRNAs. After 48 h, the cells were treated with MG132 (10 μM). Shown are immunoblots from whole‐cell lysates prepared at the indicated times with the indicated antibodies.
- Relative Skp2 and CTGF mRNA levels, as measured by qPCR, in MCF10A cells stably expressing vector or 5SA‐YAP and treated with Y27632 (20 μM, 14 h) or not (N = 3).
- Enrichment of endogenous YAP at TB2 in the Skp2 promoter in MCF10A cells cultured as sparse or highly dense monolayers, as determined by ChIP‐qPCR. The CTGF promoter (prmt) and the genomic region 3′ of the CTGF gene were used as positive (pos.ctl) and negative controls (neg.ctl), respectively (N = 2).
The level of Skp2 protein oscillates throughout the cell cycle, with Skp2 being degraded in early G1. Since it is possible the reduction in Skp2 induced by YAP depletion is secondary to an enrichment of cells in G0/G1 (refer to Fig 3A), we collected mitotic cells via a timely nocodazole treatment and mitotic shake‐off. We used cyclin B1 to mark cells in the mitotic phase. We found mitotic YAP‐depleted cells show a similar decrease in Skp2 and increase in p21 and p27 as early G1 cells (Noc. Rel; Figs 1G and 7D, left). This indicates the reduction in Skp2 protein observed with YAP depletion is not caused by a shift in the cells toward early G1 phase.
Figure 3. Skp2 is a gatekeeper for YAP depletion‐induced cell cycle exit.
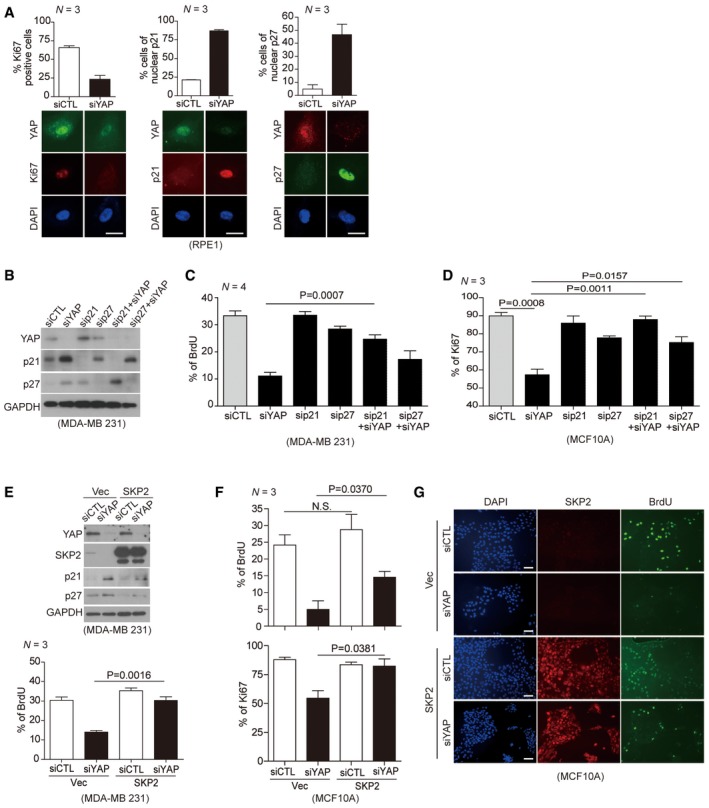
- (Above) Quantification of Ki67‐, p21‐, or p27‐positive cells among control and YAP‐depleted cells. > 150 cells were analyzed for each of three independent experiments. (Below) Representative immunofluorescence images of RPE1 cells transfected with control siRNAs or YAP‐specific siRNAs and stained with the indicated antibodies. DAPI was used as a nuclear counterstain. Scale bars: 20 μm.
- Immunoblots of MDA‐MB‐231 cells transfected with the indicated siRNAs.
- BrdU incorporation assays (1 h) on cells prepared as in (B). BrdU status was determined via immunofluorescence with a BrdU‐specific antibody and DAPI staining. > 600 cells were analyzed for each of four independent experiments.
- MCF10A cells prepared as in (B). Ki67‐positive cells were quantified by immunofluorescence with a Ki67‐specific antibody and DAPI staining. > 500 cells were analyzed in each of three independent experiments.
- (Above) Immunoblots of whole‐cell lysates from MDA‐MB‐231 cells 2 days after transduction with either vector or Skp2 lentiviruses and then transfection with either control siRNAs or YAP‐specific siRNAs. (Below) BrdU incorporation assays (1 h) on cells prepared as described above. > 600 cells were analyzed for each of three independent experiments.
- MCF10A cells expressing either vector or Skp2 were transfected with the indicated siRNAs. After 1 h of BrdU incorporation, BrdU‐ and Ki67‐specific antibodies were used to quantify BrdU‐ or Ki67‐positive cells. > 400 cells were analyzed for each of three independent experiments.
- Representative images for (F). Scale bars: 50 μm.
Next, we found over‐expression of activated 2SA‐ or 5SA‐YAP (Zhao et al, 2007) up‐regulates Skp2 but not PTEN protein levels (Fig 1H). We obtained a similar result with MDA‐MB‐468, HeLa, MCF10A, HepG2, and MDA‐MB‐231 cells (Figs EV1B and C, 5A and 7A). It is unclear why, but we did not observe any increase in Skp2 upon YAP activation in either HEK293 or HEK293T kidney cells (data not shown). We next found the half‐life of Skp2 protein in cells over‐expressing active 5SA‐YAP is similar to that in cells expressing a vector control (Figs 1I and EV1D). Moreover, by visualizing Skp2 in doxycycline‐inducible 5SA‐YAP cells (Tet‐ON:5SA‐YAP MCF10A), we found increases in nuclear Skp2 protein (Fig 1J). This ruled out the hypothesis that YAP‐dependent regulation of Skp2 is an indirect consequence of cell cycle phase.
YAP and TEAD directly control mechanical cue‐dependent Skp2 transcription
We next asked whether YAP directly regulates Skp2 transcription. YAP depletion markedly down‐regulates Skp2 but does not affect p21 and p27 mRNA levels (Fig 2A). Conversely, YAP activation increases Skp2 transcription (Fig 2B). TEAD depletion also decreases both Skp2 mRNA and protein levels (Figs 2C and EV1E) without affecting Skp2 protein stability (Fig EV1F). Expression of the TEAD binding‐deficient 5SA/94A‐YAP mutant, however, does not increase Skp2 expression (Fig 1H).
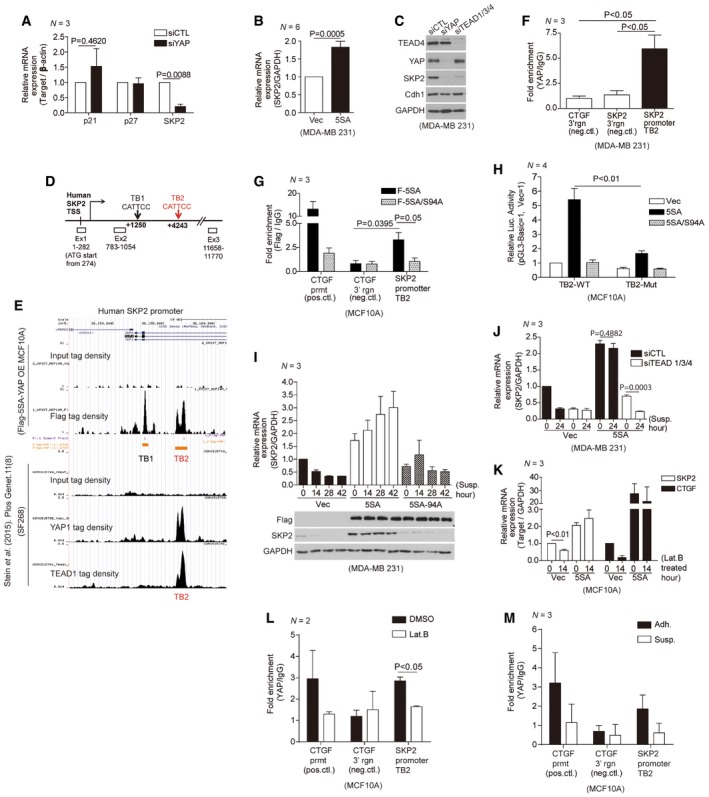
Figure 2. YAP and TEAD directly control mechanical cue‐dependent Skp2 transcription.
-
ARelative mRNA levels for the indicated genes in MDA‐MB‐231 cells transfected with either control siRNAs or YAP‐specific siRNAs, as measured by qPCR (N = 3).
-
BRelative Skp2 mRNA expression in MDA‐MB‐231 cells transduced with vector or 5SA‐YAP retroviruses (N = 6).
-
CImmunoblots of MDA‐MB‐231 cells transfected with the indicated siRNAs.
-
DSchematic depicting the human Skp2 promoter, which contains two TEAD‐binding motifs (TB1, TB2). White boxes indicate exons (Ex).
-
EChIP‐seq of the human Skp2 promoter. (Above) ChIP‐seq using a Flag‐specific antibody on Flag‐5SA‐YAP‐expressing MCF10A cells. Flag‐5SA‐YAP binds to TB1 and TB2 in the Skp2 promoter. (Below) ChIP‐seq using YAP‐ or TEAD1‐specific antibodies on the SF268 human glioblastoma cell line (Stein et al, 2015). Endogenous YAP and TEAD1 bind TB2 in the Skp2 promoter.
-
FEnrichment of endogenous YAP at TB2 in the Skp2 promoter, as determined by ChIP‐qPCR. The genomic region 3′ of the CTGF or Skp2 genes were used as negative controls (neg. ctl; N = 3).
-
GEnrichment of Flag‐tagged 5SA‐YAP or 5SA/94A‐YAP at TB2 in the Skp2 promoter, as determined by ChIP‐qPCR. The CTGF promoter (prmt) and the genomic region 3′ of the CTGF gene were used as positive (pos.ctl) and negative controls (neg.ctl), respectively (N = 3).
-
HLuciferase reporter assays with a wild‐type TB2 sequence‐containing Skp2 promoter (TB2‐WT) or a mutant TB2‐containing promoter (CATTCC‐>AGAAAA; TB2‐Mut) in MCF10A cells stably expressing vector, 5SA‐YAP, or 5SA/94A‐YAP (N = 4).
-
IMDA‐MB‐231 cells were transduced with the indicated retroviruses and suspended on poly‐HEMA‐coated dishes. Then, qPCR (above, N = 3) or immunoblotting (below) was performed at the indicated times.
-
JMDA‐MB‐231 cells expressing vector or 5SA‐YAP were transfected with either control siRNAs or TEAD1/3/4‐specific siRNAs. After 2 days, the cells were suspended for the indicated times and harvested for qPCR analyses (N = 3).
-
KRelative Skp2 and CTGF mRNA levels, as measured by qPCR, in MCF10A cells transduced with either vector or 5SA‐YAP retroviruses and then either non‐treated or treated with 5 μM Lat. B for 14 h (N = 3).
-
L, MEnrichment of endogenous YAP at TB2 in the Skp2 promoter in MCF10A cells treated with either DMSO or Lat. B for 14 h (L) or suspended for 2 h (M), as determined by ChIP‐qPCR. The CTGF promoter (prmt) and the genomic region 3′ of the CTGF gene were used as positive (pos.ctl) and negative controls (neg.ctl), respectively.
The human Skp2 promoter contains two TEAD‐binding consensus sites (TB1 and TB2) downstream of the transcription start site (TSS; Fig 2D). We, therefore, postulated YAP‐TEAD binds directly to the Skp2 promoter, activating its transcription. ChIP‐seq analyses performed independently by us and by another group (Stein et al, 2015) revealed that YAP and TEAD bind together to the Skp2 promoter at TB2 (Fig 2E) as well as to other known YAP target promoters (Fig EV1G; Stein et al, 2015; Zanconato et al, 2015). Using ChIP‐qPCR, we confirmed the binding of endogenous YAP to the Skp2 promoter's TB2 site (Fig 2F). Consistent with the requirement of TEAD for Skp2 expression, we observed enrichment of 5SA‐YAP but not 5SA/94A‐YAP at the TB2 site (Fig 2G). We also used a Skp2 reporter assay to confirm that 5SA‐YAP, but not 5SA/94A‐YAP, activates a TB2 wild‐type reporter (TB2‐WT). 5SA‐YAP does not, however, activate a TB2 mutant reporter (TB2‐Mut; Fig 2H). Together, these results led us to conclude YAP directly controls Skp2 transcription via TEAD.
We next returned to our original question of whether YAP represents the link between mechanical stress and Skp2 transcription (Fig 1). According to previous reports, over‐expressed 5SA‐YAP but not wild‐type YAP remains within the nucleus, retaining its transcriptional activity even under low mechanical tension (Zhao et al, 2007, 2012; Yu et al, 2015). We found cells over‐expressing 5SA‐YAP but not 5SA/94A‐YAP or vector control are refractory to the down‐regulation of Skp2 mRNA that normally occurs upon cellular suspension (Fig 2I). Furthermore, TEAD depletion blunts the increase of Skp2 mRNA observed in 5SA‐YAP‐expressing cells upon cellular suspension (Fig 2J). Cells expressing 5SA‐YAP are also refractory to the down‐regulation of Skp2 mRNA that normally occurs upon inhibition of either the actin cytoskeleton or actomyosin tension (Figs 2K and EV1H). Finally, using ChIP‐qPCR, we confirmed a reduction of endogenous YAP binding to the TB2 site in the Skp2 promoter in response to various mechanical stresses (Figs 2L and M, and EV1I). Collectively, these results suggest YAP and TEAD mediate the mechanical cue‐dependent regulation of Skp2 transcription.
Skp2 is a gatekeeper for YAP depletion‐induced cell cycle exit
Having established YAP as an upstream regulator of Skp2 expression, we next explored the functions of Skp2 that are affected by YAP. YAP inactivation reportedly triggers cell cycle arrest (Fan et al, 2013; Zanconato et al, 2015). We confirmed YAP depletion forces cells to exit the cell cycle at G0, as reflected by the loss of Ki67 (Fig 3A, left). The same G0 cells also show an increase in nuclear p21 and p27 (Fig 3A, middle & right). We then asked whether Skp2 and its substrates p21 and p27 are responsible for the YAP depletion‐induced exit from the cell cycle. First, we knocked down p21 or p27 in combination with YAP depletion (Fig 3B). The triple knockdown (i.e., p21, p27, and YAP depletion) was toxic, inducing too much cell death (data not shown). Using bromodeoxyuridine (BrdU) incorporation, we found each double knockdown was sufficient to rescue cell cycle progression (Fig 3C and D). Importantly, this is reminiscent of the in vivo phenotype induced by the Skp2 and p27 double mutant with respect to cell proliferation (Kossatz et al, 2004). Next, we found Skp2 over‐expression suppresses the p21 and p27 induction (Fig 3E, above) and cell cycle exit induced by YAP depletion (Fig 3E, below and Fig 3F and G). Together, these results indicate Skp2 and its substrates p21 and p27 are gatekeepers of the cell cycle exit induced by YAP depletion.
In a 2D culture system, Skp2 inhibition does not effectively suppress YAP‐driven cell proliferation or cell cycle reentry
For insight into the role of Skp2 in human cancers expressing activated YAP, we first monitored the proliferation of cells over‐expressing YAP. Interestingly, cells expressing 5SA‐YAP continue to proliferate cell‐autonomously even in serum‐starved conditions (Fig 4A and B). Using short hairpin RNAs (shRNAs) or the CRISPR/Cas9 knockout system, we found Skp2 inhibition does not effectively suppress this YAP‐driven proliferation in serum‐starved 2D culture (Figs 4C and D, and EV2A and B). Similarly, although 5SA‐YAP expression can prevent cytokinesis failure‐induced cell cycle arrest, it does not require Skp2 (Fig 4E). YAP is a master regulator of cell cycle reentry (Benham‐Pyle et al, 2015), but we found Skp2 is not involved in YAP‐dependent cell cycle reentry (Fig EV2C–F). These results suggest, at least in these 2D culture conditions, that although Skp2 over‐expression is sufficient to bypass the cell cycle exit induced by serum starvation (Sutterluty et al, 1999; Fig EV2G), YAP hyperactivation overcomes this bypass and induces cell cycle reentry by an unidentified mechanism.
Figure 4. In a 2D culture system, Skp2 inhibition does not effectively suppress YAP‐driven cell proliferation or cell cycle reentry.
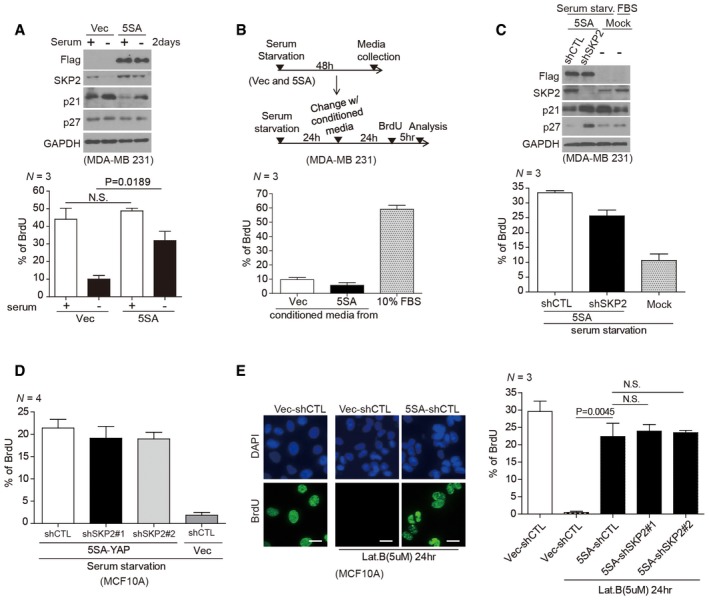
- (Above) Immunoblots of MDA‐MB‐231 cells stably expressing vector or 5SA‐YAP and either serum‐starved or not. (Below) Identical plates of cells were incorporated with BrdU for 5 h, fixed, and stained with a BrdU‐specific antibody. > 1,500 cells were analyzed in each of three independent experiments.
- (Above) Schematic depicting the treatment regimens for the experiment below. (Below) Serum‐starved cells were incubated in either the indicated conditioned media or standard media containing 10% FBS for 1 day. BrdU‐positive cells were counted as described in (A). > 500 cells were analyzed in each of three independent experiments.
- (Above) MDA‐MB‐231 cells expressing 5SA‐YAP and either control shRNAs (shCTL) or Skp2‐specific shRNAs (shSkp2) were serum‐starved for 2 days. (Below) BrdU‐positive cells were then counted as described in (A). Mock indicates non‐transduced cells. > 1,500 cells were analyzed in each of three independent experiments.
- MCF10A cells stably expressing 5SA‐YAP and either control shRNAs (shCTL) or Skp2‐specific shRNAs (shSkp2 #1, #2) were analyzed as in (C). > 500 cells were analyzed in each of four independent experiments.
- MCF10A cells as in (D) were treated with Lat. B (5 μM) to trigger cytokinesis failure‐induced exit from the cell cycle. After 24 h, the cells were labeled with BrdU for 1 h. (Left) Representative images showing the continued proliferation of active YAP‐expressing cells even after cytokinesis failure (tetraploidy). Scale bars: 20 μm. (right) BrdU‐positive cell quantification. > 500 cells were analyzed in each of three independent experiments.
Figure EV2. Inactivation of Skp2 does not effectively suppress YAP‐driven cell cycle control in a 2D culture system.
- Using the CRISPR‐Cas9 system, we generated control or Skp2 knockout MCF10A clones. These were further manipulated to generate the doxycycline‐inducible 5SA‐YAP expression system (Tet‐ON: 5SA‐YAP). Immunoblots confirmed both the Skp2 knockout and the function of the inducible 5SA‐YAP expression system.
- (Above) Experimental protocol schematic. (Below) Cells prepared as in (A) were treated with or without doxycycline for 2 days. Then, cells were either serum‐starved or not in the absence or presence of 2 days of doxycycline. After 1 h of BrdU incorporation, the BrdU‐positive cells were counted. > 500 cells were analyzed in each of three independent experiments.
- (Above) Experimental protocol schematic. Doxycycline‐inducible 5SA‐YAP‐expressing MCF10A cells were either serum‐starved or not. After 2 days, some cells were fixed and others were treated with doxycycline. After an additional 2 days, the cells were fixed and stained with a Ki67‐specific antibody and DAPI.
- Immunoblots of cells treated as in (C).
- Quantification of Ki67 positivity among cells treated as in (C). > 300 cells were analyzed for each of two independent experiments.
- Doxycycline‐inducible 5SA‐YAP‐expressing MDA‐MB‐231 cells treated as in (C) except for an additional 1 h of BrdU incorporation. > 300 cells were analyzed for each of two independent experiments.
- MCF10A cells were infected with lentiviruses encoding either vector or Skp2. The cells were then serum‐starved for 2 days to induce cell cycle exit. After 1 h BrdU incorporation, the cells were fixed and stained with BrdU‐ or Ki67‐specific antibodies. (Left) Representative cells stained for BrdU and counterstained with DAPI. Scale bars: 50 μm. (Right) Quantification of BrdU‐ or Ki67‐positive cells. > 800 cells were analyzed in each of three independent experiments.
- RPE1 cells were treated with DMSO or SZL P1‐41. After 48 h, cells were fixed and stained with a p27‐specific antibody and DAPI. Scale bars: 20 μm.
- (Left) Experimental protocol schematic. Doxycycline‐inducible 5SA‐YAP‐expressing cells were grown on 3D Matrigel for acinus formation. After arresting acinar growth 8 days later, one group was fixed and the other two were treated with or without doxycycline for 3 days before also being fixed. (Right) All fixed samples were visualized and quantified using phase contrast microscopy and the ImageJ program. Orange bars indicate the median. > 200 acini were analyzed for each of two independent experiments.
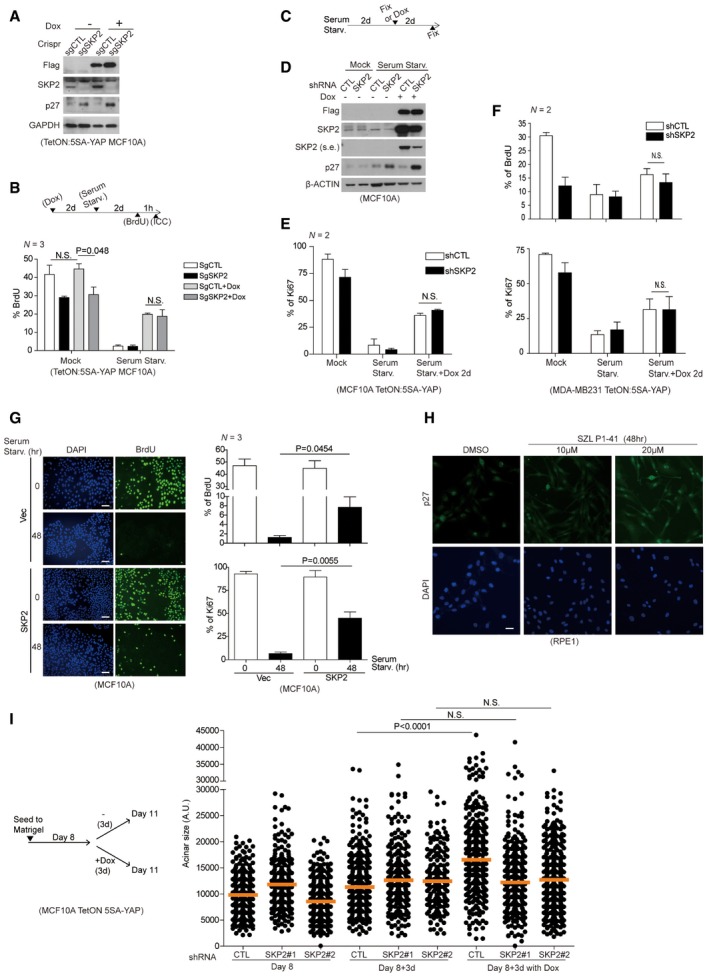
Skp2 depletion represses the formation of YAP‐driven tumor spheroid‐like acini and aberrant epithelial tissue behaviors in a 3D stiff matrix
Certain cellular phenotypes are altered when the same cells are cultured in 2D versus 3D culture conditions, with 3D cultures more accurately reflecting growth conditions in vivo (Lien et al, 2016). We thus investigated the role of Skp2 in YAP‐activated mammary acinar growth in a 3D culture system (Debnath et al, 2002). Mammary acini formed by cells expressing control shRNAs generally reach a size plateau after 17 days in 3D culture. In the same amount of time, cells expressing 5SA‐YAP form huge acini with invasive characteristics. While Skp2 depletion alone does not affect acinar size (although it does slightly distort acinar shape), Skp2 depletion in 5SA‐YAP‐expressing cells dramatically rescues their acinar size defect (Fig 5A–C). Consistent with this, Skp2 inhibition via treatment with SZL P1‐41, a validated small molecule Skp2 inhibitor (Chan et al, 2013; Fig EV2H), also significantly suppresses YAP‐induced tumor spheroid‐like acini formation (Fig 5D). Next, we asked whether acini that have already reached their size plateau (8 days is usually enough; Debnath et al, 2002) can resume growing upon YAP activation. With a drug‐inducible 5SA‐YAP cell line, 3 days of doxycycline treatment is sufficient to maintain acinar growth. Strikingly, Skp2 inactivation blocks this secondary growth (Fig EV2I).
Figure 5. Skp2 depletion represses the formation of YAP‐driven tumor spheroid‐like acini and aberrant epithelial tissue behaviors in a 3D stiff matrix.
-
AImmunoblots of MCF10A cells expressing vector or 5SA‐YAP and transduced with the indicated shRNA lentiviruses.
-
BMammary acini formation in MCF10A cells as in (A) grown on 3D Matrigel. After 17 days, acini were fixed and imaged using phase contrast microscopy. Images representative of two independent experiments are shown. Scale bars: 100 μm.
-
CQuantification of individual acinar size for (B). Orange bars indicate the median. > 250 acini were analyzed for each of two independent experiments.
-
DMammary acini formation by MCF10A cells expressing vector or 5SA‐YAP and treated with dimethylsulfoxide (DMSO) or the Skp2 inhibitor SZP P1‐41 (20 μM). Acini were treated as in (B). Images representative of three independent experiments are shown. Scale bars: 50 μm.
-
EAcini formed as in (B) immunostained with an E‐cadherin‐specific antibody (E‐Cad) and counterstained with DAPI. Representative single confocal images or serial Z‐stacks. Yellow arrows indicate lumen formation. Scale bars: 50 μm.
-
FAcinar lumen formation as determined by analysis of serial Z‐stacks from (E). Irregular acini with ambiguous lumens were classified “Not determined”. Error bars indicate s.e.m. > 30 acini were analyzed for each of two independent experiments.
-
G(Above) Glucose uptake was measured in adherent (Adh.) or suspended (Susp.) MCF10A cells expressing control or 5SA‐YAP using the Glucose Assay (GO) kit. (Below) Image depicting the color of the medium from cultures of the indicated cells.
-
H, IControl or 5SA‐YAP‐expressing MCF10A cells infected by the indicated shRNA lentiviruses were suspended. After 20 h, glucose uptake (H) and lactate concentration (I) in the indicated cells were measured. Representative images depicting the color of the medium from cultures of the indicated cells (I, below).
-
JSchematic depicting the basement membrane (BM; Matrigel) and collagen 1 (COL1)‐based BM/COL1 3D soft and stiff matrices as well as representative phalloidin‐stained images of MCF10A cells grown in each of them. Scale bars: 50 μm.
-
K5SA‐YAP‐expressing MCF10A cells infected by the indicated shRNA lentiviruses were embedded in soft or stiff 3D BM/COL1 gels. After 7–8 days of growth, the cells were imaged by phase contrast. Images representative of four independent experiments are shown. Scale bars: 100 μm. See Fig EV4C.
A hollow acinar lumen is important for proper mammary duct development (Debnath et al, 2002), so we next visualized acinar lumen formation with serial Z‐stack confocal microscopy. Most acini formed by 5SA‐YAP‐expressing cells have no lumen, but Skp2 depletion partially rescues their ability to form a lumen (Fig 5E and F). One previous study showed that the inner cells in 3D acini lose attachment from the ECM and subsequently develop a cellular “glucose uptake defect” via impaired Akt signaling (Schafer et al, 2009). This leads to the death of inner acinar cells, leaving behind a hollow lumen. Because Skp2 can promote glucose uptake and aerobic glycolysis via Akt regulation (Chan et al, 2012, 2013), we wondered whether the partial rescue of lumen formation induced by Skp2 depletion reflects a change in glucose uptake. To address this, we first confirmed that control cells detached from the ECM show reduced glucose uptake (Fig 5G). 5SA‐YAP‐expressing cells, however, show relatively high levels of glucose uptake compared to control cells grown in adherent conditions. Furthermore, this increased glucose uptake persists even in cellular suspension (Fig 5G). We also observed that the growth media for both adherent and suspended 5SA‐YAP‐expressing cells becomes yellowish over time, suggesting YAP hyperactivation accelerates the production of acidic metabolites, likely by enhancing aerobic glycolysis (Fig 5G). Consistent with this hypothesis, others have reported similar observations, but only in the context of cellular adhesion (Wang et al, 2015).
We next asked whether the maintenance of higher levels of glucose uptake in 5SA‐YAP‐expressing cells undergoing ECM detachment depends on increased levels of Skp2. Indeed, Skp2 depletion effectively down‐regulates glucose uptake in 5SA‐YAP‐expressing cells in suspension (Fig 5H). We also found Skp2 depletion reduces the production of lactate, a by‐product of aerobic glycolysis (Fig 5I). Consistent with the report that Skp2 controls glucose uptake and glycolysis via Akt (Chan et al, 2012, 2013), we found that suspended cells expressing 5SA‐YAP suppress glucose uptake and lactate production in response to treatment with the PI3K inhibitor LY294002 (Fig EV3A and B).
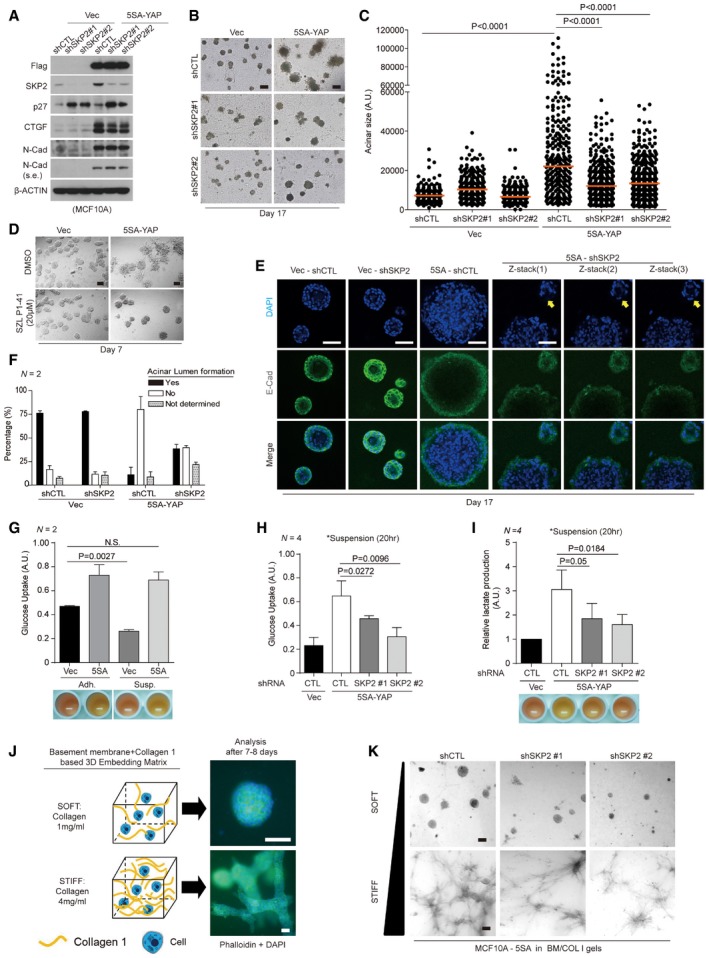
Figure EV3. YAP‐Skp2 axis affects aerobic glycolysis.
-
A, BMCF10A cells expressing vector or 5SA‐YAP were suspended with DMSO or LY294002 (50 μM) treatment. After 20 h, glucose uptake (A) and lactate production (B) were measured in the indicated cells.
-
CRelative mRNA levels for the indicated genes in suspended MCF10A cells expressing control and 5SA‐YAP with the indicated shRNA lentiviruses, as measured by qPCR.
High glucose uptake may reflect an increase in glucose transporter expression. Interestingly, 5SA‐YAP over‐expression has been shown to induce glut3 expression (Wang et al, 2015). Skp2‐mediated glucose uptake has also been suggested to occur via Akt‐mediated enhancement of glut1 expression (Chan et al, 2012). We, therefore, measured glut1 and glut3 expression under the same experimental conditions. Consistent with previous reports, we found 5SA‐YAP over‐expression increases glut3 expression, but causes no further enhancement of glut1 expression. Skp2 depletion, in contrast, has no effect on glut3 expression, but reduces glut1 mRNA expression (Fig EV3C). These data imply that during ECM detachment, 5SA‐YAP‐expressing cells may be able to maintain high levels of glucose uptake via glut1 expression which is sustained by enhanced Skp2 as well as increased glut3. Given that inner acinar cell detachment from the ECM is a major step of 3D mammary lumen formation, the YAP‐induced increase in Skp2 expression likely suppresses normal lumen formation by enhancing glucose uptake. Together, these results indicate an increase in Skp2 expression is necessary for the formation of YAP‐driven tumor spheroid‐like acini in 3D culture.
Mammary glands develop within a very soft tissue. Breast tumors are usually accompanied by tissue stiffening that actively promotes malignant mammary gland transformation (Paszek et al, 2005). To mimic tumor‐related tissue stiffness, we used basement membrane and collagen 1‐based 3D ECM matrix gels (BM/COL1 gels; Paszek et al, 2005). In these culture systems, changes in collagen concentration allow distinctly soft or stiff 3D matrices. We found MCF10A cells expressing control shRNAs form normal growth‐arrested acini when cultured for 7–8 days embedded in soft BM/COL gels whose collagen concentration (1 mg/ml) mimics the stiffness of the normal mammary stroma. The same cells form many aberrant tubule‐like tissues when embedded in stiff BM/COL gels whose collagen concentration (4 mg/ml) mimics the elastic modulus of a breast tumor (Paszek et al, 2005; Fig 5J).
Since recent studies using 3D BM/COL1 gels have suggested YAP mediates 3D matrix stiffness‐dependent growth and morphogenesis of mammary epithelial cells (Aragona et al, 2013), we were motivated to explore the physiological role Skp2 plays in this setting. In contrast to previous reports (Aragona et al, 2013), however, we observed nuclear localization of YAP in cells grown on soft 3D gels in our hands. We also did not see any reduction in the expression of known YAP target genes when culturing cells in 3D soft gels rather than stiff gels, nor did we see any reduction in Skp2 expression (Fig EV4A and B). Although cells grown in soft or stiff 3D BM/COL1 gels show similar levels of YAP activity and Skp2 expression, shRNA‐mediated Skp2 depletion significantly rescues the aberrant overgrowth of cells grown in stiff 3D gel but only slightly affects cells grown in soft gel (Fig EV4C, above & middle). Furthermore, 5SA‐YAP‐expressing cells grown in 3D stiff gels show more malignant phenotypes than control vector‐expressing cells. This suggests tissue stiffening synergizes with hyperactive YAP to accelerate abnormal tissue behaviors (Fig EV4D). Importantly, these anomalous tissue overgrowth phenotypes are reduced by Skp2 depletion (Figs 5K and EV4C, below). Consistent with this, Skp2 inhibition via SZL P1‐41 treatment also alleviates the aberrant epithelial tissue behavior observed in stiff 3D gels (Fig EV4E). The enhancement of Skp2 expression induced by hyperactive YAP, however, is unlikely to contribute to the invasive phenotypes (e.g., EMT) observed in 5SA‐YAP‐expressing cells grown on stiff 3D substrates. This is because while 5SA‐YAP increases the expression of the mesenchymal marker N‐cadherin, Skp2 depletion does not affect it (Fig 5A).
Figure EV4. Skp2 inactivation effectively suppreses YAP‐driven aberrant stiff 3D matrix‐evoked epithelial tissue behaviors.
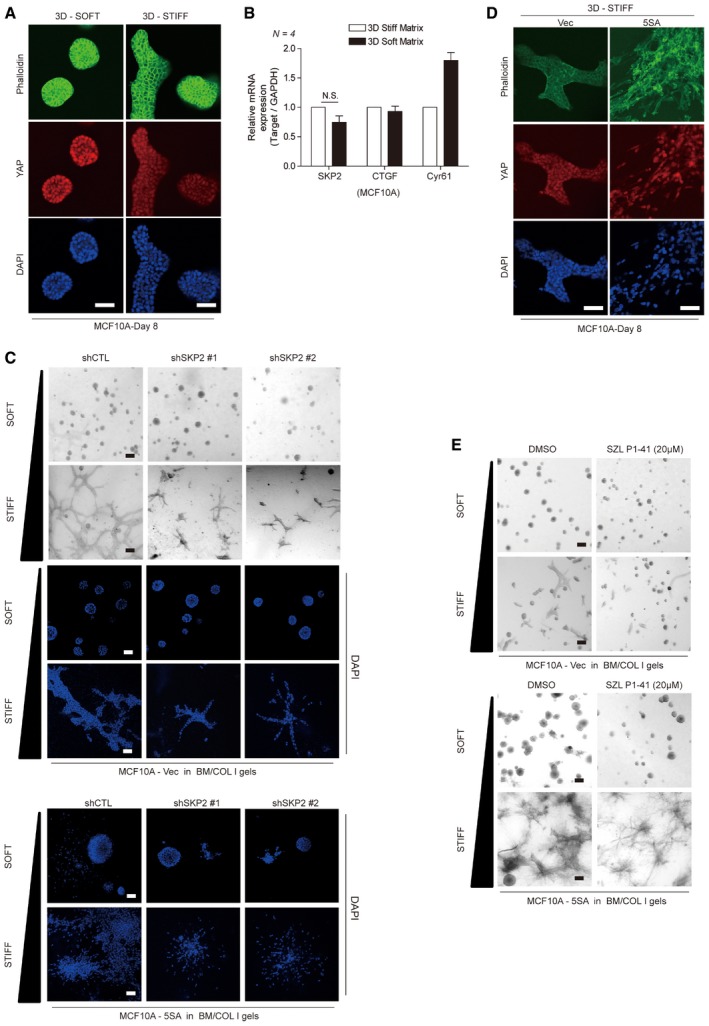
- MCF10A cells were embedded in soft or stiff 3D BM/COL1 gels. After 8 days of growth, the cells were fixed and stained with phalloidin and a YAP‐specific antibody. DAPI was used as a nuclear counterstain. Images were taken by confocal microscopy. Scale bars: 50 μm.
- Relative mRNA levels for the indicated genes in MCF10A cells treated as in (A), as measured by qPCR. Error bars indicate standard error of the mean (s.e.m.) for four independent experiments. Statistical significance, as determined by a two‐tailed t‐test, is indicated in the graph. N.S. indicates non‐significance.
- Vector or 5SA‐YAP‐expressing MCF10A cells infected by the indicated shRNA lentiviruses were embedded in soft or stiff 3D BM/COL1 gels. After 7–8 days of growth, the cells were imaged by phase contrast (gray) or confocal microscopy (blue: DAPI). Scale bars: black, 100 μm; white, 50 μm.
- Empty vector‐ or 5SA‐YAP‐expressing MCF10A cells were embedded in stiff 3D BM/COL1 gels. After 7–8 days of growth, the cells were treated as in (A). Scale bars: 50 μm.
- Vector‐ or 5SA‐YAP‐expressing MCF10A cells were embedded with either DMSO or the Skp2 inhibitor SZL P1‐41 (20 μM) in soft or stiff 3D BM/COL1 gels. After 7–8 days of growth, the cells were fixed and imaged by phase contrast microscopy. Images are representative of three independent experiments. Scale bars: 100 μm.
Oncogenic functions of YAP‐induced Skp2
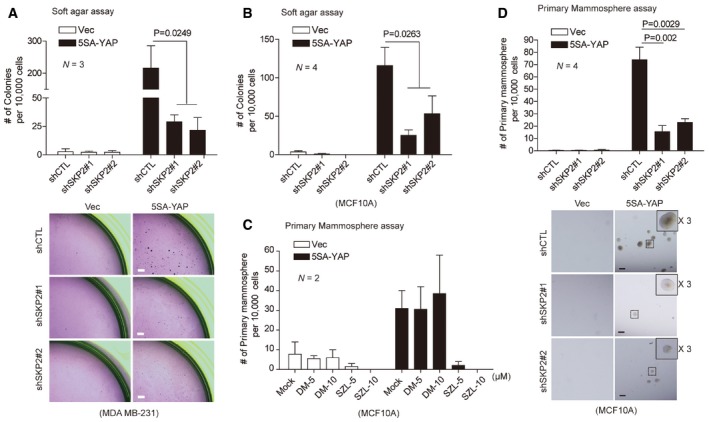
To further evaluate Skp2's role in YAP‐dependent oncogenic transformation and growth, we measured anchorage‐independent growth in soft agar. We found Skp2 depletion strongly suppresses 5SA‐YAP‐induced colony formation (Fig 6A and B). YAP/TAZ gain of function endows breast cell lines with cancer stem cell‐like traits (Cordenonsi et al, 2011; Kim et al, 2015). We, therefore, measured Skp2's contribution to mammosphere formation by YAP‐expressing cells. While YAP over‐expression induces the formation of numerous spheres, SZL P1‐41 treatment and Skp2 depletion both suppress this phenomenon (Fig 6C and D).
Figure 6. Oncogenic functions of YAP‐induced Skp2.
-
A, BAnchorage‐independent soft agar assays for vector‐ or 5SA‐YAP‐expressing MDA‐MB‐231 cells (A) or MCF10A cells (B) depleted with the indicated shRNA lentiviruses. After 21 days, colonies were stained with crystal violet and counted. Statistical significance, as determined by the one‐way ANOVA, is indicated above each bar. (A, below) Images representative of three independent experiments. Scale bars: 100 μm.
-
CPrimary mammosphere assays for vector‐ or 5SA‐YAP‐expressing MCF10A cells treated with SZL P1‐41 (SZL; 5 and 10 μM) or the same amount of DMSO (N = 2).
-
D(Above) Primary mammosphere assays for MCF10A cells as prepared in (A). Statistical significance, as determined by a two‐tailed t‐test, is indicated above each bar. (Below) Images representative of four independent experiments. Scale bars: 150 μm.
The YAP‐Skp2 axis does not seem to be conserved in mice
Although we originally planned to study this phenomenon in vivo using a mouse model, we speculated that the YAP‐Skp2 axis may not be conserved in mice for several reasons. First, activated YAP does not up‐regulate Skp2 in various mouse cell lines or in Lats1/2 dKO MEF despite the induction of Ctgf, an established YAP target gene (Fig 7A and B). Second, although depletion of Yap in murine mammary cell lines reduces Skp2 protein levels (Fig 7C), similar to what was observed in human cell lines (Fig 1E), this may be an indirect consequence of the enrichment of cells in G0/G1 that is induced by Yap depletion. This enrichment is reflected in reduced levels of cyclin B1 observed in Yap‐depleted cells. Indeed, unlike in human cell lines (Figs 1G and 7D, left), Skp2 levels in Yap‐depleted 4T1 mitotic cells collected using the method used for Fig 1G were comparable to the Skp2 levels of control knockdown or mock mitotic cells (Fig 7D, right). This was not the case for Ctgf levels. Importantly, MG132‐mediated inhibition of the proteasome in Yap‐depleted 4T1 cells rescues Skp2 protein levels (Fig 7E). This suggests the reduction in Skp2 we observed in Yap‐depleted 4T1 mouse cells may be attributed to the APC‐Cdh1‐mediated proteasomal degradation that usually occurs during early G1 phase. Of note, MG132 treatment does not rescue the reduction in Skp2 induced by YAP knockdown in human cell lines (Figs 1F and EV1A). Third, in contrast to what we observed with human cells (Fig 2I), Skp2 expression is reduced in 5SA‐YAP‐expressing mouse cells grown in suspension (Fig 7F). Fourth, despite significant similarity in the Skp2 promoter upstream of its TSS between human and mouse, there is little similarity downstream of the TSS. Importantly, the mouse Skp2 promoter has no TEAD‐binding consensus site corresponding to TB2 in the human Skp2 promoter (Fig 7G). Compared to other mammals, the mouse Skp2 promoter also contains relatively few TEAD‐binding motifs around the TSS (Fig 7H). Fifth, 5SA‐YAP expression up‐regulates Skp2 expression in canine cells (MDCK), which have the conserved TB2 region (Fig 7G and I). Finally, we surveyed the microarray data generated from transgenic YAP mouse liver (Dong et al, 2007), but Skp2 did not appear in the list of genes up‐regulated by YAP (data not shown). Together, all these lines of evidence convinced us that while YAP‐induced increases in Skp2 expression are oncogenic in humans, the YAP‐Skp2 axis does not seem to be conserved in mice.
Figure 7. The YAP‐Skp2 axis does not seem to be conserved in mice.
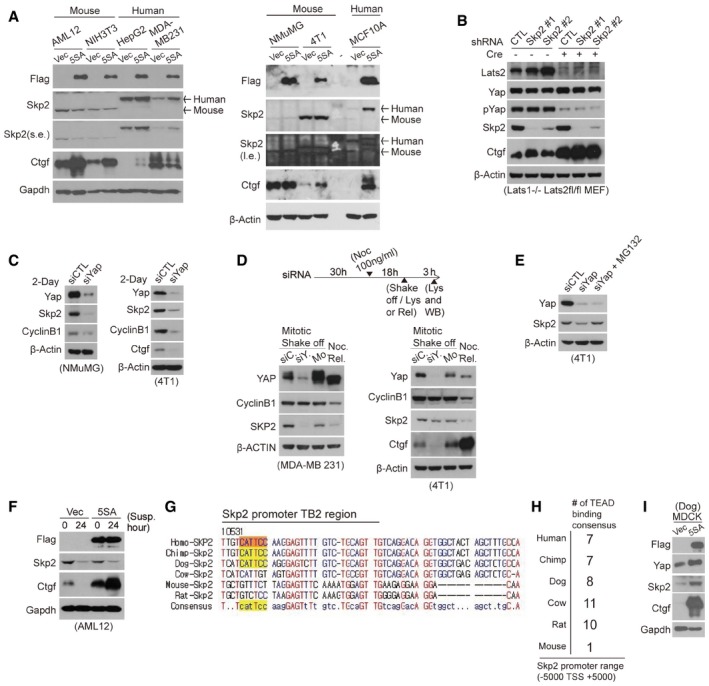
- Immunoblots of mouse or human cell lines transduced with vector‐ or 5SA‐YAP‐encoding retroviruses. Although 5SA‐YAP expression induces the expression of Ctgf, the best‐known Yap target gene, in both mouse and human cells, it only induces Skp2 expression in human cells.
- Immunoblot of Lats1−/− Lats2fl/fl MEFs infected with the indicated shRNA lentiviruses and transduced with or without Cre. The specificity of the antibody for mouse Skp2 was validated using Skp2 knockdown.
- Immunoblot of mouse cell lines transfected with the indicated siRNAs for 2 days.
- (Above) Experimental protocol schematic. (Below) immunoblots of MDA‐MB‐231 (left) or 4T1 cells (right) treated with 100 ng/ml nocodazole (Noc) 30 h after siRNA transfection (siC: siControl, siY: siYAP) to arrest them in mitosis. Mitotic cells were then collected via a mechanical shake‐off. As a control, non‐transfected mitotic mock (Mo) cells were washed with PBS several times and released into early G1 (Noc. Rel.).
- Immunoblot of 4T1 cells transfected with the indicated siRNAs for 2 days and then treated with MG132 for 4 h.
- Immunoblots of vector‐ or 5SA‐YAP‐expressing AML12 mouse cells placed in suspension for the indicated times.
- A sequence alignment of the region of the Skp2 promoter surrounding the TB2 TEAD‐binding consensus site for several mammalian species.
- TEAD‐binding motifs −5,000 to +5,000 bp from the TSS in the Skp2 promoter of the indicated species.
- Immunoblots of MDCK cells (a dog cell line) transduced with either vector‐ or 5SA‐YAP‐encoding retroviruses.
YAP expression and Skp2 expression are positively correlated in breast cancer patients
Using microarray data from multiple breast cancer studies, we observed that Skp2 expression is well correlated with YAP expression in human cancers (Figs 8A and EV5A). We surveyed the TCGA database using cBioPortal (Cerami et al, 2012; Gao et al, 2013) and confirmed this positive correlation between YAP and Skp2 expression in cancers of various tissues (Fig EV5B). We then compared the expression of Skp2 and YAP target gene sets (Cordenonsi_YAP_conserved_signature; Cordenonsi et al, 2011) in breast and other cancer patients. Although the correlation was not perfect even among YAP signature genes, we did observe that cancer patients with higher levels of Skp2 showed a tendency to express higher levels of Yap signature genes in part (Figs 8B and EV5C).
Figure 8. YAP expression and Skp2 expression are positively correlated in breast cancer patients.
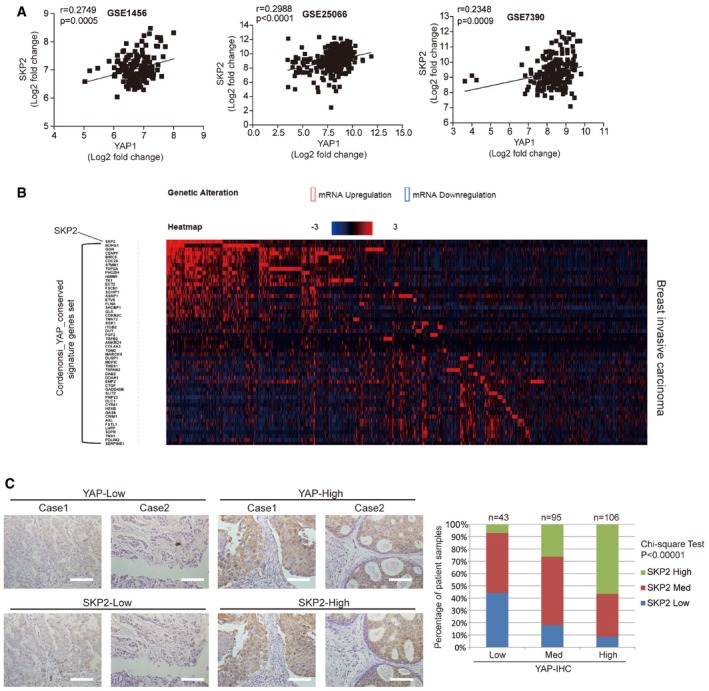
- Heatmap analysis using cBioPortal showing Skp2 and YAP target gene sets in breast invasive carcinoma patients. Data are presented as fold change in Log2.
- Immunohistochemical analysis of tissues used for microarrays (TMA) from breast cancer patients using YAP‐ and Skp2‐specific antibodies. Representative images and statistical analysis of the tissue microarray data are shown. P‐value was calculated using the chi‐square test. Scale bars: 50 μm.
Figure EV5. Positive correlation of YAP and Skp2 expression in breast cancer patients.
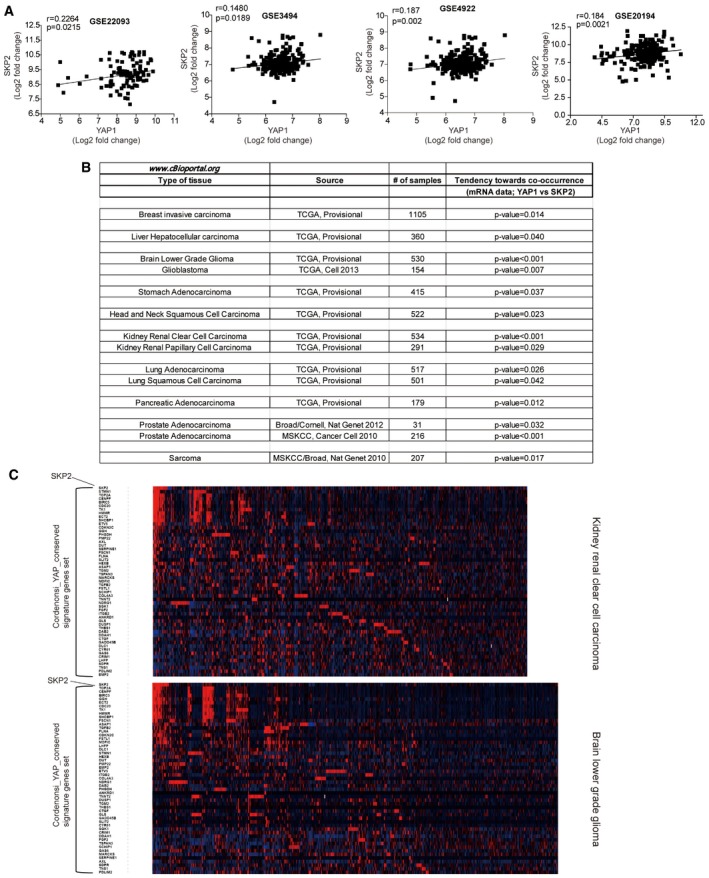
- Scatter plot comparing Skp2 and YAP1 mRNA expression in breast cancer patient microarray data. r = Pearson's correlation coefficient.
- Summary and statistical analysis of the correlation between YAP and Skp2 mRNA expression in various cancer patients using cBioPortal.
- Heatmap analysis using cBioPortal showing Skp2 and YAP target gene sets in kidney renal clear cell carcinoma and brain lower‐grade glioma.
One previous study found an association between high Skp2 expression and basal‐type breast cancer (ER negative/HER negative; Signoretti et al, 2002). Interestingly, this type of breast cancer is also frequently associated with YAP activation (Kim et al, 2015). We found by performing immunohistochemistry (IHC) on 244 tissue samples from Korean breast cancer patients that cancers expressing high levels of YAP protein also tend to express high levels of Skp2 protein (Fig 8C).
Discussion
Although aberrant Skp2 protein stabilization has been reported to explain the elevated Skp2 in human cancers, the fact that Skp2 mRNA levels are also frequently up‐regulated has so far been overlooked. Therefore, an exploration of whether and how other oncogenic signaling pathways or microenvironments may affect Skp2 transcription will prove important for Skp2‐associated cancer treatment. Here, we provide an explanation for the dysregulation of Skp2 expression observed in human cancers distinct from the existing protein stabilization hypothesis. Specifically, we found that mechanical cues function upstream of Skp2 transcription. At the molecular level, YAP directly binds the Skp2 promoter and enhances its expression upon mechanical stress. Our results, therefore, reveal that mechanical cues such as cellular suspension or ECM stiffness drive the cell cycle machinery via this YAP‐Skp2 axis.
A previous study showed that the human Skp2 Akt‐dependent regulatory site (Akt phosphorylates Ser 72 to stabilize Skp2 protein) is not conserved in mice. The Ser 72 site is conserved, however, in many other mammals (Gao et al, 2009). We also observed other inter‐species differences in the YAP‐Skp2 axis between human and mouse. Human and dog Skp2 promoters both respond to YAP activation and both show conservation of the TEAD‐binding sequence, but mice do not. Although we use the mouse as a genetic model organism because humans and mice are similar in so many ways, there are also many differences ranging from physical characteristics to behavior. It is, thus, not unexpected that some cellular signaling pathways will have diverged since the last common ancestor shared by mice and humans.
Although the Hippo‐YAP signaling pathway has been studied extensively over the last decade and cell cycle proteins like cyclin D1 and E2F1 have been linked to YAP function (Nicolay et al, 2011; Mizuno et al, 2012), the full range of YAP target genes that regulate cell cycle progression have still not yet been identified. Our findings present Skp2 as a novel downstream target of YAP that is directly involved in cell cycle progression. Skp2 functions as a gatekeeper for cell cycle exit upon YAP inactivation, as both Skp2 reconstitution and p21/p27 depletion rescue YAP depletion‐induced cell cycle defect. Interestingly, we noted that Skp2 inhibition does not effectively suppress YAP‐driven cell proliferation or cell cycle reentry in 2D culture systems. In 3D conditions, however, elevated Skp2 is required for the oncogenic functions triggered by YAP hyperactivation. For example, Skp2 depletion prevents the formation of YAP‐driven tumor spheroid‐like acini, mammosphere growth, anchorage‐independent growth, and the formation of irregular structured tissues in collagen‐rich 3D matrices.
In this study, we identified Skp2 as an important cell cycle regulator of Hippo‐YAP signaling, especially at the G0/G1 boundary. It is likely, however, that other cell cycle‐related genes such as those involved in DNA replication (Cox et al, 2016) also contribute to YAP‐dependent oncogenesis. Since we have uncovered a molecular link between YAP and Skp2, two oncogenes frequently dysregulated in human cancers, our results suggest Skp2 may represent an attractive therapeutic target for YAP‐driven human cancers.
Materials and Methods
Cell culture
MCF10A cells were cultured in DMEM/F12 supplemented with 5% horse serum (Invitrogen), 20 ng/ml EGF (Peprotech), 10 mg/ml insulin (Sigma), 0.5 mg/ml hydrocortisone (Sigma), 100 ng/ml cholera toxin (Sigma), and penicillin/streptomycin (Invitrogen). RPE cells were cultured in DMEM/F12 supplemented with 10% FBS and penicillin/streptomycin. AML12 cells were cultured in DMEM/F12 supplemented with 10% FBS, 0.005 mg/ml insulin–transferrin–selenium (Invitrogen), 40 ng/ml dexamethasone (Sigma), and penicillin/streptomycin. MDA‐MB‐468 cells were cultured in RPMI supplemented with 10% FBS and penicillin/streptomycin. NMuMG cells were cultured in DMEM supplemented with 10 mg/ml insulin (Sigma), 10% fetal bovine serum (FBS), and penicillin/streptomycin. MDA‐MB‐231, HeLa, 293T, HEK293, HepG2, NIH3T3, 4T1, MDCK, and Lats1 KO MEF (Lats1−/− Lats2fl/fl; Kim et al, 2013) cells all were cultured in DMEM supplemented with 10% fetal bovine serum (FBS) and penicillin/streptomycin.
Virus generation and infection
Flag‐YAP WT, 2SA, and 5SA were cloned into pMSCV puro or hygro retroviral vectors and used throughout this study. SKP2 was cloned into the pLVX‐IRES puro lentiviral vector. To generate retroviral particles, 293T cells were transfected with a 5:5:2 ratio of DNA pMSCV vector:Gag‐pol:VSVG using polyethylenimine (PEI). The media was changed 1 day post‐transfection. Then, viral supernatants were collected 48 h later. The viral supernatants were centrifuged at 800 ×g for 20 mins to clear debris and then supplemented with 6 μg/ml polybrene (Sigma) to improve target cell infection. One day after infection, the infected cells were selected for 2–3 days using 3 μg/ml puromycin or 250 μg/ml hygromycin. For lentiviral particle production, 293T cells were transfected with a 4:3.5:0.5 ratio of DNA pLVX vector:delta 8.2:VSVG using PEI and packaged with the retroviral packaging protocol described above. All shRNAs used in this study were cloned into the lentiviral pLKO.1 puro plasmid. The shRNA target sequences we used, which were previously validated (Chan et al, 2013), were as follows: shControl, 5′‐CAACAAGATGAAGAGCACCAA‐3′; shSKP2 #1, 5′‐GATAGTGTCATGCTAAAGAAT‐3′; shSKP2 #2, 5′‐GCCTAAGCTAAATCGAGAGAA‐3′; shmSkp2 #1, 5′‐GCCTCGACTTAAGTGACAGTA‐3′; and shmSkp2 #2, 5′‐ GCAGATTAACTGCGCCTATTT‐3′.
To establish the doxycycline‐inducible expression system, we cloned Flag‐YAP 5SA into the lentiviral pLVX‐Tight‐puro vector and used the pLVX‐Tet‐ON Advanced (Neo) plasmid to generate Tet‐expressing cells. Two independently produced lentiviral particles were co‐infected to target cells, and then, those cells were selected for 3 days with 3 μg/ml puromycin and 400 μg/ml G418. To generate the knockout cell line, 20‐nucleotide guide sequences taken from the genome‐scale CRISPR knockout (GeCKO2) library (Sanjana et al, 2014) were cloned into the lentiCRISPRv2 plasmid (Addgene #52961). We used the following guide RNA sequence: human SKP2 exon2, 5′‐AAGACTTTGTGATTGTCCGC‐3′. After lentivirus preparation, the target cells were infected and selected using puromycin. Single cell clones were expanded and screened via immunoblot and genomic sequencing.
siRNA transfection
siRNAs were synthesized by Samchully Pharm. Cells were transfected with 20 nM siRNAs using Lipofectamine RNAi Max (Invitrogen) according to the manufacturer's instructions. Analyses were performed 2 days post‐transfection. The siRNA targeting sequences, which were previously validated (Liang et al, 2007; Zhao et al, 2008; Dupont et al, 2011; Hoefer et al, 2012), were as follows: siCTL (control) sense, 5′‐CGUACGCGGAAUACUUCGA‐3′; siYAP sense, 5′‐GACAUCUUCUGGUCAGAGA‐3′; siTEAD1/3/4 sense, 5′‐GAUCAACUUCAUCCACAAGCU‐3′; sip21 sense, 5′‐CUUCGACUUUGUCACCGAG‐3′; sip27 sense, 5′‐GGAGCAAUGCGCAGGAAUA‐3′; and siYap (mouse) sense, 5′‐GAAGCGCUGAGUUCCGAAAUC‐3′.
Antibodies
Anti‐YAP (WB: Cell Signaling 4912s or our own custom rabbit polyclonal generated using human YAP a.a. 201–450; IF: Novus H00010413‐M01; IHC/ChIP: Santa Cruz SC‐15407), anti‐Ki67 (Abcam ab16667), anti‐SKP2 (WB: Santa Cruz SC‐7164, Zymed 32‐3300; IF/IHC: Santa Cruz SC‐7164), anti‐BrdU (BD 555627), anti‐Ctgf (Santa Cruz SC‐14939), anti‐Cdh1 (Calbiochem CC43), anti‐p21 (Santa Cruz SC‐756), anti‐p27 (Santa Cruz SC‐528), anti‐PTEN (Cell Signaling 9559s), anti‐E‐cadherin (BD 610182), anti‐GAPDH (Abcam ab125247), anti‐Flag (Wako 012‐22384), anti‐TEAD4 (Abcam ab58310), anti‐cyclin B1 (Santa Cruz SC‐425), and anti‐TAZ (BD 560235).
Reagents
Latrunculin B (Sigma 5288), Y27632 (Sigma Y0503), DMSO (MP BIO 0219605580), MG132 (AG Scientific M‐1157), cyclohexamide (Sigma C7698), nocodazole (Sigma M1404), SZL P1‐41 (Tocris 5076), doxycycline (Sigma D9891), and LY‐294,002 (Sigma L9908).
Hydrogels
Fibronectin‐coated hydrogels were produced according to published protocols (Cretu et al, 2010; Tse & Engler, 2010).
Western blot
Cells were lysed with radio‐immunoprecipitation buffer (50 mM Tris–Cl (pH 7.5), 150 mM NaCl, 1 mM EDTA, 10 mM NaF, 1 mM Na3VO4, 1% NP‐40, 0.5% sodium deoxycholate, 0.1% SDS) containing protease inhibitors (PMSF, leupeptin, and pepstatin). Cell lysates were centrifuged for 10 min at 16,100 ×g and the supernatants were collected. Protein concentration was measured using the Bradford assay. Lysates were denatured by boiling for 10 min in Laemmli sampling buffer and separated by SDS–PAGE. The proteins were transferred to nitrocellulose membranes and blocked with 5% skim milk in 0.1% TBST (Tween‐20) for 30 min at room temperature. Primary antibodies were diluted in either 0.1% TBST or 5% BSA supplemented with 0.1% Tween‐20 and incubated with the membranes overnight at 4°C. The blots were then washed three times with 0.1% TBST. Secondary antibodies were diluted in 1% skim milk in 0.1% TBST and incubated with the membranes for 1 h at room temperature. After several washes with TBST, the western signals were detected using ECL reagents.
RNA isolation and analysis
Cells were harvested for total RNA isolation using Ribo‐Ex (GeneAll Inc.) according to the manufacturer's instructions; 2 μg of purified RNA per sample was reverse‐transcribed to cDNA using MMLV reverse transcriptase (Enzynomics). qPCR was performed using the SYBR qPCR mixture (Enzynomics) on a Bio‐Rad Connect machine. Expression levels were normalized to β‐actin or GAPDH. The qPCR primer sequences (forward and reverse, respectively) we used for each human gene were as follows: SKP2, 5′‐ATGCCCCAATCTTGTCCATCT‐3′ and 5′‐CACCGACTGAGTGATAGGTGT‐3′; p21, 5′‐TGTCCGTCAGAACCCATGC‐3′ and 5′‐AAAGTCGAAGTTCCATCGCTC‐3′; p27, 5′‐ATCACAAACCCCTAGAGGGCA‐3′ and 5′‐GGGTCTGTAGTAGAACTCGGG‐3′; GAPDH, 5′‐CTTCGCTCTCTGCTCCTCCT‐3′ and 5′‐GTTAAAAGCAGCCCTGGTGA‐3′; CTGF, 5′‐AGGAGTGGGTGTGTGACGA‐3′ and 5′‐CCAGGCAGTTGGCTCTAATC′‐3; CYR61, 5′‐CCTTGTGGACAGCCAGTGTA‐3′ and 5′‐ACTTGGGCCGGTATTTCTTC‐3′; GLUT1, 5′‐TGACCATCGCGCTAGCACTGC‐3′ and 5′‐AACGGCAATGGCAGCTGGACG‐3′; and GLUT3, 5′‐TTGAACACCTGCATCCTTGA‐3′ and 5′‐GACAGCCCATCATCATTTCC‐3′.
Immunofluorescence
Cells seeded on coverslips were fixed with 4% paraformaldehyde (PFA) for 20 min at room temperature and then blocked with 3% bovine serum albumin (w/v) in 0.3% PBST (Triton X‐100) for 20 min. The cells were then incubated with primary antibodies in blocking solution for 1 h at room temperature, washed three times with 0.3% PBST, and then further incubated with secondary antibodies in blocking solution for 1 h at room temperature. After another three PBST washes, the cells were mounted with Vectashield containing DAPI (Vector Laboratories). For BrdU staining, cells were incorporated with 5 μg/ml BrdU for indicated time and then fixed with 4% PFA. The fixed cells were further incubated with 2N hydrochloric acid (HCl) at 37°C for 11 min. After washing with PBS to neutralize the HCl, the cells were processed as above for staining with BrdU‐specific antibody.
Immunohistochemistry (IHC)
For the breast cancer patient tissue microarrays, paraffin‐embedded tissue sections were dehydrated and boiled in 10 mM sodium citrate butter (pH 6.0) in a pressure cooker for antigen retrieval. Then, endogenous peroxidase activity in the tissues was quenched by incubation with 0.3% H2O2 for 30 min. Native biotinylated proteins were also blocked using an avidin/biotin blocking kit (Vector Laboratories). After several washes with PBS, the tissue sections were incubated in a blocking solution (PBS supplemented with 3% BSA) for 30 min at room temperature. The tissues were then incubated with YAP‐ or SKP2‐specific antibodies at 4°C overnight. These primary antibodies for IHC were previously validated [anti‐YAP (Zhang et al, 2011; Wang et al, 2013) and anti‐SKP2 (Harada et al, 2005; Smock et al, 2008; Liu et al, 2012)]. Finally, each protein was detected using the Vectastain elite ABC and DAB substrate kits (Vector Laboratories) according to the manufacturer's instructions. Hematoxylin was used as a nuclear counterstain.
Chromatin immunoprecipitation (ChIP)
Cells were cross‐linked with 1% formaldehyde (HCHO) for 8 min at room temperature and quenched with 125 mM glycine for 5 min at room temperature. Harvested cells were washed twice in cold TBS (100 mM Tris–Cl pH 7.5, 0.9% NaCl) and then lysed in MC lysis buffer (10 mM Tris–Cl pH 7.5, 10 mM NaCl, 3 mM MgCl2, 0.5% NP‐40). The lysates were centrifuged at 250 × g for 5 min at room temperature and the pellet of nuclei was washed two more times with MC lysis buffer. The pellet was then resuspended in MNase buffer (10 mM Tris–Cl pH 7.5, 10 mM NaCl, 3 mM MgCl2, 1 mM CaCl2, 4% NP‐40) with fresh PMSF and adjusted to 1% SDS and 20 mM NaCl. Then, the chromatin DNAs were sonicated using a Bioruptor (3 × 10 cycles with each cycle comprising 30 s of sonication and 30 s of rest at the highest power setting). Every 10 sonication cycles, the samples were lightly vortexed and reloaded into the Bioruptor. The fully sonicated samples were then centrifuged at 13,200 rpm for 15 min at 4°C. The volume of each supernatant was increased by fivefold with FA lysis buffer (50 mM HEPES adjusted to pH 7.5 with KOH, 150 mM NaCl, 1 mM EDTA, 1% Triton X‐100, 0.1% sodium deoxycholate, 0.1% SDS) and fresh 2 mM PMSF. These were then incubated with 4 μg of antibodies and protein A/G agarose beads (GeneDEPOT) overnight at 4°C. The next day, the beads were collected by centrifugation at 200 × g for 2 min at room temperature and washed with FA lysis buffer (150 mM NaCl low salt buffer, no PMSF). This bead washing step was repeated twice in low salt buffer, twice in high salt FA lysis buffer (500 mM NaCl), once in ChIP wash buffer (10 mM Tris–Cl pH 8.0, 0.25 M LiCl, 1 mM EDTA, 0.5% NP‐40, 0.5% sodium deoxycholate), and once in TE buffer (100 mM Tris–Cl pH 8.0, 10 mM EDTA). The beads were then resuspended in ChIP elution buffer (50 mM Tris–Cl pH 7.5, 10 mM EDTA, 1% SDS) and incubated overnight at 68°C. The resulting eluates were separated from the beads by centrifugation, treated with RNase A (0.2 mg/ml) for 30 min at 37°C, and then treated with proteinase K (0.2 mg/ml) for 1 h at 55°C. The DNA was then purified by phenol–chloroform ethanol precipitation and quantified by qPCR. The primer sequences (forward and reverse, respectively) we used were as follows: CTGF prmt, 5′‐TCAGACGGAGGAATGCTGAG‐3′ and 5′‐CGAGGCTTTTATACGCTCCG‐3′; CTGF 3′rgn, 5′‐GGTTTGGCCTAGCACTCCA‐3′ and 5′‐TCTGGTGACCTGCTCAATTT‐3′; SKP2 TB2, 5′‐AGGATGAGGGACAGCTGGTAT‐3′ and 5′‐ACCCTAATCCTGGCAAAGCTA‐3′; and SKP2 3′rgn, 5′‐GCTGTGGTTAAAATTTGAAAGCA‐3′ and 5′‐ACAAGCATATGAAGTAGATGGGT‐3′.
ChIP‐Seq analysis
Cells were fixed with 1% formaldehyde for 15 min and quenched with 0.125 M glycine. Chromatin was isolated by the addition of lysis buffer, followed by disruption with a Dounce homogenizer. Lysates were sonicated and the DNA sheared to an average length of 300–500 bp. Genomic DNA (Input) was prepared by treating aliquots of chromatin with RNase, proteinase K, and heat for de‐cross‐linking, followed by ethanol precipitation. Pellets were resuspended and the resulting DNA was quantified on a NanoDrop spectrophotometer. Extrapolation to the original chromatin volume allowed quantitation of the total chromatin yield. Starting with 50 μg of chromatin, genomic DNA regions of interest were isolated using Flag‐M2 affinity beads (Sigma A2220). Complexes were washed, eluted from the beads with SDS buffer, and subjected to RNase and proteinase K treatment. Cross‐links were reversed by incubation overnight at 65°C, and ChIP DNA was purified by phenol–chloroform extraction and ethanol precipitation. Illumina sequencing libraries were prepared from the ChIP and input DNAs by the standard consecutive enzymatic steps of end‐polishing, dA addition, and adaptor ligation. After a final PCR amplification step, the resulting DNA libraries were quantified and sequenced on Illumina's HiSeq 2500 (50‐nt reads, single end). Reads were aligned to the human genome (hg19) using the BWA algorithm (default settings). Duplicate reads were removed and only uniquely mapped reads (mapping quality ≥ 25) were used for further analysis. Alignments were extended in silico at their 3′‐ends to a length of 150 bp, which is the average genomic fragment length in the size‐selected library, and assigned to 32‐nt bins along the genome. The resulting histograms (genomic “signal maps”) were stored in bigWig files. Peak locations were determined using the MACS algorithm (v1.4.2) with a cutoff of P‐value = 1e‐10.
Reporter construction and reporter assay
The region of the human Skp2 promoter containing the TB2 site (+4,121–4,370 bp) was amplified from genomic DNA isolated from RPE1 cells and cloned into the pGL3 basic vector using the restriction enzymes XhoI and HindIII. We altered the TB2 WT (CATTCC) sequence to TB2 Mut (AGAAAA) via site‐directed mutagenesis in pGL3 basic. Then, MCF10A cells stably expressing vector, 5SA‐YAP, or 5SA/94A‐YAP were cultured in 12‐well dishes and co‐transfected with 1 μg of the pGL3 reporter constructs and 10 ng CMV‐Renilla plasmids using FuGENE HD (Promega). After 48 h, the cells were harvested and reporter activity was measured using a Dual‐luciferase assay kit (Promega) according to the manufacturer's instructions.
Mammosphere assay
MCF10A cells were trypsinized and 104 cells were seeded into poly‐HEMA (20 mg/ml in 95% EtOH)‐coated 6‐well plates with 2.5 ml of DMEM/F12 supplemented with B‐27 (Gibco), 20 ng/ml human EGF (Peprotech), and penicillin/streptomycin. Mammospheres were counted 7–10 days later.
Soft agar assay
1 ml of 0.5% bottom agar in DMEM (for MDA‐MB‐231) or MCF10A growth media was allowed to solidify in 6‐well plates; 104 cells were added to 0.4% top agar in media and layered onto the bottom agar. 2 ml of growth media was added on top to prevent drying and replenished every 3 days. After 21 days, colonies were stained with 0.1% crystal violet for 5 h and examined under a dissecting microscope.
Acini morphogenesis assay
The acini morphogenesis assays were performed as previously described (Debnath et al, 2002). Briefly, 8‐chambered glass slides (SPL Life Science) were coated with 50 μl Matrigel (BD Bioscience) per well and left to solidify for 20 min. MCF10A cells were trypsinized and resuspended in DMEM/F12 media (20% horse serum) at a concentration of 2.5 × 10⁴ cells/ml. Cold assay medium (DMEM/F12 supplemented with 2% horse serum, 10 μg/ml insulin, 10 ng/ml cholera toxin, 0.5 μg/ml hydrocortisone, penicillin/streptomycin) freshly supplemented with 5% Matrigel and 10 ng/ml EGF was mixed 1:1 with the cells and added to each chamber of the Matrigel‐coated 8‐chambered slides. Assay medium containing 2.5% Matrigel and 5 ng/ml EGF was replaced every 4 days. Acinar size was measured using ImageJ.
3D BM/COL1 matrix culture
3D Matrix cultures were conducted as described (Paszek et al, 2005; Aragona et al, 2013). Briefly, collagen 1 (Fibricol Advanced Biomatrix) was neutralized on ice with 0.1N NaOH in PBS to be adjusted to pH 7.0. Then, Matrigel (BM) was mixed with collagen 1 (COL1) solutions on ice to obtain a concentration of either 8 or 2 mg/ml. 50 μl of the BM/COL1 mixture was then mixed with 50 μl of 2× cell‐free MCF10A growth media to obtain a final collagen 1 concentration of 4 mg/ml (stiff matrix) or 1 mg/ml (soft matrix). Eight‐chambered slides were pre‐coated with these mixtures and allowed to gel at 37°C. MCF10 cells were trypsinized and resuspended in 2× MCF10A growth media at a concentration of 2 × 10⁴ cells/ml. The cells were mixed 1:1 by volume with the BM/COL1 mixture (8 or 2 mg/ml) to obtain 1,000 cells/100 μl. These cells were seeded on top of the pre‐gelled ECM in the 8‐chambered slides. After final gelling, each well was replenished with normal MCF10A growth media, which was replaced every 3 days. For isolation of cells from 3D gels, 0.02% collagenase D (Roche) and 1 mg/ml dispase were treated to gels and incubated in 37°C for 30 mins, and then, cells were centrifuged.
Glucose uptake assay
Cells were plated at a density of 60,000 cells with 200 μl media per well in 96‐well poly‐HEMA‐coated (or normal) plates. After 20 h, media was collected and centrifuged to remove debris and then diluted 1:50 in distilled water. The amount of glucose in the media was then determined using the Glucose (GO) Assay Kit (Sigma, GAGO20) according to the manufacturer's instructions. Glucose uptake was calculated by subtracting the amount of glucose in each sample from the total amount of glucose in the fresh media without cells.
Lactate production assay
Lactate production assay was performed in parallel with glucose uptake assay. Cells were plated at a density of 60,000 cells with 200 μl media per well in 96‐well poly‐HEMA‐coated (or normal) plates. After 20 h, media was collected and centrifuged to remove debris, and then, lactate concentration in each sample was determined using lactate test strips and Accutrend Lactate analyzer (Accutrend Lactate, Roche).
Tissue array analysis
The tissue arrays and corresponding patient data were obtained with informed consent by Yonsei University Severance Hospital. Immunohistochemistry was performed using YAP‐ and SKP2‐specific antibodies. The samples were scored for the level of staining as low, medium, and high. This study was approved by the Institutional Review Board of Yonsei University Severance Hospital.
GEO microarray analysis
The following breast cancer patient microarray datasets were downloaded from the NCBI GEO: GSE1456 (Pawitan et al, 2005), GSE3494 (Miller et al, 2005), GSE4922 (Ivshina et al, 2006), GSE7390 (Desmedt et al, 2007), GSE20194 (Popovici et al, 2010), GSE25066 (Itoh et al, 2014), and GSE22093 (Iwamoto et al, 2011). The microarray data were normalized and analyzed using geWorkbench. For Skp2 expression, we used probe 203625_X, which targets Skp2 isoform 1, from the Affymetrix Human Genome U133A Array. Correlations were evaluated with GraphPad Prism using the Pearson correlation test.
Data resources
The ChIP‐seq data reported in this paper has been deposited to NCBI GEO (http://www.ncbi.nlm.nih.gov/geo) under the accession number GSE97972.
Author contributions
WJ and D‐SL designed research. WJ performed experiments. TK performed ChIP‐seq. S‐KK and JSK provided breast cancer tissue arrays. WJ and D‐SL wrote the manuscript.
Conflict of interest
The authors declare that they have no conflict of interest.
Supporting information
Expanded View Figures PDF
Review Process File
Acknowledgements
We thank all our laboratory members for critical comments for manuscript, especially DaeHee Hwang and Wonyoung Choi. This work was funded by a grant from the National Creative Research Initiative Program (20120001228) and Science Research Center Program (NRF‐2016R1A5A1010764).
The EMBO Journal (2017) 36: 2510–2528
See also: RT Böttcher et al (September 2017) and T Kim et al (February 2017)
References
- Aragona M, Panciera T, Manfrin A, Giulitti S, Michielin F, Elvassore N, Dupont S, Piccolo S (2013) A mechanical checkpoint controls multicellular growth through YAP/TAZ regulation by actin‐processing factors. Cell 154: 1047–1059 [DOI] [PubMed] [Google Scholar]
- Benham‐Pyle BW, Pruitt BL, Nelson WJ (2015) Cell adhesion. Mechanical strain induces E‐cadherin‐dependent Yap1 and beta‐catenin activation to drive cell cycle entry. Science 348: 1024–1027 [DOI] [PMC free article] [PubMed] [Google Scholar]
- Carrano AC, Pagano M (2001) Role of the F‐box protein Skp2 in adhesion‐dependent cell cycle progression. J Cell Biol 153: 1381–1390 [DOI] [PMC free article] [PubMed] [Google Scholar]
- Cerami E, Gao J, Dogrusoz U, Gross BE, Sumer SO, Aksoy BA, Jacobsen A, Byrne CJ, Heuer ML, Larsson E, Antipin Y, Reva B, Goldberg AP, Sander C, Schultz N (2012) The cBio cancer genomics portal: an open platform for exploring multidimensional cancer genomics data. Cancer Discov 2: 401–404 [DOI] [PMC free article] [PubMed] [Google Scholar]
- Chan CH, Li CF, Yang WL, Gao Y, Lee SW, Feng Z, Huang HY, Tsai KK, Flores LG, Shao Y, Hazle JD, Yu D, Wei W, Sarbassov D, Hung MC, Nakayama KI, Lin HK (2012) The Skp2‐SCF E3 ligase regulates Akt ubiquitination, glycolysis, herceptin sensitivity, and tumorigenesis. Cell 149: 1098–1111 [DOI] [PMC free article] [PubMed] [Google Scholar]
- Chan CH, Morrow JK, Li CF, Gao Y, Jin G, Moten A, Stagg LJ, Ladbury JE, Cai Z, Xu D, Logothetis CJ, Hung MC, Zhang S, Lin HK (2013) Pharmacological inactivation of Skp2 SCF ubiquitin ligase restricts cancer stem cell traits and cancer progression. Cell 154: 556–568 [DOI] [PMC free article] [PubMed] [Google Scholar]
- Cordenonsi M, Zanconato F, Azzolin L, Forcato M, Rosato A, Frasson C, Inui M, Montagner M, Parenti AR, Poletti A, Daidone MG, Dupont S, Basso G, Bicciato S, Piccolo S (2011) The Hippo transducer TAZ confers cancer stem cell‐related traits on breast cancer cells. Cell 147: 759–772 [DOI] [PubMed] [Google Scholar]
- Cox AG, Hwang KL, Brown KK, Evason KJ, Beltz S, Tsomides A, O'Connor K, Galli GG, Yimlamai D, Chhangawala S, Yuan M, Lien EC, Wucherpfennig J, Nissim S, Minami A, Cohen DE, Camargo FD, Asara JM, Houvras Y, Stainier DY et al (2016) Yap reprograms glutamine metabolism to increase nucleotide biosynthesis and enable liver growth. Nat Cell Biol 18: 886–896 [DOI] [PMC free article] [PubMed] [Google Scholar]
- Cretu A, Castagnino P, Assoian R (2010) Studying the effects of matrix stiffness on cellular function using acrylamide‐based hydrogels. J Vis Exp 42: e2089 [DOI] [PMC free article] [PubMed] [Google Scholar]
- Debnath J, Mills KR, Collins NL, Reginato MJ, Muthuswamy SK, Brugge JS (2002) The role of apoptosis in creating and maintaining luminal space within normal and oncogene‐expressing mammary acini. Cell 111: 29–40 [DOI] [PubMed] [Google Scholar]
- Desmedt C, Piette F, Loi S, Wang Y, Lallemand F, Haibe‐Kains B, Viale G, Delorenzi M, Zhang Y, d'Assignies MS, Bergh J, Lidereau R, Ellis P, Harris AL, Klijn JG, Foekens JA, Cardoso F, Piccart MJ, Buyse M, Sotiriou C (2007) Strong time dependence of the 76‐gene prognostic signature for node‐negative breast cancer patients in the TRANSBIG multicenter independent validation series. Clin Cancer Res 13: 3207–3214 [DOI] [PubMed] [Google Scholar]
- Dong J, Feldmann G, Huang J, Wu S, Zhang N, Comerford SA, Gayyed MF, Anders RA, Maitra A, Pan D (2007) Elucidation of a universal size‐control mechanism in Drosophila and mammals. Cell 130: 1120–1133 [DOI] [PMC free article] [PubMed] [Google Scholar]
- Dupont S, Morsut L, Aragona M, Enzo E, Giulitti S, Cordenonsi M, Zanconato F, Le Digabel J, Forcato M, Bicciato S, Elvassore N, Piccolo S (2011) Role of YAP/TAZ in mechanotransduction. Nature 474: 179–183 [DOI] [PubMed] [Google Scholar]
- Fan R, Kim NG, Gumbiner BM (2013) Regulation of Hippo pathway by mitogenic growth factors via phosphoinositide 3‐kinase and phosphoinositide‐dependent kinase‐1. Proc Natl Acad Sci USA 110: 2569–2574 [DOI] [PMC free article] [PubMed] [Google Scholar]
- Frescas D, Pagano M (2008) Deregulated proteolysis by the F‐box proteins SKP2 and beta‐TrCP: tipping the scales of cancer. Nat Rev Cancer 8: 438–449 [DOI] [PMC free article] [PubMed] [Google Scholar]
- Galli GG, Carrara M, Yuan WC, Valdes‐Quezada C, Gurung B, Pepe‐Mooney B, Zhang T, Geeven G, Gray NS, de Laat W, Calogero RA, Camargo FD (2015) YAP drives growth by controlling transcriptional pause release from dynamic enhancers. Mol Cell 60: 328–337 [DOI] [PMC free article] [PubMed] [Google Scholar]
- Gao D, Inuzuka H, Tseng A, Chin RY, Toker A, Wei W (2009) Phosphorylation by Akt1 promotes cytoplasmic localization of Skp2 and impairs APCCdh1‐mediated Skp2 destruction. Nat Cell Biol 11: 397–408 [DOI] [PMC free article] [PubMed] [Google Scholar]
- Gao J, Aksoy BA, Dogrusoz U, Dresdner G, Gross B, Sumer SO, Sun Y, Jacobsen A, Sinha R, Larsson E (2013) Integrative analysis of complex cancer genomics and clinical profiles using the cBioPortal. Sci Signal 6: pl1 [DOI] [PMC free article] [PubMed] [Google Scholar]
- Gstaiger M, Jordan R, Lim M, Catzavelos C, Mestan J, Slingerland J, Krek W (2001) Skp2 is oncogenic and overexpressed in human cancers. Proc Natl Acad Sci USA 98: 5043–5048 [DOI] [PMC free article] [PubMed] [Google Scholar]
- Guadamillas MC, Cerezo A, Del Pozo MA (2011) Overcoming anoikis–pathways to anchorage‐independent growth in cancer. J Cell Sci 124: 3189–3197 [DOI] [PubMed] [Google Scholar]
- Halder G, Dupont S, Piccolo S (2012) Transduction of mechanical and cytoskeletal cues by YAP and TAZ. Nat Rev Mol Cell Biol 13: 591–600 [DOI] [PubMed] [Google Scholar]
- Harada K, Supriatno Kawaguchi S, Kawashima Y, Itashiki Y, Yoshida H, Sato M (2005) High expression of S‐phase kinase‐associated protein 2 (Skp2) is a strong prognostic marker in oral squamous cell carcinoma patients treated by UFT in combination with radiation. Anticancer Res 25: 2471–2475 [PubMed] [Google Scholar]
- Hershko D, Bornstein G, Ben‐Izhak O, Carrano A, Pagano M, Krausz MM, Hershko A (2001) Inverse relation between levels of p27(Kip1) and of its ubiquitin ligase subunit Skp2 in colorectal carcinomas. Cancer 91: 1745–1751 [DOI] [PubMed] [Google Scholar]
- Hershko DD (2008) Oncogenic properties and prognostic implications of the ubiquitin ligase Skp2 in cancer. Cancer 112: 1415–1424 [DOI] [PubMed] [Google Scholar]
- Hoefer J, Schafer G, Klocker H, Erb HH, Mills IG, Hengst L, Puhr M, Culig Z (2012) PIAS1 is increased in human prostate cancer and enhances proliferation through inhibition of p21. Am J Pathol 180: 2097–2107 [DOI] [PubMed] [Google Scholar]
- Inuzuka H, Gao D, Finley LW, Yang W, Wan L, Fukushima H, Chin YR, Zhai B, Shaik S, Lau AW, Wang Z, Gygi SP, Nakayama K, Teruya‐Feldstein J, Toker A, Haigis MC, Pandolfi PP, Wei W (2012) Acetylation‐dependent regulation of Skp2 function. Cell 150: 179–193 [DOI] [PMC free article] [PubMed] [Google Scholar]
- Itoh M, Iwamoto T, Matsuoka J, Nogami T, Motoki T, Shien T, Taira N, Niikura N, Hayashi N, Ohtani S, Higaki K, Fujiwara T, Doihara H, Symmans WF, Pusztai L (2014) Estrogen receptor (ER) mRNA expression and molecular subtype distribution in ER‐negative/progesterone receptor‐positive breast cancers. Breast Cancer Res Treat 143: 403–409 [DOI] [PubMed] [Google Scholar]
- Ivshina AV, George J, Senko O, Mow B, Putti TC, Smeds J, Lindahl T, Pawitan Y, Hall P, Nordgren H, Wong JE, Liu ET, Bergh J, Kuznetsov VA, Miller LD (2006) Genetic reclassification of histologic grade delineates new clinical subtypes of breast cancer. Cancer Res 66: 10292–10301 [DOI] [PubMed] [Google Scholar]
- Iwamoto T, Bianchini G, Booser D, Qi Y, Coutant C, Shiang CY, Santarpia L, Matsuoka J, Hortobagyi GN, Symmans WF, Holmes FA, O'Shaughnessy J, Hellerstedt B, Pippen J, Andre F, Simon R, Pusztai L (2011) Gene pathways associated with prognosis and chemotherapy sensitivity in molecular subtypes of breast cancer. J Natl Cancer Inst 103: 264–272 [DOI] [PubMed] [Google Scholar]
- Jaalouk DE, Lammerding J (2009) Mechanotransduction gone awry. Nat Rev Mol Cell Biol 10: 63–73 [DOI] [PMC free article] [PubMed] [Google Scholar]
- Kim M, Kim M, Lee S, Kuninaka S, Saya H, Lee H, Lee S, Lim DS (2013) cAMP/PKA signalling reinforces the LATS–YAP pathway to fully suppress YAP in response to actin cytoskeletal changes. EMBO J 32: 1543–1555 [DOI] [PMC free article] [PubMed] [Google Scholar]
- Kim T, Yang SJ, Hwang D, Song J, Kim M, Kyum Kim S, Kang K, Ahn J, Lee D, Kim MY, Kim S, Seung Koo J, Seok Koh S, Kim SY, Lim DS (2015) A basal‐like breast cancer‐specific role for SRF‐IL6 in YAP‐induced cancer stemness. Nat Commun 6: 10186 [DOI] [PMC free article] [PubMed] [Google Scholar]
- Kossatz U, Dietrich N, Zender L, Buer J, Manns MP, Malek NP (2004) Skp2‐dependent degradation of p27kip1 is essential for cell cycle progression. Genes Dev 18: 2602–2607 [DOI] [PMC free article] [PubMed] [Google Scholar]
- Levental KR, Yu H, Kass L, Lakins JN, Egeblad M, Erler JT, Fong SF, Csiszar K, Giaccia A, Weninger W, Yamauchi M, Gasser DL, Weaver VM (2009) Matrix crosslinking forces tumor progression by enhancing integrin signaling. Cell 139: 891–906 [DOI] [PMC free article] [PubMed] [Google Scholar]
- Liang J, Shao SH, Xu ZX, Hennessy B, Ding Z, Larrea M, Kondo S, Dumont DJ, Gutterman JU, Walker CL, Slingerland JM, Mills GB (2007) The energy sensing LKB1‐AMPK pathway regulates p27(kip1) phosphorylation mediating the decision to enter autophagy or apoptosis. Nat Cell Biol 9: 218–224 [DOI] [PubMed] [Google Scholar]
- Lien EC, Lyssiotis CA, Juvekar A, Hu H, Asara JM, Cantley LC, Toker A (2016) Glutathione biosynthesis is a metabolic vulnerability in PI(3)K/Akt‐driven breast cancer. Nat Cell Biol 18: 572–578 [DOI] [PMC free article] [PubMed] [Google Scholar]
- Liu J, Wei XL, Huang WH, Chen CF, Bai JW, Zhang GJ (2012) Cytoplasmic Skp2 expression is associated with p‐Akt1 and predicts poor prognosis in human breast carcinomas. PLoS ONE 7: e52675 [DOI] [PMC free article] [PubMed] [Google Scholar]
- Masuda TA, Inoue H, Sonoda H, Mine S, Yoshikawa Y, Nakayama K, Nakayama K, Mori M (2002) Clinical and biological significance of S‐phase kinase‐associated protein 2 (Skp2) gene expression in gastric carcinoma: modulation of malignant phenotype by Skp2 overexpression, possibly via p27 proteolysis. Cancer Res 62: 3819–3825 [PubMed] [Google Scholar]
- Meng Z, Moroishi T, Guan KL (2016) Mechanisms of Hippo pathway regulation. Genes Dev 30: 1–17 [DOI] [PMC free article] [PubMed] [Google Scholar]
- Miller LD, Smeds J, George J, Vega VB, Vergara L, Ploner A, Pawitan Y, Hall P, Klaar S, Liu ET, Bergh J (2005) An expression signature for p53 status in human breast cancer predicts mutation status, transcriptional effects, and patient survival. Proc Natl Acad Sci USA 102: 13550–13555 [DOI] [PMC free article] [PubMed] [Google Scholar]
- Mizuno T, Murakami H, Fujii M, Ishiguro F, Tanaka I, Kondo Y, Akatsuka S, Toyokuni S, Yokoi K, Osada H (2012) YAP induces malignant mesothelioma cell proliferation by upregulating transcription of cell cycle‐promoting genes. Oncogene 31: 5117–5122 [DOI] [PubMed] [Google Scholar]
- Moroishi T, Hansen CG, Guan KL (2015) The emerging roles of YAP and TAZ in cancer. Nat Rev Cancer 15: 73–79 [DOI] [PMC free article] [PubMed] [Google Scholar]
- Nicolay BN, Bayarmagnai B, Islam AB, Lopez‐Bigas N, Frolov MV (2011) Cooperation between dE2F1 and Yki/Sd defines a distinct transcriptional program necessary to bypass cell cycle exit. Genes Dev 25: 323–335 [DOI] [PMC free article] [PubMed] [Google Scholar]
- Paszek MJ, Zahir N, Johnson KR, Lakins JN, Rozenberg GI, Gefen A, Reinhart‐King CA, Margulies SS, Dembo M, Boettiger D, Hammer DA, Weaver VM (2005) Tensional homeostasis and the malignant phenotype. Cancer Cell 8: 241–254 [DOI] [PubMed] [Google Scholar]
- Pawitan Y, Bjohle J, Amler L, Borg AL, Egyhazi S, Hall P, Han X, Holmberg L, Huang F, Klaar S, Liu ET, Miller L, Nordgren H, Ploner A, Sandelin K, Shaw PM, Smeds J, Skoog L, Wedren S, Bergh J (2005) Gene expression profiling spares early breast cancer patients from adjuvant therapy: derived and validated in two population‐based cohorts. Breast Cancer Res 7: R953–R964 [DOI] [PMC free article] [PubMed] [Google Scholar]
- Popovici V, Chen W, Gallas BG, Hatzis C, Shi W, Samuelson FW, Nikolsky Y, Tsyganova M, Ishkin A, Nikolskaya T, Hess KR, Valero V, Booser D, Delorenzi M, Hortobagyi GN, Shi L, Symmans WF, Pusztai L (2010) Effect of training‐sample size and classification difficulty on the accuracy of genomic predictors. Breast Cancer Res 12: R5 [DOI] [PMC free article] [PubMed] [Google Scholar]
- Sanjana NE, Shalem O, Zhang F (2014) Improved vectors and genome‐wide libraries for CRISPR screening. Nat Methods 11: 783–784 [DOI] [PMC free article] [PubMed] [Google Scholar]
- Schafer ZT, Grassian AR, Song L, Jiang Z, Gerhart‐Hines Z, Irie HY, Gao S, Puigserver P, Brugge JS (2009) Antioxidant and oncogene rescue of metabolic defects caused by loss of matrix attachment. Nature 461: 109–113 [DOI] [PMC free article] [PubMed] [Google Scholar]
- Signoretti S, Di Marcotullio L, Richardson A, Ramaswamy S, Isaac B, Rue M, Monti F, Loda M, Pagano M (2002) Oncogenic role of the ubiquitin ligase subunit Skp2 in human breast cancer. J Clin Invest 110: 633–641 [DOI] [PMC free article] [PubMed] [Google Scholar] [Retracted]
- Slotky M, Shapira M, Ben‐Izhak O, Linn S, Futerman B, Tsalic M, Hershko DD (2005) The expression of the ubiquitin ligase subunit Cks1 in human breast cancer. Breast Cancer Res 7: R737–R744 [DOI] [PMC free article] [PubMed] [Google Scholar]
- Smock KJ, Nelson M, Tripp SR, Sanger WG, Abromowitch M, Cairo MS, Perkins SL (2008) Characterization of childhood precursor T‐lymphoblastic lymphoma by immunophenotyping and fluorescent in situ hybridization: a report from the Children's Oncology Group. Pediatr Blood Cancer 51: 489–494 [DOI] [PMC free article] [PubMed] [Google Scholar]
- Sonoda H, Inoue H, Ogawa K, Utsunomiya T, Masuda TA, Mori M (2006) Significance of skp2 expression in primary breast cancer. Clin Cancer Res 12: 1215–1220 [DOI] [PubMed] [Google Scholar]
- Stein C, Bardet AF, Roma G, Bergling S, Clay I, Ruchti A, Agarinis C, Schmelzle T, Bouwmeester T, Schubeler D, Bauer A (2015) YAP1 exerts its transcriptional control via TEAD‐mediated activation of enhancers. PLoS Genet 11: e1005465 [DOI] [PMC free article] [PubMed] [Google Scholar]
- Sutterluty H, Chatelain E, Marti A, Wirbelauer C, Senften M, Muller U, Krek W (1999) p45SKP2 promotes p27Kip1 degradation and induces S phase in quiescent cells. Nat Cell Biol 1: 207–214 [DOI] [PubMed] [Google Scholar]
- Takanami I (2005) The prognostic value of overexpression of Skp2 mRNA in non‐small cell lung cancer. Oncol Rep 13: 727–731 [PubMed] [Google Scholar]
- Tse JR, Engler AJ (2010) Preparation of hydrogel substrates with tunable mechanical properties. Curr Protoc Cell Biol 47: 10.16.1–10.16.16 [DOI] [PubMed] [Google Scholar]
- Tumaneng K, Schlegelmilch K, Russell RC, Yimlamai D, Basnet H, Mahadevan N, Fitamant J, Bardeesy N, Camargo FD, Guan KL (2012) YAP mediates crosstalk between the Hippo and PI(3)K‐TOR pathways by suppressing PTEN via miR‐29. Nat Cell Biol 14: 1322–1329 [DOI] [PMC free article] [PubMed] [Google Scholar]
- Wang L, Shi S, Guo Z, Zhang X, Han S, Yang A, Wen W, Zhu Q (2013) Overexpression of YAP and TAZ is an independent predictor of prognosis in colorectal cancer and related to the proliferation and metastasis of colon cancer cells. PLoS ONE 8: e65539 [DOI] [PMC free article] [PubMed] [Google Scholar] [Retracted]
- Wang W, Xiao Z‐D, Li X, Aziz KE, Gan B, Johnson RL, Chen J (2015) AMPK modulates Hippo pathway activity to regulate energy homeostasis. Nat Cell Biol 17: 490–499 [DOI] [PMC free article] [PubMed] [Google Scholar]
- Yang G, Ayala G, De Marzo A, Tian W, Frolov A, Wheeler TM, Thompson TC, Harper JW (2002) Elevated Skp2 protein expression in human prostate cancer: association with loss of the cyclin‐dependent kinase inhibitor p27 and PTEN and with reduced recurrence‐free survival. Clin Cancer Res 8: 3419–3426 [PubMed] [Google Scholar]
- Yokoi S, Yasui K, Mori M, Iizasa T, Fujisawa T, Inazawa J (2004) Amplification and overexpression of SKP2 are associated with metastasis of non‐small‐cell lung cancers to lymph nodes. Am J Pathol 165: 175–180 [DOI] [PMC free article] [PubMed] [Google Scholar]
- Yu FX, Zhao B, Guan KL (2015) Hippo pathway in organ size control, tissue homeostasis, and cancer. Cell 163: 811–828 [DOI] [PMC free article] [PubMed] [Google Scholar]
- Zanconato F, Forcato M, Battilana G, Azzolin L, Quaranta E, Bodega B, Rosato A, Bicciato S, Cordenonsi M, Piccolo S (2015) Genome‐wide association between YAP/TAZ/TEAD and AP‐1 at enhancers drives oncogenic growth. Nat Cell Biol 17: 1218–1227 [DOI] [PMC free article] [PubMed] [Google Scholar]
- Zanconato F, Cordenonsi M, Piccolo S (2016) YAP/TAZ at the roots of cancer. Cancer Cell 29: 783–803 [DOI] [PMC free article] [PubMed] [Google Scholar]
- Zhang L, Ye DX, Pan HY, Wei KJ, Wang LZ, Wang XD, Shen GF, Zhang ZY (2011) Yes‐associated protein promotes cell proliferation by activating Fos related activator‐1 in oral squamous cell carcinoma. Oral Oncol 47: 693–697 [DOI] [PubMed] [Google Scholar]
- Zhao B, Wei X, Li W, Udan RS, Yang Q, Kim J, Xie J, Ikenoue T, Yu J, Li L, Zheng P, Ye K, Chinnaiyan A, Halder G, Lai ZC, Guan KL (2007) Inactivation of YAP oncoprotein by the Hippo pathway is involved in cell contact inhibition and tissue growth control. Genes Dev 21: 2747–2761 [DOI] [PMC free article] [PubMed] [Google Scholar]
- Zhao B, Ye X, Yu J, Li L, Li W, Li S, Yu J, Lin JD, Wang CY, Chinnaiyan AM, Lai ZC, Guan KL (2008) TEAD mediates YAP‐dependent gene induction and growth control. Genes Dev 22: 1962–1971 [DOI] [PMC free article] [PubMed] [Google Scholar]
- Zhao B, Li L, Wang L, Wang CY, Yu J, Guan KL (2012) Cell detachment activates the Hippo pathway via cytoskeleton reorganization to induce anoikis. Genes Dev 26: 54–68 [DOI] [PMC free article] [PubMed] [Google Scholar]
Associated Data
This section collects any data citations, data availability statements, or supplementary materials included in this article.
Supplementary Materials
Expanded View Figures PDF
Review Process File