

Abstract
Primary cilia are sensory, antennae‐like organelles present on the surface of many cell types. They have been involved in a variety of diseases collectively termed ciliopathies. As cilia are essential regulators of cell signaling, the composition of the ciliary membrane needs to be strictly regulated. To understand regulatory processes at the ciliary membrane, we report the targeting of a genetically engineered enzyme specifically to the ciliary membrane to allow biotinylation and identification of the membrane‐associated proteome. Bioinformatic analysis of the comprehensive dataset reveals high‐stoichiometric presence of actin‐binding proteins inside the cilium. Immunofluorescence stainings and complementary interaction proteomic analyses confirm these findings. Depolymerization of branched F‐actin causes further enrichment of the actin‐binding and actin‐related proteins in cilia, including Myosin 5a (Myo5a). Interestingly, Myo5a knockout decreases ciliation while enhanced levels of Myo5a are observed in cilia upon induction of ciliary disassembly. In summary, we present a novel approach to investigate dynamics of the ciliary membrane proteome in mammalian cells and identify actin‐binding proteins as mechanosensitive components of cilia that might have important functions in cilia membrane dynamics.
Keywords: actin‐binding proteins, Myo5a, primary cilia, proximity labeling, STED
Subject Categories: Cell Adhesion, Polarity & Cytoskeleton; Membrane & Intracellular Transport; Methods & Resources
Introduction
Primary cilia (in the following text referred to as “cilia”) are sensory, antennae‐like organelles projecting from the surface of many cell types 1. Genetic alterations that affect ciliary proteins are causative for a large number of genetically overlapping and frequently syndromic human diseases nowadays summarized under the term ciliopathies 2, 3. Cilia are involved in a wide variety of cellular processes and serve as signaling platforms for an increasing number of pathways. Cilia consist of a microtubule‐based axoneme that arises from the basal body, which is a modified mother centriole. Before a ciliated cell re‐enters mitosis, the basal body has to be released, to be duplicated, and to serve as microtubule‐organizing center (MTOC) at the mitotic spindle pole 4. This requires disassembly of the entire cilium, which occurs periodically closely coupled with the cell cycle 5.
Beyond its function as cell cycle checkpoint organelle, the pivotal function of cilia is sensing the cellular microenvironment and transmitting specific signals into the interior of the cell 6, 7 shifting the attention from microtubule‐based structural components to the plasma membrane that covers cilia. This membrane has a very specialized composition of proteins involved in sensory reception and signaling 8, 9, 10. Receptors for sonic hedgehog 11, WNTs 12, PDGFs 13, and various other receptors and channels have been described as part of the ciliary membrane including several disease genes of ciliopathies, such as polycystin‐1, 2 and fibrocystin 14, 15.
Both, changes in ciliary length during the dynamic cycling of cilia as well as the coordination of different signaling pathways at the very restricted space of the ciliary membrane require regulatory processes that are not well understood. Here, we developed a highly efficient and sensitive proteomics approach that allows uncovering mechanisms underlying ciliary dynamics and signaling events specifically at the ciliary membrane, and applying this technique, we identified actin‐binding proteins as dynamic components inside the ciliary compartment.
Results and Discussion
The peroxidase APEX2 effectively biotinylates proteins at the ciliary membrane
To characterize the membrane‐associated proteome of cilia, we targeted the enzyme APEX2 to the ciliary plasma membrane. This engineered ascorbate peroxidase catalyzes H2O2‐dependent oxidation and has been used in combination with phenol‐biotin labeling for proximity‐based biotinylation of proteins in living cells which has been recently established for the mitochondrial proteome 16. To target APEX2 specifically to the ciliary membrane compartment (cmAPEX), we fused the enzyme to the cytoplasmic C‐terminus of Htr6 (Fig 1A), a G‐protein‐coupled receptor specifically targeted to the ciliary membrane 8, 17. Confocal microscopy confirmed the almost exclusive localization of cmAPEX at the cilium by co‐localization with three ciliary marker proteins acetylated tubulin (ac‐tubulin), Ift88, and Arl13b (Fig 1B). Superresolution microscopy using stimulated emission depletion (STED) revealed a patch‐like localization of cmAPEX only at the ciliary membrane (positive for Arl13b), but not at the ciliary microtubule skeleton (positive for ac‐tubulin) nor at intraflagellar transport (IFT) rafts (positive for Ift88; Fig 1B). Upon labeling the cells with biotin‐phenol and a short pulse of H2O2, APEX2 converts biotin‐phenol to highly reactive phenoxy radicals leading to biotinylation of endogenous proteins within a radius of 20 nm 16 (Fig 1A). Strikingly, biotinylated proteins were specifically detected in cilia and, as expected, only after both, labeling with biotin‐phenol and the H2O2 pulse. Staining with fluorescently labeled streptavidin followed by STED imaging was not restricted to the ciliary membrane, most probably due to diffusion or active transport of labeled proteins inside the cilium, but we observed a subtle enhancement at the ciliary membrane (Fig 1C). Importantly, biotinylation was not detectable elsewhere in the cell, while it was present but not enriched at the ciliary base. Western blot analyses of cell lysates as well as of subsequent pull‐down assays with streptavidin beads clearly showed enhanced biotinylation in stable IMCD3 cells in the presence of both biotin‐phenol and H2O2 (Fig 1D). In contrast to previous experiments using APEX for pull‐down assays 16, 18, 19, 20, a harsh elution with 4% SDS was necessary to solubilize sufficient amounts of cmAPEX‐labeled proteins. In summary, localization and function of cmAPEX confirmed its suitability to analyze the ciliary membrane‐associated proteome.
Figure 1. cmAPEX effectively biotinylates proteins at the ciliary membrane.
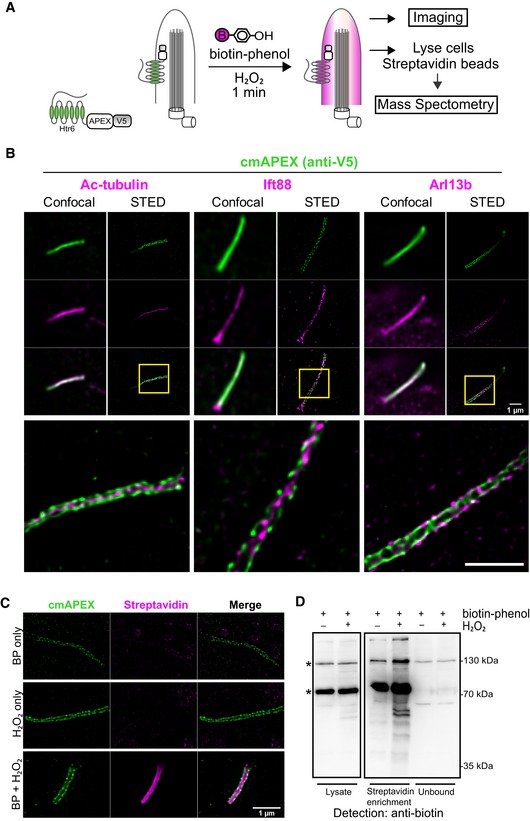
- Schematic representation of cmAPEX labeling scheme. Stable IMCD3 cells expressing cmAPEX (Htr6‐APEX2‐V5) are treated with biotin‐phenol (BP, 30 min) followed by H2O2 (1 min) to initiate labeling prior to further analyses.
- Immunofluorescence of stable cell line expressing cmAPEX. The cmAPEX fusion was detected with anti‐V5 in combination with three ciliary marker proteins (ac‐tubulin, Ift88, Arl13b) by confocal and STED microscopy. Scale bars, 1 μm.
- STED imaging of stable cells in the presence or absence of labeling reagents. Biotinylated proteins were stained with streptavidin AF568, cmAPEX with anti‐V5. Scale bar, 1 μm.
- Immunoblot analysis of labeled cells before (lysate) and after streptavidin enrichment. Biotinylated proteins were detected using an anti‐biotin antibody. * mark endogenously biotinylated proteins.
Proteomic mapping of the cilium by cmAPEX
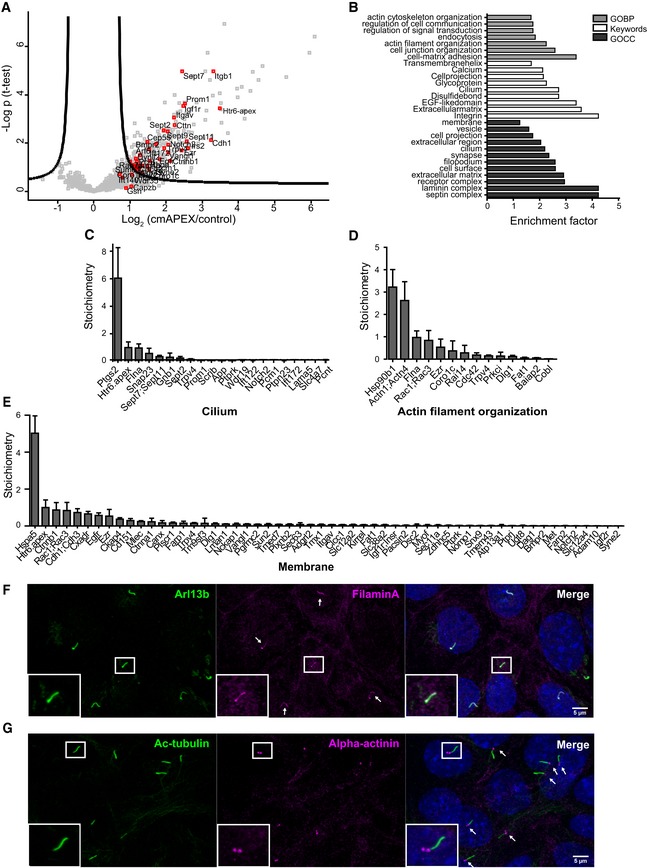
We next performed pull‐down assays followed by nLC‐MS/MS analyses. cmAPEX stable cell lines treated with only biotin‐phenol served as negative controls. In our samples, from seven independent experiments, a total number of 1,630 proteins could be identified with high confidence. To cut down the list to significantly enriched proteins, we performed a statistical analysis of label‐free quantification intensities. After applying a permutation‐based false discovery rate, our dataset identified 301 significantly enriched ciliary proteins (Fig 2A, Table EV1). We identified numerous known ciliary proteins, such as members of the IFT machinery, like Ift122, Ift144, Ift172 21, 22, 23, 24; small GTPases like Rab23, Arf6, Rhoa, Cdc42 25, 26, 27, 28; septins 2, 7, and 9; microtubule‐associated proteins like Map4 29; basal body proteins like Pcnt, Pcm1 30, 31; and several ciliary transmembrane receptors like Trpv4, Igf1r, and Egfr 32, 33, 34. In addition, we also identified a large number of novel candidate ciliary proteins. Interestingly, these include many actin‐binding proteins (ABPs) like actinins (Actn1; Actn4), tropomyosins (Tpm3; Tpm4), coronin (Coro1c), ezrin, gelsolin, cortactin, utrophin, and drebrin‐like protein. Notably, highly abundant cytoskeletal actin filament proteins such as alpha‐, beta‐, and gamma‐actin (Acta1, Actb, Actg1) were not enriched in our dataset, thereby excluding any contamination of the samples with highly abundant, non‐ciliary actin filaments.
Figure 2. Proteomic mapping of the cilium by cmAPEX .
-
AVolcano plot of protein LFQ intensities. Logarithmized ratios are plotted against the negative logarithmic P‐value of a Student's t‐test. Proteins on the right side of the curved line are determined as significantly enriched (FDR 0.7, s0: 1). Red data points represent proteins known to be involved in ciliary function.
-
BGO‐term enrichment analysis of significant ciliary proteins.
-
CStoichiometry determination of significantly enriched cilium proteins (GO:0005929). Error bars represent SEM. n = 7.
-
DStoichiometry determination of significantly enriched actin filament organization proteins (GO:0007015). Error bars represent SEM. n = 7.
-
EStoichiometry determination of selected significantly enriched intrinsic and extrinsic membrane proteins (GO:0031224; GO:0019898). Error bars represent SEM. n = 7.
-
F, GIMCD3 cells were starved for 24 h to induce ciliation and immunostained for (F) Filamin A and Arl13b or (G) alpha‐actinin and acetylated tubulin. Each arrow highlights one cilium.
To determine major biological processes and functions represented within the cmAPEX proteome, we next analyzed the dataset of 301 ciliary proteins for overrepresentation of Gene Ontology (GO) terms. As expected, GO‐term analysis revealed a significant overrepresentation of proteins related to keywords such as “cilium”, “septin complex”, and “receptor complex” (Fisher's exact test, FDR < 0.02). Surprisingly, the GO terms “cell‐matrix adhesion” and “actin filament organization” were almost equally strong enriched (Fig 2B). To extract absolute stoichiometries of the ciliary proteome composition, we used intensity‐based absolute quantification (iBAQ), a parameter corresponding to the copy numbers of proteins within a biological sample 35. iBAQ values were normalized to the abundance of the Htr6‐APEX‐V5 fusion protein. Figure 2C–E summarizes the iBAQ values of all proteins belonging to cilium (GO: cilium, primary cilium), proteins involved in actin filament organization (GO: actin filament organization), and some selected membrane proteins (GO:0019898; GO:0031224), respectively. The most abundant membrane‐associated proteins were heat‐shock protein family A (Hsp70) member (Hspa5), beta‐catenin (Ctnnb1), rho family, small GTP binding protein (Rac1 and Rac3), cadherins (Cdh1 and Cdh3), coxsackie virus and adenovirus receptor (Cxadr) as well as epidermal growth factor receptor (Egfr).
Surprisingly, plenty of proteins involved in actin filament and cytoskeleton organization were enclosed in the APEX‐based ciliary membrane‐associated proteome. A role for actin dynamics in the process of ciliogenesis and the control of ciliary length has been uncovered during the last decade (reviewed in 5, 36). In brief, ciliogenesis requires migration of centrosomes to the cell periphery where the later basal body is anchored to the cortical actin network 37, 38. In addition, cytoplasmic F‐actin negatively regulates ciliogenesis and ciliary length while depolymerization of cytoplasmic F‐actin induces ciliogenesis and cilia elongation 39. Mechanistically, actin depolymerization leads to the accumulation of Rab11/Rab8‐positive vesicles at the centrosome thereby supporting ciliogenesis 39, 40. In addition, actin depolymerization has been shown to inactivate the hippo downstream effectors YAP and TAZ that promote transcription of negative regulators of ciliogenesis such as AurA and Plk1 41. Thus, although vesicle transport and transcriptional programs might provide some explanations, the detailed mechanisms of how actin dynamics interfere with ciliary dynamics and vice versa are still unclear. To confirm the localization of ABPs in cilia, we choose two ABPs with the highest ciliary abundance according to our stoichiometric analyses (Fig 2D) and stained ciliated murine wild‐type IMCD3 cells with antibodies directed against alpha‐actinin and Filamin A. Consistent with our proteomics data and as suggested by a previous study 42, more than 95% of all cilia stained positive for endogenous Filamin A (Fig 2F). In addition, total alpha‐actinin was detected at the base of cilia in an equally high percentage of cilia (Fig 2G). We could further confirm this in human hTERT‐RPE1 cells, an immortalized cell line derived from human retinal pigmental epithelial cells which has been widely used for cilia research (Fig EV1A), and STED microscopy showed alpha‐actinin as two distinct puncta at the ciliary base (Fig EV1B). A very recent study described centrosomes to function as actin‐organizing centers (AOCs) in addition to their well‐established role as MTOCs 43. Consistently, we assume that the ciliary basal body might as well have a similar dual function as MTOC and AOC and thus might organize membrane‐associated actin networks that project into the cilium. Taken together, our cmAPEX‐based comprehensive map of the ciliary membrane‐associated proteome uncovers the presence of ABPs inside this microtubule‐based organelle suggesting a role of actin regulation in cilia biology beyond its role in vesicle transport or centrosome positioning in the forefront of ciliogenesis 38, 41.
Figure EV1. Confirmation of ciliary localization of actin‐binding proteins in human RPE1 cells.
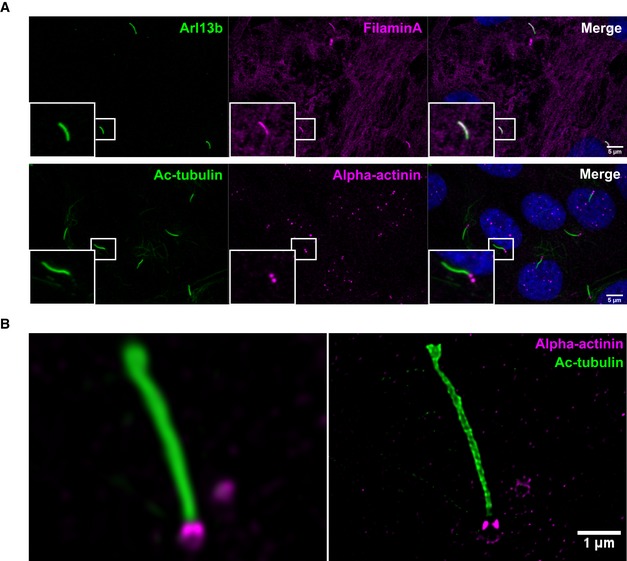
- RPE1 cells were starved for 24 h to induce ciliation and immunostained for Filamin A and Arl13b or alpha‐actinin and acetylated tubulin. Scale bar, 5 μm.
- Confocal (left panel) and STED (right panel) imaging of RPE1 cells stained with antibodies directed against alpha‐actinin and acetylated tubulin. Scale bar, 1 μm.
Affinity purification of Htr6 determines actin‐binding proteins as a part of its interactome
The presence of ABPs in cilia could further be demonstrated while studying the Htr6 interactome in a different ciliated cell line. To this end, we generated stable Flp‐in NIH3T3 cell lines containing a single copy of Htr6‐APEX‐GFP. Fluorescence microscopy confirmed the specific localization of Htr6‐APEX‐GFP in cilia (Fig 3A). We then performed immunoprecipitation of Htr6‐APEX‐GFP followed by label‐free quantitative proteomic analysis to determine the combined interactome of the protein 44. Another Flp‐in cell line expressing a single copy of GFP.GFP served as a negative control 44. As expected, Htr6 was the most enriched protein among the proteins in the pull‐down (Fig 3B). It significantly co‐purified with 49 additional proteins (Fig 3B, Table EV2). Surprisingly, most of these significantly co‐precipitating proteins were ABPs, like actin‐related protein 3 (Arp3), actin‐related protein 2/3 complex subunits (Arpc3, Arpc4, Arpc5, Arpc5l), tropomyosins (Tpm1, Tpm2, Tpm3, Tpm4), cortactin (Cttn), gelsolin (Gsn), coronins (Coro1b, Coro1c), alpha‐actinin (Actn4), and myosins (Myo6, Myl12a, Myl6b, Myl9; Fig 3C). Twelve of these proteins were enriched also in the cmAPEX dataset, 38 were complementary (Fig 3C, Table 1). Interestingly, seven out of these 12 proteins were ABPs. This demonstrates that proximity labeling and affinity purification, the two methods used in this study, are complementary which is consistent with a previous proteome study 45.
Figure 3. Quantitative proteomic analysis of Htr6 interactome.
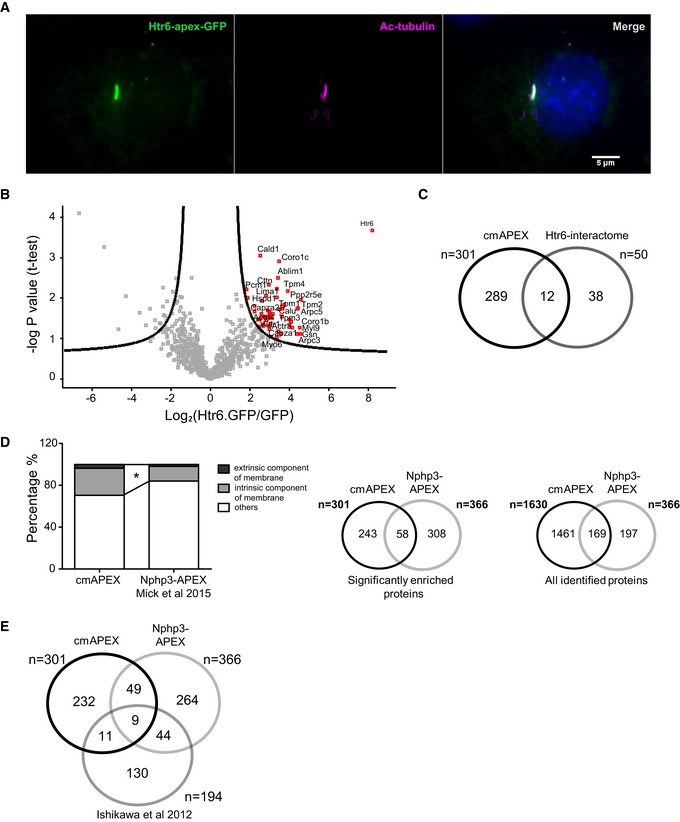
- Fluorescence microscopic analysis of Flp‐in NIH3T3 cells stably expressing Htr6‐APEX‐GFP. Scale bar, 5 μm.
- Quantitative analysis of Htr6 interactome. Cells were lysed, and GFP‐tagged Htr6 was pulled down using anti‐GFP magnetic beads. Proteins on the right side of the curved line are determined as significantly enriched (FDR = 0.2, s0 = 1). Htr6 was the most enriched protein in the pull‐down along with 49 other significant interactors.
- Venn diagram indicating numerical comparison of cmAPEX proteome with Htr6 interactome.
- Left panel: Percentage of membrane proteins (GO:0031224; GO:0019898) in our study (cmAPEX) as compared to the recent Nphp3‐APEX proteome 46 (*P < 0.0001, Fisher's exact test). Middle and right panel: Numerical comparison of proteins significantly enriched and all proteins identified in our study as compared to Nphp3‐APEX 46.
Table 1.
List of common proteins between the two proteomic approaches: cmAPEX and Htr6 interactome
| Leading Uniprot IDs | Gene name | Protein name | GO annotationa |
|---|---|---|---|
| N/A | Htr6‐apex | N/A | |
| Q6XLQ8 | Calu | Calumenin | |
| P57780 | Actn4 | Alpha‐actinin‐4 | Actin binding |
| Q9DBR7 | Ppp1r12a | Protein phosphatase 1 regulatory subunit 12A | |
| Q60598 | Cttn | Src substrate cortactin | |
| D3Z2H9 | Tpm3‐rs7 | Tropomyosin 3, related sequence 7 | Actomyosin |
| E9Q9C7 | Ablim1 | Actin‐binding LIM protein 1 | Actin binding |
| Q9EP71 | Rai14 | Ankycorbin | Actin binding |
| Q9WUM4 | Coro1c | Coronin‐1C | Actin binding |
| Q9R0L6 | Pcm1 | Pericentriolar material 1 protein | |
| Q6IRU2 | Tpm4 | Tropomyosin alpha‐4 chain | Actin‐binding |
| E9QA15 | Cald1 | Caldesmon 1 | Actin binding |
GOMF: Actin binding; Keywords: Actin‐binding; GOCC: Actomyosin.
To validate the quality of our cmAPEX dataset and of the interactome data and to confirm the membrane specificity of cmAPEX, we compared our dataset with a recently published dataset 46 in the same cell type, in which APEX has been targeted to the entire ciliary axoneme. These comparative analyses revealed an overlap of shared proteins between the two studies (Fig 3D, middle panel). Several additional candidate ciliary proteins from the previous study were also found in our dataset but not significantly enriched in the cmAPEX proteome due to statistical filtering (Fig 3D, right panel). The relatively small overlap of proteins between the two datasets could be due to several reasons. Firstly, the two studies targeted APEX to different subciliary compartments. We targeted APEX to the ciliary membrane, while in the other study, APEX was targeted to the ciliary axoneme using NPHP3, which could explain the significantly higher percentage of membrane proteins in our dataset (Fig 3D, left panel). Secondly, both studies used different controls. In addition to cells without H2O2 induction, the former study also used a mislocalized APEX as control. However, we used two different tags (V5 and GFP) in two different cell lines (IMCD3 and NIH3T3) using two different approaches (proximity labeling and affinity purification), and we identified ABPs in both methods. Finally, both studies used different statistical quantification of proteins. In this study, we used peak intensity‐based quantification (MaxQuant LFQ algorithm) 47 as compared to spectral counting used in the other study 48. These are two fundamentally different modes of quantification of MS data 49, 50. Both methods are embedded in different software environments and utilize different algorithms and statistical approaches 47, 48.
Of note, a subset of the ABPs we identified with our cmAPEX approach is part of both datasets (gelsolin, tropomyosin 3 (Tpm3) ezrin, actinins (Actn1, Actn4), cortactin, and coronin 1b) further strengthening the concept of a role of actin modulators inside cilia. Comparison of these two cilia APEX datasets with a previously described ciliary proteome 51 revealed only nine common proteins between the three datasets (Fig 3E). The obvious difference between the datasets may be explained by technical and biological reasons: In contrast to our genetic, biochemical approach to label and pull‐down ciliary proteins, the study from Ishikawa used isolated complete cilia from the cell culture supernatants that were released by calcium shock. Taken together, our cmAPEX and interactome data both identified actin‐binding proteins as novel players underneath the plasma membrane of cilia.
Actin‐binding proteins are recruited into the cilium upon actin depolymerization
Next, we aimed to study the impact of actin dynamics on the composition of the ciliary proteome and the abundance of actin‐binding proteins inside cilia. Technically, we intended to demonstrate the suitability of our cmAPEX approach to analyze subtle dynamic changes of the ciliary membrane‐associated proteome upon perturbation of cellular processes. Actin filament formation and organization of a cell depend on the stiffness of the substrate they grow on. On stiff matrices like plastic or glass, cells have thick stress fibers compared to almost negligible or thin stress fibers in the same cells grown on soft matrices 52. We cultured RPE1 cells on different soft matrices with a reduced elastic modulus resembling the surface in vivo (28, 15 and 1.5 kPA) and standard cell culture glass coverslips (~70 GPa) 53. Cells grown on soft matrix had significantly longer cilia compared to cells grown on stiff matrix or glass surface (Fig 4A) which is entirely consistent with a previous elegant study on cell shape and contractility using single‐cell analyses on micropatterned surfaces 54. However, for the proteomic analyses, we choose cytochalasin D (CytoD) treatment as a very well‐established chemical way to induce actin depolymerization and to elongate cilia 39. Inhibiting actin polymerization with CytoD significantly increased the length of cilia (Fig 4B), consistent with previous studies 39, 41. To better understand the mechanisms of cilia elongation upon actin depolymerization, we utilized the cmAPEX approach to study the effects of treatment of CytoD on the ciliary proteome. We treated the stable IMCD3 cell line expressing cmAPEX with CytoD or DMSO, and we chose to study an early time point displaying ciliary elongation (3 h of CytoD incubation, 500 nM). Moreover, we used a CytoD concentration that does not interfere with stress fibers in the cells but rather depolymerizes branched F‐actin and enhances ciliogenesis efficiently 39. Figure 4C shows the comparison of relative enrichment (expressed as log2 ratio of CytoD‐treated vs. DMSO) of ciliary proteins against the whole‐cell proteome. The analysis based on three independent pull‐down experiments reveals that most of the ciliary proteins are enriched in the pull‐down compared to the cell proteome. In addition, numerous actin‐branched network proteins, like Arpc1b, 2, 3, 4, 5 along with myosins, are stronger enriched in the cilium proteome upon treatment with CytoD as compared to other ciliary proteins (Table EV3). Several ABPs were only detectable in cilia after CytoD treatment. This supports the assumption that actin depolymerization triggers ciliary targeting of actin branch network proteins which in turn results in elongation of cilia. We next performed 2D annotation enrichment analysis to identify GO terms which are significantly different between the samples 55. The 2D enrichment analysis showed enrichment of the Arp2/3 protein complex, myosin complex, and actomyosin in the ciliary proteome upon treatment with CytoD (Fig 4D). This regulation was independent of total protein abundance.
Figure 4. Actin depolymerization leads to cilium elongation by recruiting actin‐binding proteins into the cilium.
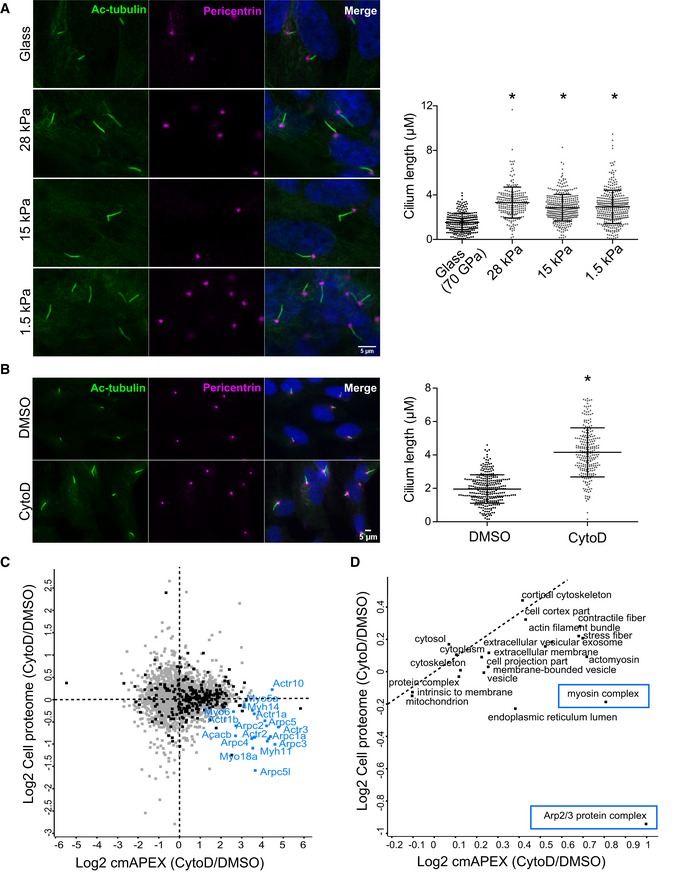
- RPE1 cells were cultured on standard cell culture glass coverslips and soft matrices of different elasticity modulus (1.5, 15, and 28 kPa). Quantification of cilium length from three independent experiments with an average of 95 cilia measured per experiment. Error bars represent SD. *P < 0.0001 (one‐way ANOVA, Dunnett's multiple comparison test). Scale bar, 5 μm.
- RPE1 cells were cultured for 24 h in serum‐free medium with DMSO or CytoD (500 nM). Quantification of cilium length from three independent experiments with an average of 90 cilia measured per experiment. Error bars represent SD. *P < 0.0001 (two‐tailed Student's t‐test). Scale bar, 5 μm.
- Comparison of relative enrichment of ciliary proteome vs. whole‐cell proteome in CytoD‐ or DMSO‐treated stable cmAPEX IMCD3 cells. Black dots represent the 301 ciliary proteins identified in the previous pull‐down experiment. Several actin‐branched network proteins along with myosins are stronger enriched in the cilium proteome upon treatment with CytoD (labeled in blue).
- 2D GO enrichment of GOCC names (FDR > 0.05).
To further confirm our observation, we again treated IMCD3 and RPE1 cells with CytoD and performed immunofluorescent stainings for significantly enriched candidate proteins. Consistent with our MS data, in which alpha‐actinin was not enriched upon CytoD treatment, we did not observe any change in the amount of ciliary alpha‐actinin stainings in response to CytoD (Fig 5A and B). When we stained for Myo5a, which was highly enriched after CytoD treatment in our MS data, we did not observe any change in the signal intensity of Myo5a staining at the ciliary base (Fig 5C and D) but a significant increase in the Myo5a accumulation in a region surrounding the ciliary base (Fig 5C and E). Strikingly, in very rare occasions, the whole cilium stained positive for Myo5a in IMCD3 cells (~1/10,000 cilia), but exclusively when cells were treated with CytoD (Fig 5C, lower panel). Interestingly, when staining RPE1 cells, we observed a much higher percentage of Myo5a‐positive cilia (Fig EV2). To confirm the specificity of the stainings and to further analyze the role of Myo5a, we generated Myo5a knockout IMCD3 cell lines using CRISPR/Cas‐9 (Fig EV3A and B). Interestingly, Myo5a KO resulted in significant reduction in ciliation (Fig EV3C) suggesting that Myo5a is required for ciliogenesis. This is consistent with a recent study demonstrating that expression of a dominant‐negative Myo5a negatively affects ciliation 56. Immunofluorescent stainings revealed loss of the Myo5a signal around the base of remaining cilia in Myo5a KO cell lines confirming the specificity of the Myo5a staining (Fig EV3D). To further decipher the role of Myo5a in cilia biology, we treated RPE1 cells with the Myo5a inhibitor pentabromopseudilin (PBP) 57 for 24 h in serum‐free medium. Consistent with the results of Myo5a KO cell line, treating the cells with PBP also led to a significant but slighter decrease in percentage of ciliated cells compared to the Myo5a KO cell lines (Fig EV3E). To further understand whether enrichment of Myo5a in the cilium upon treatment with CytoD is a cause or consequence of ciliary elongation, we added CytoD to cells treated with PBP for 24 h. There was no change in cilia number. However, we observed a subtle decrease in ciliary length upon CytoD treatment in the presence of PBP as compared to DMSO (Fig EV3E) suggesting that accumulation of Myo5a in cilia upon CytoD treatment might be one of the causes of cilia elongation. We were then speculating whether any process that requires dynamic alterations of the ciliary membrane would induce Myo5a recruitment in the cilium. Strikingly, when we treated serum‐starved ciliated cells for 45′ and 2 h with serum to induce ciliary disassembly, the number of Myo5a‐positive cilia significantly increased (Fig 5F and G) and we observed a significantly increased signal of Myo5a in these positive cilia (Fig 5H). The Myo5a signal intensity and percentage of Myo5a‐positive cilia returned to baseline after 8 h of serum addition (Fig 5G and H). At this point, we can only speculate about the detailed mechanisms leading to Myo5a enrichment in cilia. Mechanistically, Myo5a might link microtubule cargo from both sides, Golgi or cilium, with the subcortical actin network bringing it into the right place at the membrane to allow ciliary entrance or exit. Similar functions have been suggested for Myo5a in neurons for regulating axonal transport 58. This would be consistent with the predominant localization around the ciliary base.
Figure 5. Myosin 5a is enriched in the cilium and at the ciliary base upon actin depolymerization.
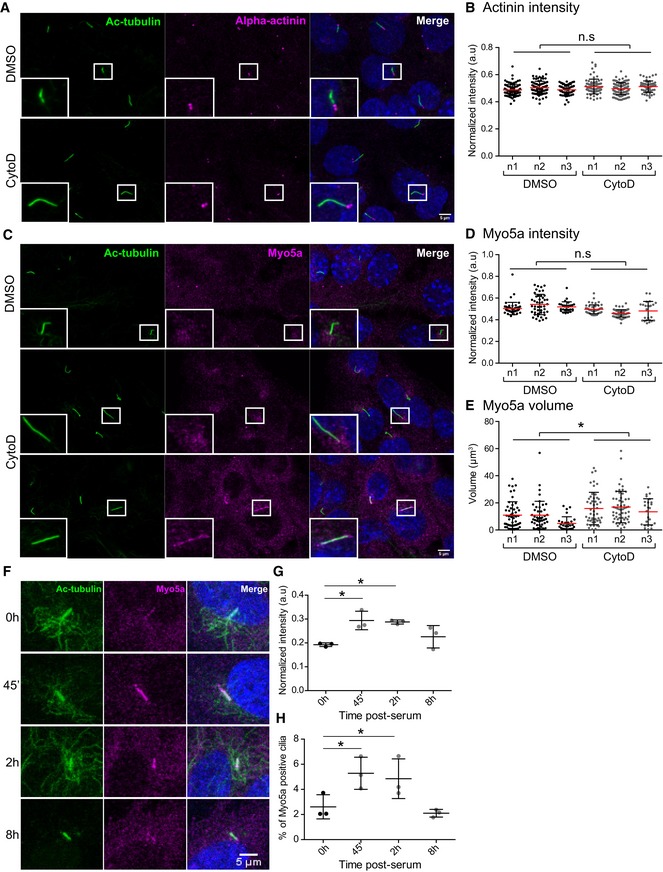
- Immunofluorescence analysis of ciliary alpha‐actinin on treating IMCD3 cells with DMSO or CytoD for 3 h. Scale bar, 5 μm.
- Graph quantifying the signal intensities of alpha‐actinin on treatment with CytoD. An average of 80 cells were counted per experiment (two‐tailed Student's t‐test).
- Immunofluorescence stainings of Myo5a primarily detectable in the region surrounding the ciliary base upon CytoD treatment. In very rare instances, Myo5a stained the entire cilia in IMCD3 cells (approx. 1/10,000 cilia), when treated with CytoD. Scale bar, 5 μm.
- Quantification of Myo5a signal intensity at the ciliary base on treatment with CytoD. An average of 45 cells counted per experiment (two‐tailed Student's t‐test).
- Quantification of accumulation of Myo5a in terms of volume around the ciliary base on treatment with CytoD. An average of 45 cells counted per experiment. *P = 0.0464 (two‐tailed Student's t‐test).
- Ciliary disassembly was induced by serum stimulation in RPE1 cells. Representative images displaying intensities of endogenous Myo5a with or without serum induction at different time points post‐serum. Scale bar, 5 μm.
- Graphs representing the signal intensities of Myo5a in the cilium at different time points post‐serum. Fifteen cells were counted per experiment. P = 0.035 (one‐way ANOVA). *P < 0.05 (Dunnett's multiple comparison test).
- Quantification of percentage of Myo5a‐positive cilia. ˜1,200 cells were counted per experiment. P = 0.0043 (one‐way ANOVA). *P < 0.05 (Dunnett's multiple comparison test).
Figure EV2. The percentage of Myo5a‐positive cilia increases upon actin depolymerization in RPE1 cells.
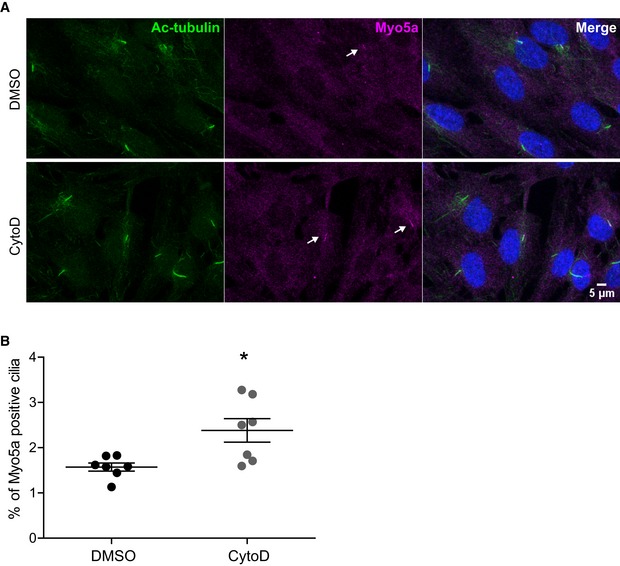
- Myo5a localizes in the cilium in RPE1 cells. Arrows indicate Myo5a‐positive cilia. Scale bar, 5 μm.
- Quantification of percentage of Myo5a‐positive cilia on treatment with CytoD. Average of seven independent experiments with ˜1,500 cells counted per experiment. Error bars, SD; *P = 0.0123 (two‐tailed Student's t‐test).
Figure EV3. Myo5a is required for ciliogenesis.
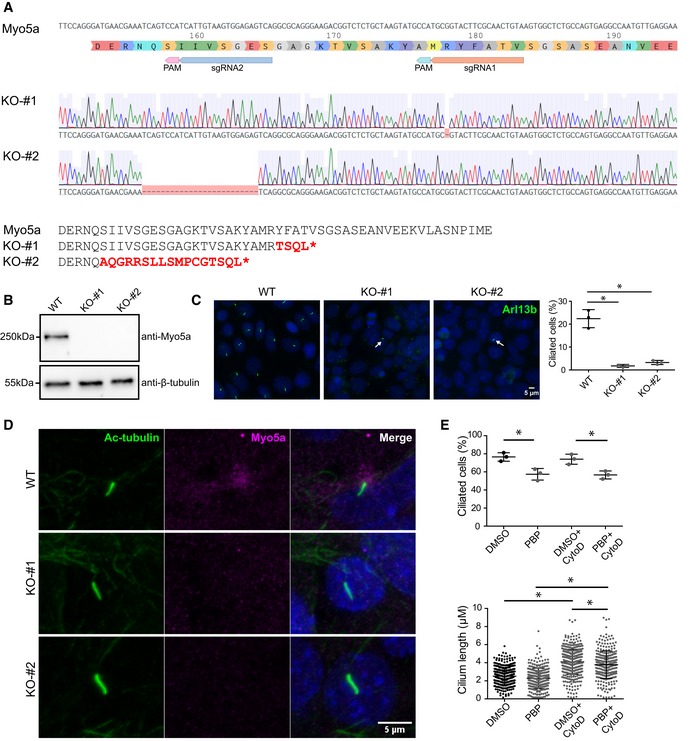
- Schematics of two single‐guide RNAs (sgRNA) targeting exon 5 of murine Myo5a for generation of Myo5a KO IMCD3 cell line using CRISPR/Cas9‐mediated genome engineering. Alignment of the Sanger sequencings from two clones is presented: One clone from sgRNA 1 (KO‐#1) shows a deletion of a single base pair resulting in a frameshift after R178 leading to a STOP codon after four additional amino acids, while another clone from sgRNA2 (KO‐#2) carries a 25‐bp deletion resulting in a frameshift after Q157 leading to a STOP codon after 17 additional amino acids.
- Loss of Myo5a was confirmed by Western blot.
- Myo5a KO led to loss of primary cilia revealed by Arl13b immunostaining and quantification. Average (± SD) of three independent experiments with ˜1,200 cells counted per experiment. P < 0.0001 (one‐way ANOVA). *P < 0.05 (Bonferroni's multiple comparison test). Arrows indicate remaining cilia in KO cells. Scale bar, 5 μm.
- Immunofluorescence staining of Myo5a knockout and control cell lines confirmed loss of Myo5a from the ciliary base in Myo5a KO cell lines. Scale bar, 5 μm.
- RPE1 cells were cultured for 24 h in serum‐free medium with DMSO or PBP (100 nM) followed by CytoD (500 nM) for 3 h. Quantification of percentage of ciliated cells [P = 0.0026 (one‐way ANOVA). *P < 0.05 (Bonferroni's multiple comparison test)] and cilium length [P < 0.0001 (one‐way ANOVA). *P < 0.05 (Bonferroni's multiple comparison test)] in DMSO‐ and PBP‐treated cells. Three independent experiments were performed with an average of 120 cells counted per experiment. Error bars show SD.
Interestingly, we identified a number of ABPs in the cilium and observed their enrichment at the ciliary membrane upon actin depolymerization. This recruitment might support the adaptation of the ciliary membrane to the elongating microtubule core or even serve to stabilize cilia and their membrane during dynamic changes in ciliary length. The role of actin in processes preceding ciliogenesis has been described previously: Ciliary biogenesis has been found to depend on cytoplasmic and cortical actin dynamics 27, 59. Here, however, we identify ABPs as integral components of cilia being part of the membrane‐associated protein network. This is suggestive for a role of ABPs in mature cilia and during dynamic regulation of ciliary length. The detailed function of the ciliary actin network needs to be further investigated. Ciliary ABPs might serve to push and pull the ciliary membrane during elongation and shortening in parallel to dynamic alteration of the microtubule core. Moreover, ABPs might either stabilize the ciliary surface or be involved in the formation of ciliary‐derived extracellular vesicles that have been described in C. elegans 60, Chlamydomonas reinhardtii 61, and mammals 62. While this paper was under review, two studies unraveled different roles of actin and ABPs in the context of cilia, including primary cilia excision and extracellular vesicle formation 63, 64. Moreover, actin networks that transmit tension via the centrosome might also link any mechanical stimuli from the cilium to the actin cytoskeleton in the cell and might therefore be a link between mechanical ciliary bending and polarity signaling. Technically, cmAPEX turns out to be a powerful technique that can be used not only to study the protein composition of cilia in steady state but also to reveal dynamic changes of the membrane‐associated proteome of this small organelle.
Materials and Methods
Cell culture
Inner medullary collecting duct 3 (IMCD3) cells were cultured in DMEM‐F12 medium (Sigma) supplemented with 10% fetal bovine serum (FBS) and 2 mM GlutaMAX (ThermoFischer). RPE‐1 cells were cultured in DMEM‐F12 medium containing 10% FBS, 2 mM GlutaMAX and 2.6 g/l sodium bicarbonate. Flp‐in NIH3T3 cells were cultured in DMEM (Sigma) with GlutaMAX supplemented with 10% FBS. To induce ciliogenesis, cells were grown to 70–80% confluency and then serum‐starved for 24 h in their respective medium as described above with no FBS supplement. All cells were maintained at 37°C in the presence of 5% CO2 without antibiotics. All cell lines were tested negative for mycoplasms. Elastic matrices with a stiffness of 1.5, 15, and 28 kPa were obtained from Ibidi (Cat. no. 81199). Before seeding the cells, the dishes were coated with 100 μg/ml collagen I diluted in 0.1% acetic acid for 24 h.
Generation of IMCD3 stable cell lines expressing cmAPEX
Mouse Htr6 and APEX2 cDNA were obtained from Addgene (plasmid #47499 17 and plasmid #49386 65, respectively). To generate a stable IMCD3 cmAPEX cell line, Htr6‐APEX was cloned into a modified pENTR1a vector (Invitrogen) followed by recombination into the pLenti6.3/V5 Dest vector, using the GATEWAY system (Invitrogen). After virus production in HEK293T cells, the IMCD3 cells were transduced with cmAPEX pLenti6.3 or vector control, and selection was performed using blasticidin (10 mg/ml).
Fluorescence analysis of cmAPEX using two‐color STED imaging
Twenty‐four hours after serum starvation, cells were rinsed with PBS and fixed with 4% PFA for 10 min. After blocking with 3% BSA and 0.1% Triton X‐100 in Dulbecco's PBS (DPBS), cells were sequentially stained with the indicated primary antibodies followed by the secondary antibodies Abberior STAR 635P anti‐mouse and Abberior STAR 580 anti‐rabbit (Abberior GmbH) for 1 h at room temperature. Afterward, the coverslips were mounted with Prolong Gold (Invitrogen) and subjected to immunofluorescence microscopy. Confocal and STED images were taken with a gSTED microscope (Leica Microsystems) equipped with a white light laser for excitation and a 775 nm laser for depletion of the two used dyes. A 100× oil immersion objective with a numerical aperture of 1.4 (Leica Microsystems) was used, and the two channels were acquired in a sequential mode. Deconvolution of the images was done by using the software Huygens Professional (Scientific Volume Imaging).
cmAPEX labeling
After 24 h of serum starvation, 500 μM of biotin‐phenol (Iris Biotech, CAS Number 41994‐02‐9) was added to the cell medium for 30 min at 37°C followed by 1 mM of H2O2 for 1 min to initiate biotinylation. After 1 min, cells were washed three times with quenching buffer (PBS supplemented with 10 mM sodium azide, 10 mM sodium ascorbate, and 5 mM Trolox). To detect biotinylation, cells were either fixed and stained with streptavidin AF568 (ThermoFischer Scientific) or lysed for Western blot or further proteomics experiments.
Enrichment of biotinylated proteins by streptavidin beads
IMCD3 cells stably expressing cmAPEX were labeled as above. The reaction was immediately stopped by washing the cells two times with quenching buffer and once with PBS. Cells were pelleted in quenching buffer by centrifugation at 162 g for 5 min. The cell pellet was resuspended in RIPA lysis buffer (50 mM Tris, 150 mM NaCl, 0.1% SDS, 0.5% sodium deoxycholate, 1% Triton X‐100, 10 mM sodium azide, 10 mM sodium ascorbate, and 5 mM Trolox) with complete protease inhibitor PIM (Roche). Cell suspension was sonicated for 10 s at 10% power (Digital Sonifier Model 450, Branson Ultrasonics) and incubated on ice for 10 min. After centrifugation at 15,000 g for 10 min at 4°C, the supernatant was incubated with streptavidin‐coated magnetic beads (Pierce 88817) for 1 h 30 min at room temperature. Before the addition of beads, a small aliquot of each supernatant was preserved and diluted with 2× SDS–PAGE sample buffer for later immunoblot analysis. Streptavidin beads were washed 2× with RIPA lysis buffer, 1× with 2 M urea in 10 mM Tris–HCL, pH 8, and then again 2× with RIPA lysis buffer. Biotinylated proteins were then eluted by boiling the beads with 4% SDS supplemented with 0.1 mM DTT for 10 min. For SDS–PAGE analysis, eluted supernatant was diluted with 2× SDS–PAGE sample buffer.
Immunoblot
Samples were resolved by SDS–PAGE and blotted onto a polyvinylidene difluoride membrane. Blots were visualized with enhanced chemiluminescence after blocking in 5% BSA followed by incubation in primary and secondary antibodies.
Acetone precipitation and in‐solution digestion
For proteomic analyses, eluted biotinylated proteins (as mentioned above) were subjected to acetone precipitation to replace SDS with 8 M urea. Cold acetone (four times the sample volume) was added to the eluted protein. The solution was then incubated at −20°C for 60 min followed by centrifugation at 15,000 g for 10 min at 4°C. After discarding the supernatant, the protein pellet was washed with 90% acetone followed by centrifugation at 15,000 g for 10 min at 4°C. The supernatant was removed and the pellet was air‐dried at room temperature for 10 min. Protein pellet was resuspended in 8 M urea. The samples were then incubated with DTT (10 mM) for 30 min followed by iodoacetamide (55 mM) for 20 min in the dark at room temperature for reduction and alkylation of disulfide bonds followed by trypsin digestion. Overnight digestion was stopped by adding 0.5% formic acid. Finally, peptides were subjected to stage tip fractionation as described before 66 before injection into the mass spectrometer.
nLC‐MS/MS
Peptides were analyzed using the quadrupole–Orbitrap‐based Q Exactive Plus mass spectrometer (Thermo Scientific). An in‐house packed 50 cm column with 1.7 μm C18 beads (Dr. Maisch GmbH) was utilized within a column oven. A binary buffer system consisting of buffer A (0.1% formic acid) and buffer B (80% acetonitrile, 0.1% formic acid) was used. Linear gradients from 7 to 38% B for 60 or 150 min were applied with a following increase to 80% B for 5 min and a re‐equilibration to 5% B. Peptides were sprayed into a quadrupole–Orbitrap‐based mass spectrometer, the Q Exactive Plus 67. MS1 spectra were acquired using 1E6 as an AGC target with a resolution was 70,000 resolution (mass range, 200–1,200 m/z). MS/MS spectra of the top 10 most intense peaks were obtained by higher‐energy collisional dissociation fragmentation. Resolution for MS/MS spectra was set to 35,000 at 200 m/z, AGC target to 5E5, max injection time to 120 ms, and the isolation window to 1.3 Th. 68.
Bioinformatic analysis
Analysis of raw files was performed using the MaxQuant version 1.5.5.0 47 using default settings with the following additional options enabled: label‐free quantification, intensity‐based absolute quantification (iBAQ), and match between runs. Raw file spectra were searched against the mouse uniprot reference database using the target‐decoy strategy (reversed database). Protein, peptide, and site false discovery rate (FDR) were adjusted to < 0.01. Protein sequence of Htr6‐APEX was added to the database enable identification of the fusion protein.
LFQ intensities for respective protein groups were uploaded in Perseus 69 and analyzed as previously described 44. Imputation of the missing values was performed when three or more values were present using the normal distribution (downshift 1.8 width = 0.3). Significantly enriched proteins were determined using a two‐sample analysis (t‐test). Permutation‐based false discovery rate (FDR) method in Perseus was used to perform multiple testing corrections. Proteins were annotated with Gene Ontology (GO) terms using Perseus annotation files and analyzed using a Fisher's exact test (using a cutoff of P = 0.05). Calculation of complex stoichiometry based on iBAQ values was performed in Microsoft Excel as previously described 70.
Generation of Flp‐in NIH3T3 stable cell line
Htr6‐APEX was subcloned into a modified pENTR1A vector. The insert was transferred into the pG‐LAP/GFP destination vector via LR clonase reaction (GATEWAY System, Invitrogen). Flp‐in NIH3T3 cell was transfected as described earlier in 44.
Immunoprecipitation for MS
Immunoprecipitation of stable Flp‐in cell lines was performed using anti‐eGFP antibody covalently coupled to magnetic beads (10829018, Miltenyi Biotec) as described in 44, and samples were subjected to nLC‐MS/MS as described above (nLC‐MS/MS).
Small molecule inhibitor treatment
Cytochalasin D (final conc. 500 nM, Sigma, CAS Number 22144‐77‐0) and pentabromopseudilin (final conc. 100 nM, Biomol, CAS Number 10245‐81‐5) were resuspended in DMSO and added to the cell medium in the absence of serum for indicated times. An equivalent amount of DMSO was used as a vehicle control.
Quantification and statistical analysis
Ciliary base signal intensity and volume (Figs 5 and EV3) were calculated using the Imaris 8.4 (Bitplane) software. For quantification of percentage of ciliated cells, we acquired large three‐dimensional overview images using the tile scan option of the confocal microscope. Percentage of ciliated cells was calculated by dividing numbers of cilia by the number of nuclei. Nuclei were counted using the spot detection algorithm in Imaris, whereas cilia were counted manually. Cilia length (Figs 4 and EV3) was measured using Fiji/ImageJ software (version 1.50) 71. Cilia were manually thresholded, and binarized cilia were measured using the AnalyzeSkeleton plug‐in 72. Tests used to analyze the data were done using Prism 5.04 (GraphPad) and are mentioned in the respective figure legends.
Generation of Myo5a KO IMCD3 cell line
Two single‐guide (sg)RNAs targeting different sites of exon 5 of murine Myo5a were designed with the CRISPR Finder tool (http://www.sanger.ac.uk/htgt/wge/) 73. Sequence editing was done using benchling (http://benchling.com). Myo5a consists of 1853 amino acids (Ref. Seq: NM_010864) and exon 5 encodes for amino acid residues 153–204, comprises the motor domain, and is present in all isoforms containing the motor domain. The selected sgRNA sequences are (i) 5′‐TACAGTTGCGAAGTACCGCA‐3′ and (ii) 5′‐TGACTCTCCACTTACAATGA‐3′. The sgRNAs were cloned into PX458. pSpCas9(BB)‐2A‐GFP (PX458) was a gift from Feng Zhang (Addgene plasmid # 48138) 74.
mIMCD3 (ATCC CRL‐2123) were transiently transfected with the CRISPR/Cas9 plasmid either encoding for sgRNA1 or encoding for sgRNA2 using Lipofectamine 2000. 48 h later, GFP‐positive cells were sorted into 96‐well plates on a BD FACSAria™ III. A first screening was performed by PCR after DNA extraction. Therefore, a 461‐bp amplicon was generated with the primers 5′‐TGCCAGTACTACAGAGTTGTCC‐3′ and 5′‐ACTTCAGTGGCTGGAAACCTT‐3′ flanking exon 5. Identified positive clones were further confirmed by Sanger sequencing and finally verified by Western blotting.
Antibodies
Primary antibodies
| Antibody | Company | Species | Application | Dilution | Cat. Number |
|---|---|---|---|---|---|
| V5 Tag | Millipore | Rabbit, polyclonal | IF | 1:1,000 | AB3792 |
| V5 Tag | Serotec | Mouse, monoclonal | IF | 1:1,000 | MCA1360 |
| Ac‐tubulin | Sigma | Mouse, monoclonal | IF | 1:1,000 | T6793 |
| Ift88 | ProteinTech | Rabbit, polyclonal | IF | 1:500 | 13967‐1‐AP |
| Arl13b | ProteinTech | Rabbit, polyclonal | IF | 1:500 | 17711‐1‐AP |
| Pericentrin | Abcam | Rabbit, polyclonal | IF | 1:1,000 | AB4448 |
| Biotin | Cell Signaling | Rabbit, monoclonal | Western blot | 1:1,000 | #5597 |
| alpha‐actinin | Cell Signaling | Rabbit, monoclonal | IF | 1:100 | #6487 |
| Filamin A | Chemicon | Mouse, monoclonal | IF | 1:100 | MAB1678 |
| Myosin 5a | Cell Signaling | Rabbit, polyclonal | IF, Western blot | 1:200, 1:1,000 | #3402 |
| β‐Tubulin | Sigma | Mouse, monoclonal | Western blot | 1:1,000 | T0198 |
Secondary antibodies and other dyes
| Antibody | Company | Application | Dilution | Cat. Number |
|---|---|---|---|---|
| Goat anti‐mouse STAR 635P | Abberior | IF, STED | 1:2,000 | 2‐0002‐007‐5 |
| Goat anti‐rabbit STAR 580 | Abberior | IF, STED | 1:2,000 | 2‐0012‐005‐8 |
| Rabbit anti‐goat, HRP coupled | Dako | Western blot, ECL | 1:30,000 | E046601‐2 |
| Donkey anti‐rabbit, A488 | Jackson ImmunoResearch | IF | 1:500 | 711‐546‐152 |
| Donkey anti‐mouse Cy3 | Jackson ImmunoResearch | IF | 1:500 | 715‐165‐150 |
| Donkey anti‐mouse A488 | Jackson ImmunoResearch | IF | 1:500 | 715‐545‐150 |
| Phalloidin, 568 | Biotium | IF | 1:250 | 00044 |
| Streptavidin, AF568 | Life technologies | IF | 1:2,000 | S‐11226 |
Data availability
The cmAPEX and Htr6 interactome mass spectrometry proteomics data from this publication have been deposited to the ProteomeXchange Consortium via the PRIDE 75 partner repository with the dataset identifier PXD005201 and PXD005926, respectively.
Author contributions
BS, MMR, and TB conceived the project. PK, MMR, and BS designed the research. PK, SB, and LKE conducted experiments. PK and MMR analyzed the data. PK, CJ, and ACS performed imaging and analyzed imaging data. MH wrote the macro in Fiji/ImageJ for analyzing cilia length. PK, MMR, and MH designed the figures. PK, MMR, and BS wrote most of the paper.
Conflict of interest
The authors declare that they have no conflict of interest.
Supporting information
Expanded View Figures PDF
Table EV1
Table EV2
Table EV3
Review Process File
Acknowledgements
We would like to thank Ruth Herzog and Stefanie Keller for expert technical assistance. We acknowledge the help of the CECAD proteomics core facility. We thank the FACS & IMAGING Core Facility at Max Plank Institute for Biology of Ageing, Cologne, for assisting with sorting cells for generation of Myo5a KO cell lines. In addition, we would like to express our gratitude to all members of our laboratory for helpful discussions and support. Funding: This study was supported by the University of Cologne [UoC Postdoc Grant (M.M.R.)], by the German Research Foundation (DFG; SCHE1562/2 and SCHE1562/6 (to B.S.) and SFB829 (to T.B.). B.S. was also supported by the German Federal Ministry of Research and Education (BMBF grant 01GM1515; NEOCYST consortium.). M.M.R was supported by University of Cologne (UoC Postdoc Grant), the Fritz‐Scheler‐Stipendium, and the Köln Fortune Program (Medical Faculty, UoC).
EMBO Reports (2017) 18: 1521–1535
References
- 1. Gerdes JM, Davis EE, Katsanis N (2009) The vertebrate primary cilium in development, homeostasis, and disease. Cell 137: 32–45 [DOI] [PMC free article] [PubMed] [Google Scholar]
- 2. Bettencourt‐Dias M, Hildebrandt F, Pellman D, Woods G, Godinho SA (2011) Centrosomes and cilia in human disease. Trends Genet 27: 307–315 [DOI] [PMC free article] [PubMed] [Google Scholar]
- 3. Hildebrandt F, Benzing T, Katsanis N (2011) Ciliopathies. N Engl J Med 364: 1533–1543 [DOI] [PMC free article] [PubMed] [Google Scholar]
- 4. Bettencourt‐Dias M, Carvalho‐Santos Z (2008) Double life of centrioles: CP110 in the spotlight. Trends Cell Biol 18: 8–11 [DOI] [PubMed] [Google Scholar]
- 5. Liang Y, Meng D, Zhu B, Pan J (2016) Mechanism of ciliary disassembly. Cell Mol Life Sci 73: 1787–1802 [DOI] [PMC free article] [PubMed] [Google Scholar]
- 6. Pazour GJ, Witman GB (2003) The vertebrate primary cilium is a sensory organelle. Curr Opin Cell Biol 15: 105–110 [DOI] [PubMed] [Google Scholar]
- 7. Pedersen LB, Mogensen JB, Christensen ST (2016) Endocytic control of cellular signaling at the primary cilium. Trends Biochem Sci 41: 784–797 [DOI] [PubMed] [Google Scholar]
- 8. Berbari NF, Johnson AD, Lewis JS, Askwith CC, Mykytyn K (2008) Identification of ciliary localization sequences within the third intracellular loop of G protein‐coupled receptors. Mol Biol Cell 19: 1540–1547 [DOI] [PMC free article] [PubMed] [Google Scholar]
- 9. Garcia‐Gonzalo FR, Reiter JF (2012) Scoring a backstage pass: mechanisms of ciliogenesis and ciliary access. J Cell Biol 197: 697–709 [DOI] [PMC free article] [PubMed] [Google Scholar]
- 10. Singla V, Reiter JF (2006) The primary cilium as the cell's antenna: signaling at a sensory organelle. Science 313: 629–633 [DOI] [PubMed] [Google Scholar]
- 11. Huangfu D, Liu A, Rakeman AS, Murcia NS, Niswander L, Anderson KV (2003) Hedgehog signalling in the mouse requires intraflagellar transport proteins. Nature 426: 83–87 [DOI] [PubMed] [Google Scholar]
- 12. Lancaster MA, Schroth J, Gleeson JG (2011) Subcellular spatial regulation of canonical Wnt signalling at the primary cilium. Nat Cell Biol 13: 700–707 [DOI] [PMC free article] [PubMed] [Google Scholar]
- 13. Schneider L, Clement CA, Teilmann SC, Pazour GJ, Hoffmann EK, Satir P, Christensen ST (2005) PDGFRalphaalpha signaling is regulated through the primary cilium in fibroblasts. Curr Biol 15: 1861–1866 [DOI] [PubMed] [Google Scholar]
- 14. Ward CJ, Yuan D, Masyuk TV, Wang X, Punyashthiti R, Whelan S, Bacallao R, Torra R, LaRusso NF, Torres VE et al (2003) Cellular and subcellular localization of the ARPKD protein; fibrocystin is expressed on primary cilia. Hum Mol Genet 12: 2703–2710 [DOI] [PubMed] [Google Scholar]
- 15. Yoder BK, Hou X, Guay‐Woodford LM (2002) The polycystic kidney disease proteins, polycystin‐1, polycystin‐2, polaris, and cystin, are co‐localized in renal cilia. J Am Soc Nephrol 13: 2508–2516 [DOI] [PubMed] [Google Scholar]
- 16. Rhee H‐W, Zou P, Udeshi ND, Martell JD, Mootha VK, Carr SA, Ting AY (2013) Proteomic mapping of mitochondria in living cells via spatially restricted enzymatic tagging. Science 339: 1328–1331 [DOI] [PMC free article] [PubMed] [Google Scholar]
- 17. Su S, Phua SC, DeRose R, Chiba S, Narita K, Kalugin PN, Katada T, Kontani K, Takeda S, Inoue T (2013) Genetically encoded calcium indicator illuminates calcium dynamics in primary cilia. Nat Methods 10: 1105–1107 [DOI] [PMC free article] [PubMed] [Google Scholar]
- 18. Chen C‐L, Hu Y, Udeshi ND, Lau TY, Wirtz‐Peitz F, He L, Ting AY, Carr SA, Perrimon N (2015) Proteomic mapping in live Drosophila tissues using an engineered ascorbate peroxidase. Proc Natl Acad Sci USA 112: 12093–12098 [DOI] [PMC free article] [PubMed] [Google Scholar]
- 19. Hung V, Zou P, Rhee H‐W, Udeshi ND, Cracan V, Svinkina T, Carr SA, Mootha VK, Ting AY (2014) Proteomic mapping of the human mitochondrial intermembrane space in live cells via ratiometric APEX tagging. Mol Cell 55: 332–341 [DOI] [PMC free article] [PubMed] [Google Scholar]
- 20. Hwang J, Espenshade PJ (2016) Proximity‐dependent biotin labelling in yeast using the engineered ascorbate peroxidase APEX2. Biochem J 473: 2463–2469 [DOI] [PMC free article] [PubMed] [Google Scholar]
- 21. Coussa R, Otto E, Gee H‐Y, Arthurs P, Ren H, Lopez I, Keser V, Fu Q, Faingold R, Khan A et al (2013) WDR19: an ancient, retrograde, intraflagellar ciliary protein is mutated in autosomal recessive retinitis pigmentosa and in Senior‐Loken syndrome. Clin Genet 84: 150–159 [DOI] [PMC free article] [PubMed] [Google Scholar]
- 22. Gorivodsky M, Mukhopadhyay M, Wilsch‐Braeuninger M, Phillips M, Teufel A, Kim C, Malik N, Huttner W, Westphal H (2009) Intraflagellar transport protein 172 is essential for primary cilia formation and plays a vital role in patterning the mammalian brain. Dev Biol 325: 24–32 [DOI] [PMC free article] [PubMed] [Google Scholar]
- 23. Liem KF, Ashe A, He M, Satir P, Moran J, Beier D, Wicking C, Anderson KV (2012) The IFT‐A complex regulates Shh signaling through cilia structure and membrane protein trafficking. J Cell Biol 197: 789–800 [DOI] [PMC free article] [PubMed] [Google Scholar]
- 24. Qin J, Lin Y, Norman RX, Ko HW, Eggenschwiler JT (2011) Intraflagellar transport protein 122 antagonizes Sonic Hedgehog signaling and controls ciliary localization of pathway components. Proc Natl Acad Sci USA 108: 1456–1461 [DOI] [PMC free article] [PubMed] [Google Scholar]
- 25. Eggenschwiler JT, Espinoza E, Anderson KV (2001) Rab23 is an essential negative regulator of the mouse Sonic hedgehog signalling pathway. Nature 412: 194–198 [DOI] [PubMed] [Google Scholar]
- 26. Fan S, Whiteman EL, Hurd TW, McIntyre JC, Dishinger JF, Liu CJ, Martens JR, Verhey KJ, Sajjan U, Margolis B (2011) Induction of Ran GTP drives ciliogenesis. Mol Biol Cell 22: 4539–4548 [DOI] [PMC free article] [PubMed] [Google Scholar]
- 27. Pan J, You Y, Huang T, Brody SL (2007) RhoA‐mediated apical actin enrichment is required for ciliogenesis and promoted by Foxj1. J Cell Sci 120: 1868–1876 [DOI] [PubMed] [Google Scholar]
- 28. Zuo X, Fogelgren B, Lipschutz JH (2011) The small GTPase Cdc42 is necessary for primary ciliogenesis in renal tubular epithelial cells. J Biol Chem 286: 22469–22477 [DOI] [PMC free article] [PubMed] [Google Scholar]
- 29. Ghossoub R, Hu Q, Failler M, Rouyez M‐C, Spitzbarth B, Mostowy S, Wolfrum U, Saunier S, Cossart P, Nelson WJ et al (2013) Septins 2, 7 and 9 and MAP4 colocalize along the axoneme in the primary cilium and control ciliary length. J Cell Sci 126: 2583–2594 [DOI] [PMC free article] [PubMed] [Google Scholar]
- 30. Mühlhans J, Brandstätter JH, Giessl A (2011) The centrosomal protein pericentrin identified at the basal body complex of the connecting cilium in mouse photoreceptors. PLoS One 6: e26496 [DOI] [PMC free article] [PubMed] [Google Scholar]
- 31. Wang G, Chen Q, Zhang X, Zhang B, Zhuo X, Liu J, Jiang Q, Zhang C (2013) PCM1 recruits Plk1 to the pericentriolar matrix to promote primary cilia disassembly before mitotic entry. J Cell Sci 126: 1355–1365 [DOI] [PubMed] [Google Scholar]
- 32. Köttgen M, Buchholz B, Garcia‐Gonzalez MA, Kotsis F, Fu X, Doerken M, Boehlke C, Steffl D, Tauber R, Wegierski T et al (2008) TRPP2 and TRPV4 form a polymodal sensory channel complex. J Cell Biol 182: 437–447 [DOI] [PMC free article] [PubMed] [Google Scholar]
- 33. Ma R, Li W‐P, Rundle D, Kong J, Akbarali HI, Tsiokas L (2005) PKD2 functions as an epidermal growth factor‐activated plasma membrane channel. Mol Cell Biol 25: 8285–8298 [DOI] [PMC free article] [PubMed] [Google Scholar]
- 34. Zhu D, Shi S, Wang H, Liao K (2009) Growth arrest induces primary‐cilium formation and sensitizes IGF‐1‐receptor signaling during differentiation induction of 3T3‐L1 preadipocytes. J Cell Sci 122: 2760–2768 [DOI] [PubMed] [Google Scholar]
- 35. Schwanhäusser B, Busse D, Li N, Dittmar G, Schuchhardt J, Wolf J, Chen W, Selbach M (2011) Global quantification of mammalian gene expression control. Nature 473: 337–342 [DOI] [PubMed] [Google Scholar]
- 36. Yan X, Zhu X (2013) Branched F‐actin as a negative regulator of cilia formation. Exp Cell Res 319: 147–151 [DOI] [PubMed] [Google Scholar]
- 37. Antoniades I, Stylianou P, Skourides PA (2014) Making the connection: ciliary adhesion complexes anchor basal bodies to the actin cytoskeleton. Dev Cell 28: 70–80 [DOI] [PubMed] [Google Scholar]
- 38. Hong H, Kim J, Kim J (2015) Myosin heavy chain 10 (MYH10) is required for centriole migration during the biogenesis of primary cilia. Biochem Biophys Res Commun 461: 180–185 [DOI] [PubMed] [Google Scholar]
- 39. Kim J, Lee JE, Heynen‐Genel S, Suyama E, Ono K, Lee K, Ideker T, Aza‐Blanc P, Gleeson JG (2010) Functional genomic screen for modulators of ciliogenesis and cilium length. Nature 464: 1048–1051 [DOI] [PMC free article] [PubMed] [Google Scholar]
- 40. Cao J, Shen Y, Zhu L, Xu Y, Zhou Y, Wu Z, Li Y, Yan X, Zhu X (2012) miR‐129‐3p controls cilia assembly by regulating CP110 and actin dynamics. Nat Cell Biol 14: 697–706 [DOI] [PubMed] [Google Scholar]
- 41. Kim J, Jo H, Hong H, Kim MH, Kim JM, Lee J‐K, Heo WD, Kim J (2015) Actin remodelling factors control ciliogenesis by regulating YAP/TAZ activity and vesicle trafficking. Nat Commun 6: 6781 [DOI] [PubMed] [Google Scholar]
- 42. Adams M, Simms RJ, Abdelhamed Z, Dawe HR, Szymanska K, Logan CV, Wheway G, Pitt E, Gull K, Knowles MA et al (2012) A meckelin‐filamin A interaction mediates ciliogenesis. Hum Mol Genet 21: 1272–1286 [DOI] [PMC free article] [PubMed] [Google Scholar]
- 43. Farina F, Gaillard J, Guérin C, Couté Y, Sillibourne J, Blanchoin L, Théry M (2016) The centrosome is an actin‐organizing centre. Nat Cell Biol 18: 65–75 [DOI] [PMC free article] [PubMed] [Google Scholar]
- 44. Kohli P, Bartram MP, Habbig S, Pahmeyer C, Lamkemeyer T, Benzing T, Schermer B, Rinschen MM (2014) Label‐free quantitative proteomic analysis of the YAP/TAZ interactome. Am J Physiol Cell Physiol 306: C805–C818 [DOI] [PubMed] [Google Scholar]
- 45. Lambert J‐P, Tucholska M, Go C, Knight JDR, Gingras A‐C (2015) Proximity biotinylation and affinity purification are complementary approaches for the interactome mapping of chromatin‐associated protein complexes. J Proteomics 118: 81–94 [DOI] [PMC free article] [PubMed] [Google Scholar]
- 46. Mick DU, Rodrigues RB, Leib RD, Adams CM, Chien AS, Gygi SP, Nachury MV (2015) Proteomics of primary cilia by proximity labeling. Dev Cell 35: 497–512 [DOI] [PMC free article] [PubMed] [Google Scholar]
- 47. Cox J, Mann M (2008) MaxQuant enables high peptide identification rates, individualized p.p.b.‐range mass accuracies and proteome‐wide protein quantification. Nat Biotechnol 26: 1367–1372 [DOI] [PubMed] [Google Scholar]
- 48. Zybailov B, Mosley AL, Sardiu ME, Coleman MK, Florens L, Washburn MP (2006) Statistical analysis of membrane proteome expression changes in Saccharomyces c erevisiae. J Proteome Res 5: 2339–2347 [DOI] [PubMed] [Google Scholar]
- 49. Neilson KA, Ali NA, Muralidharan S, Mirzaei M, Mariani M, Assadourian G, Lee A, van Sluyter SC, Haynes PA (2011) Less label, more free: approaches in label‐free quantitative mass spectrometry. Proteomics 11: 535–553 [DOI] [PubMed] [Google Scholar]
- 50. Blein‐Nicolas M, Zivy M (2016) Thousand and one ways to quantify and compare protein abundances in label‐free bottom‐up proteomics. Biochim Biophys Acta 1864: 883–895 [DOI] [PubMed] [Google Scholar]
- 51. Ishikawa H, Thompson J, Yates JR, Marshall WF (2012) Proteomic analysis of mammalian primary cilia. Curr Biol 22: 414–419 [DOI] [PMC free article] [PubMed] [Google Scholar]
- 52. Discher DE, Janmey P, Wang Y‐L (2005) Tissue cells feel and respond to the stiffness of their substrate. Science 310: 1139–1143 [DOI] [PubMed] [Google Scholar]
- 53. Gilbert PM, Havenstrite KL, Magnusson KEG, Sacco A, Leonardi NA, Kraft P, Nguyen NK, Thrun S, Lutolf MP, Blau HM (2010) Substrate elasticity regulates skeletal muscle stem cell self‐renewal in culture. Science 329: 1078–1081 [DOI] [PMC free article] [PubMed] [Google Scholar]
- 54. Pitaval A, Tseng Q, Bornens M, Théry M (2010) Cell shape and contractility regulate ciliogenesis in cell cycle‐arrested cells. J Cell Biol 191: 303–312 [DOI] [PMC free article] [PubMed] [Google Scholar]
- 55. Cox J, Mann M (2012) 1D and 2D annotation enrichment: a statistical method integrating quantitative proteomics with complementary high‐throughput data. BMC Bioinformatics 13(Suppl. 16): S12 [DOI] [PMC free article] [PubMed] [Google Scholar]
- 56. Assis LHP, Silva‐Junior RMP, Dolce LG, Alborghetti MR, Honorato RV, Nascimento AFZ, Melo‐Hanchuk TD, Trindade DM, Tonoli CCC, Santos CT et al (2017) The molecular motor Myosin Va interacts with the cilia‐centrosomal protein RPGRIP1L. Sci Rep 7: 43692 [DOI] [PMC free article] [PubMed] [Google Scholar]
- 57. Fedorov R, Böhl M, Tsiavaliaris G, Hartmann FK, Taft MH, Baruch P, Brenner B, Martin R, Knölker H‐J, Gutzeit HO et al (2009) The mechanism of pentabromopseudilin inhibition of myosin motor activity. Nat Struct Mol Biol 16: 80–88 [DOI] [PubMed] [Google Scholar]
- 58. Bridgman PC (2004) Myosin‐dependent transport in neurons. J Neurobiol 58: 164–174 [DOI] [PubMed] [Google Scholar]
- 59. Rao Y, Hao R, Wang B, Yao T‐P (2014) A Mec17‐Myosin II effector axis coordinates microtubule acetylation and actin dynamics to control primary cilium biogenesis. PLoS One 9: e114087 [DOI] [PMC free article] [PubMed] [Google Scholar]
- 60. Maguire JE, Silva M, Nguyen KCQ, Hellen E, Kern AD, Hall DH, Barr MM (2015) Myristoylated CIL‐7 regulates ciliary extracellular vesicle biogenesis. Mol Biol Cell 26: 2823–2832 [DOI] [PMC free article] [PubMed] [Google Scholar]
- 61. Wood CR, Huang K, Diener DR, Rosenbaum JL (2013) The cilium secretes bioactive ectosomes. Curr Biol 23: 906–911 [DOI] [PMC free article] [PubMed] [Google Scholar]
- 62. Hogan MC, Manganelli L, Woollard JR, Masyuk AI, Masyuk TV, Tammachote R, Huang BQ, Leontovich AA, Beito TG, Madden BJ et al (2009) Characterization of PKD protein‐positive exosome‐like vesicles. J Am Soc Nephrol 20: 278–288 [DOI] [PMC free article] [PubMed] [Google Scholar]
- 63. Phua SC, Chiba S, Suzuki M, Su E, Roberson EC, Pusapati GV, Setou M, Rohatgi R, Reiter JF, Ikegami K et al (2017) Dynamic remodeling of membrane composition drives cell cycle through primary cilia excision. Cell 168: 264–279.e15 [DOI] [PMC free article] [PubMed] [Google Scholar]
- 64. Nager AR, Goldstein JS, Herranz‐Pérez V, Portran D, Ye F, Garcia‐Verdugo JM, Nachury MV (2017) An actin network dispatches ciliary gpcrs into extracellular vesicles to modulate signaling. Cell 168: 252–263.e14 [DOI] [PMC free article] [PubMed] [Google Scholar]
- 65. Lam SS, Martell JD, Kamer KJ, Deerinck TJ, Ellisman MH, Mootha VK, Ting AY (2015) Directed evolution of APEX2 for electron microscopy and proximity labeling. Nat Methods 12: 51–54 [DOI] [PMC free article] [PubMed] [Google Scholar]
- 66. Rappsilber J, Mann M, Ishihama Y (2007) Protocol for micro‐purification, enrichment, pre‐fractionation and storage of peptides for proteomics using StageTips. Nat Protoc 2: 1896–1906 [DOI] [PubMed] [Google Scholar]
- 67. Michalski A, Damoc E, Hauschild J‐P, Lange O, Wieghaus A, Makarov A, Nagaraj N, Cox J, Mann M, Horning S (2011) Mass spectrometry‐based proteomics using Q Exactive, a high‐performance benchtop quadrupole Orbitrap mass spectrometer. Mol Cell Proteomics 10: M111.011015 [DOI] [PMC free article] [PubMed] [Google Scholar]
- 68. Rinschen MM, Bharill P, Wu X, Kohli P, Reinert MJ, Kretz O, Saez I, Schermer B, Höhne M, Bartram MP et al (2016) The ubiquitin ligase Ubr4 controls stability of podocin/MEC‐2 supercomplexes. Hum Mol Genet 25: 1328–1344 [DOI] [PMC free article] [PubMed] [Google Scholar]
- 69. Tyanova S, Temu T, Sinitcyn P, Carlson A, Hein MY, Geiger T, Mann M, Cox J (2016) The Perseus computational platform for comprehensive analysis of (prote)omics data. Nat Methods 13: 731–740 [DOI] [PubMed] [Google Scholar]
- 70. Smits AH, Jansen PWTC, Poser I, Hyman AA, Vermeulen M (2013) Stoichiometry of chromatin‐associated protein complexes revealed by label‐free quantitative mass spectrometry‐based proteomics. Nucleic Acids Res 41: e28 [DOI] [PMC free article] [PubMed] [Google Scholar]
- 71. Schindelin J, Arganda‐Carreras I, Frise E, Kaynig V, Longair M, Pietzsch T, Preibisch S, Rueden C, Saalfeld S, Schmid B et al (2012) Fiji: an open‐source platform for biological‐image analysis. Nat Methods 9: 676–682 [DOI] [PMC free article] [PubMed] [Google Scholar]
- 72. Arganda‐Carreras I, Fernández‐González R, Muñoz‐Barrutia A, Ortiz‐De‐Solorzano C (2010) 3D reconstruction of histological sections: application to mammary gland tissue. Microsc Res Tech 73: 1019–1029 [DOI] [PubMed] [Google Scholar]
- 73. Hodgkins A, Farne A, Perera S, Grego T, Parry‐Smith DJ, Skarnes WC, Iyer V (2015) WGE: a CRISPR database for genome engineering. Bioinformatics 31: 3078–3080 [DOI] [PMC free article] [PubMed] [Google Scholar]
- 74. Ran FA, Hsu PD, Wright J, Agarwala V, Scott DA, Zhang F (2013) Genome engineering using the CRISPR‐Cas9 system. Nat Protoc 8: 2281–2308 [DOI] [PMC free article] [PubMed] [Google Scholar]
- 75. Vizcaíno JA, Csordas A, Del‐Toro N, Dianes JA, Griss J, Lavidas I, Mayer G, Perez‐Riverol Y, Reisinger F, Ternent T et al (2016) 2016 update of the PRIDE database and its related tools. Nucleic Acids Res 44: D447–D456 [DOI] [PMC free article] [PubMed] [Google Scholar]
Associated Data
This section collects any data citations, data availability statements, or supplementary materials included in this article.
Supplementary Materials
Expanded View Figures PDF
Table EV1
Table EV2
Table EV3
Review Process File
Data Availability Statement
The cmAPEX and Htr6 interactome mass spectrometry proteomics data from this publication have been deposited to the ProteomeXchange Consortium via the PRIDE 75 partner repository with the dataset identifier PXD005201 and PXD005926, respectively.