Abstract
DNA double‐strand breaks (DSBs) induce a cellular response that involves histone modifications and chromatin remodeling at the damaged site and increases chromosome dynamics both locally at the damaged site and globally in the nucleus. In parallel, it has become clear that the spatial organization and dynamics of chromosomes can be largely explained by the statistical properties of tethered, but randomly moving, polymer chains, characterized mainly by their rigidity and compaction. How these properties of chromatin are affected during DNA damage remains, however, unclear. Here, we use live cell microscopy to track chromatin loci and measure distances between loci on yeast chromosome IV in thousands of cells, in the presence or absence of genotoxic stress. We confirm that DSBs result in enhanced chromatin subdiffusion and show that intrachromosomal distances increase with DNA damage all along the chromosome. Our data can be explained by an increase in chromatin rigidity, but not by chromatin decondensation or centromeric untethering only. We provide evidence that chromatin stiffening is mediated in part by histone H2A phosphorylation. Our results support a genome‐wide stiffening of the chromatin fiber as a consequence of DNA damage and as a novel mechanism underlying increased chromatin mobility.
Keywords: chromatin dynamics, chromatin structure, DNA damage, polymers, yeast
Subject Categories: Chromatin, Epigenetics, Genomics & Functional Genomics; DNA Replication, Repair & Recombination; Systems & Computational Biology
Introduction
In order to maintain the genome's integrity, cells have evolved DSB repair mechanisms, including homologous recombination (HR) and non‐homologous end joining (NHEJ). These responses implicate changes to the chromatin that allow the recruitment of repair factors, including histone modifications, for example, phosphorylation of histone H2AX (γ‐H2A in yeast)—which can spread hundreds of kilobases (kb) away from the damaged site—replacement of core histones by histone variants, for example, H2A by H2A.Z, and nucleosome repositioning by chromatin remodelers such as INO80 and SWR1 (Rogakou, 1999; Tsukuda et al, 2005; Kim et al, 2007; Shi & Oberdoerffer, 2012; Papamichos‐Chronakis & Peterson, 2013; Price & D'Andrea, 2013). Although a local expansion of chromatin along with a reduction in its density has been observed by light and electron microscopy methods (Kruhlak et al, 2006), it remains mostly unknown how these chromatin modifications affect the folding properties of the chromosomes near a break and elsewhere in the genome.
DNA double‐strand breaks are known to alter the dynamics of chromatin. Studies in yeast showed that induction of DSBs leads to increased mobility of chromatin loci both at the broken site and, to a lesser extent, on other chromosomes (Dion et al, 2012; Miné‐Hattab & Rothstein, 2012, 2013; Seeber et al, 2013; Neumann et al, 2012; Strecker et al, 2016; Miné‐Hattab et al, 2016). This increased mobility has been proposed to enhance the efficiency of repair by HR, the dominant repair pathway in yeast (Miné‐Hattab & Rothstein, 2013; Renkawitz et al, 2014). What is the mechanism of increased chromatin mobility? At the molecular level, it was shown that chromatin dynamics can be enhanced both locally and globally by activating the DNA damage response (DDR) without inducing actual DNA damage (Bonilla et al, 2008; Seeber et al, 2013). On the other hand, recent work has made clear that the spatial architecture and dynamics of yeast chromosomes can be well understood from the random motions of semiflexible polymer chains tethered at the centromeres and telomeres (Tjong et al, 2012; Wong et al, 2012, 2013; Albert et al, 2013; Hajjoul et al, 2013; Avşaroğlu et al, 2014; Rosa & Zimmer, 2014; Vasquez & Bloom, 2014; Imakaev et al, 2015; Chiariello et al, 2016; Arbona et al, 2017). This suggests at least two very distinct mechanisms by which the DDR might affect chromatin mobility: (i) a perturbation of constraints extrinsic to the chromatin fiber, namely tethering at the centromere, at the telomeres or both, or (ii) an alteration in the intrinsic mechanical properties that determine the dynamics of the chromatin polymer, notably chromatin compaction and rigidity. A recent study provided evidence that DNA damage enhances chromatin mobility by loosening the centromeric and telomeric tethering constraints (Strecker et al, 2016). Here, we used live cell microscopy and computational analyses to explore the second, previously hypothesized possibility (Neumann et al, 2012; Miné‐Hattab & Rothstein, 2013; Seeber et al, 2013) that DNA damage alters the mechanical properties of chromatin.
Results
DNA damage by prolonged Zeocin exposure increases chromatin subdiffusion
In order to provoke DSBs in the yeast genome, we treated cells with the genotoxic drug Zeocin (Dion et al, 2012; Seeber et al, 2013). To assess the effectiveness of the drug, we scored the fraction of cells displaying Rad52‐GFP foci (Lisby et al, 2001). Based on previous studies, we initially used Zeocin at a concentration of 250 μg/ml and for a duration of 1 h (Seeber et al, 2013). Under these conditions, we detected Rad52‐GFP foci in 27 ± 1% of cells (n = 811), compared to 7 ± 1% (n = 485) in untreated cells (Fig 1A and B). Increasing Zeocin concentration to 350 μg/ml did not appreciably increase this percentage (Appendix Fig S1). However, gradually increasing the duration of treatment from 1 to 6 h led to a marked increase in DNA damage, with ~60% of cells exhibiting Rad52‐GFP foci after 6 h of Zeocin exposure (Fig 1A and B).
Figure 1. Prolonged exposure to Zeocin increases DNA damage and subdiffusive chromatin dynamics.
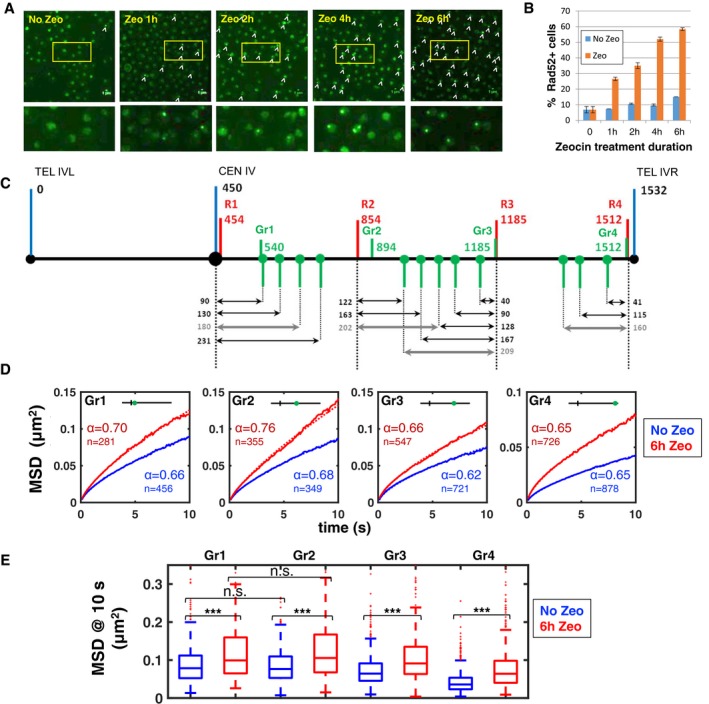
- Rad52‐GFP foci are shown (arrowheads) in example images of yeast cells that were either untreated (“No Zeo”, blue bars) or exposed to the genotoxic drug Zeocin for 1, 2, 4, or 6 h (“Zeo”, red bars). The boxed regions in images on the top are shown magnified below.
- Percentage of cells displaying Rad52‐GFP foci as function of Zeocin treatment duration (red bars). Blue bars: control experiments without Zeocin. Bars show averages of two independent experiments; error bars are standard deviations. Between n = 450 and 875 cells were analyzed for each condition.
- Schematic of chromosome IV, indicating the genomic positions of fluorescently labeled loci investigated in this study. Numbers above the black line indicate genomic distance from the left telomere (TEL IVL) in kb. Each double arrow corresponds to a distinct pair of loci and to a single strain (Appendix Table S1), with the genomic separation between the loci (in kb) indicated. Thick gray arrows indicate the four pairs of loci selected for experiments with prolonged Zeocin exposure. Red bars indicate the four loci tagged in red (R1–R4), green bars indicate the loci tagged in green (including loci Gr1–Gr4), blue bars indicate the centromere (CEN) and the left and right telomeres (TEL IVL and TEL IVR, respectively).
- Mean square displacements (MSDs) as function of time interval of the four loci Gr1–Gr4, as computed from 2D time‐lapse microscopy data (cell population average). The number of cells used to compute each curve (n) is indicated. Blue curves are for untreated cells; red curves are for cells exposed to Zeocin for 6 h. Dotted curves are fitted power laws Dt α, with the exponent α as indicated.
- Boxplots show the distribution of MSD at 10 s in absence of Zeocin (blue) or after 6 h Zeocin exposure (red), for the four loci Gr1–Gr4. The horizontal line at the center of each box indicates the median value, the bottom and top limits indicate the lower and upper quartiles, respectively. The whiskers indicate the full range of measured values, except for outliers, which are shown as small red dots. Brackets indicate the result of a Wilcoxon rank‐sum test between distributions, with “n.s.” for “not significant” (P > 0.05) and *** for P < 10−3.
We used time‐lapse microscopy to track the dynamics of four fluorescently tagged genomic loci (Marshall et al, 1997; Heun et al, 2001; Cabal et al, 2006; Thérizols et al, 2010; Weber et al, 2010; Albert et al, 2013; Hajjoul et al, 2013). The four loci (hereafter called Gr1, Gr2, Gr3, and Gr4) were chosen in very different regions of the 1,082‐kb‐long right arm of chromosome IV (IVR), the longest in the yeast genome (Fig 1C): Gr1 was in the pericentromeric region, at 90 kb from the centromere, Gr2 and Gr3 were located internally (at, respectively, 444 and 735 kb from the centromere, and at, respectively, 638 and 347 kb from the telomere), and Gr4 was subtelomeric (at 20 kb from the telomere). We tracked these loci at 100 ms time intervals for over 5 min (3,000 time points) in several hundreds of cells. Mean square displacement (MSD) analyses indicated that loci underwent subdiffusion with an exponent α between 0.62 and 0.68 over the time range 0.1–10 s, well before subnuclear confinement becomes apparent as a plateau (Fig 1D, blue traces; Appendix Fig S2). These exponents are larger than the α = 0.5 expected from the standard Rouse polymer model (Rubinstein & Colby, 2003; Hajjoul et al, 2013). Possible reasons include transition to whole‐chain diffusion near the Rouse time scale (Appendix Fig S6), hydrodynamic interactions, which the Rouse model ignores, but which can raise the exponent to α = 0.66 (Zimm model) (Rubinstein & Colby, 2003), or the effect of polymer chain stiffness, which can increase the exponent up to α = 0.75 (Steinhauser, 2008). Our data significantly extend related findings in earlier and recent studies (Cabal et al, 2006; Weber et al, 2012; Albert et al, 2013; Hajjoul et al, 2013; Backlund et al, 2014; Spichal et al, 2016; Miné‐Hattab et al, 2016).
When cells were exposed to Zeocin for 6 h, all four loci exhibited clearly increased dynamics (Fig 1D and E). Subdiffusive exponents α also significantly increased for Gr1, Gr2, and Gr3 (Fig 1D and Appendix Fig S2). The MSD at 10 s increased significantly for all four loci, by ~27–79% (Fig 1E). Exposure to Zeocin for 2, 4, and 6 h led to a gradual increase in MSD, as observed on three other loci on the same chromosome arm (Appendix Fig S3). The increased mobility upon induction of DNA damage is qualitatively consistent with previous reports (Dion et al, 2012; Miné‐Hattab & Rothstein, 2012; Neumann et al, 2012; Seeber et al, 2013; Strecker et al, 2016). However, whereas these reports have mainly interpreted increased dynamics as an enlargement of the radius of confinement of chromatin loci, which is apparent at longer time scales (~100 s or more), our data show that increased dynamics is also evident at the smallest time scales analyzed here (0.1 s). This observation, and the increase in subdiffusive exponent, point toward a mechanism that, unlike confinement, affects chromatin mobility at all time scales and possibly arises from changes in the chromatin fiber itself.
Because Zeocin induces DSBs randomly throughout the genome, it is difficult to distinguish between effects local to the break and effects elsewhere in the genome. In order to examine whether DNA damage affects chromatin mobility globally, we therefore induced a DSB at the MAT locus on chromosome III using the cleavable HO (homothallic switching endonuclease) site targeted by inducible HO endonuclease and tracked the motion of a TetR‐GFP‐labeled locus in the subtelomeric region of chromosome XV (Fig EV1A). The effectiveness of DSB induction at the MAT locus was confirmed by chromatin immunoprecipitation (ChIP) of Rad52 (Fig EV1B). We observed a significant increase in MSD of the tracked locus upon induction of HO (Fig EV1C and D) (by ~22% at 10 s). This indicates that a targeted DSB increases chromatin mobility on other chromosomes and therefore likely throughout the genome. We note that this effect is not restricted to subtelomeric (or pericentromeric) loci, which are most susceptible to tethering, since increased mobility in trans of a targeted DSB was previously reported for loci in internal regions of chromosome arms. These include locus URA3 on chromosome III, located at 36 kb from the centromere and 116 kb from the telomere, and which occupies a territory near the nuclear center (Berger et al, 2008; Miné‐Hattab & Rothstein, 2012), and locus MAK10 on chromosome V, located at 98 kb and 52 kb from the centromere and telomere, respectively (Strecker et al, 2016). Moreover, we could not detect any significant change in the distance of our subtelomeric locus to the nuclear center with or without HO induction (Fig EV1E), which also argues against a role of telomeric untethering in the mobility increase observed here.
Figure EV1. Localized double‐strand break increases chromatin mobility on other chromosomes.
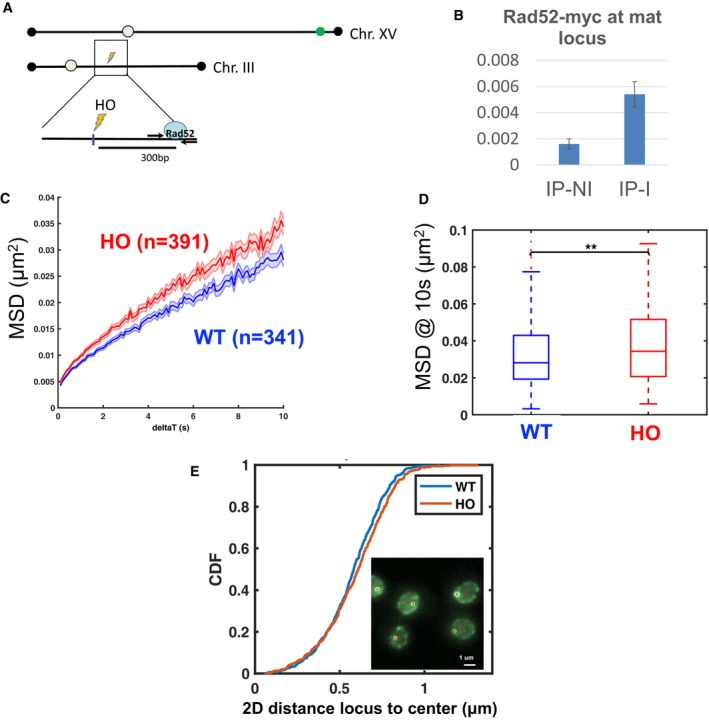
- Schematic showing the position of the HO (homothallic switching endonuclease) cutting site at the MAT locus on chromosome III (lightning symbol) and the Tet operator sequence in the subtelomeric region of chromosome XV, which is targeted by TetR‐GFP (green dot). Rad52 monitors repair by homologous recombination upon HO induction.
- Chromatin immunoprecipitation for Myc‐tagged Rad52 at the MAT locus monitored by Q‐PCR after 1 h of HO induction (IP‐I) as compared to non‐induction (IP‐NI). Expression of endonuclease HO is driven by a galactose (GAL1‐10) promoter. Bars show averages of 3 replicate experiments, and error bars show standard deviations.
- Mean square displacements of the TetR‐GFP labeled locus (population median). Blue: cells not expressing HO and grown in galactose (n = 341 cells). Red: cells expressing HO, after 1 h induction in galactose (n = 391 cells). The shaded area is the interquartile range divided by .
- Boxplots show the distribution of MSD at 10 s in the presence or absence of HO induction. A Wilcoxon rank‐sum test between distributions indicates significant increase upon induction (**P < 0.01). The horizontal line at the center of each box indicates the median value, the bottom and top limits indicate the lower and upper quartiles, respectively. The whiskers indicate the full range of measured values.
- Distribution of distances between the locus and the nuclear center, for cells expressing HO endonuclease (n = 509, red) and cells not expressing HO (n = 569, blue). A rank‐sum test detected no significant differences (P = 0.08). Inset shows a few cells, with the bright GFP spot marked by a red cross and the nuclear center by a red circle. Distances were measured on 2D projections of 3D z‐stacks.
DNA damage increases intrachromosomal distances
The results above led us to ask whether this damage‐dependent mobility increase resulted from a change in the compaction or rigidity of the chromatin fiber. To investigate these properties of chromatin, we measured distances R between pairs of fluorescently labeled loci along chromosome arm IVR. According to the ideal polymer chain model, the mean square distance between two loci separated by a genomic distance s (in bp) is , where C is the chromatin fiber compaction, that is, the number of base pairs per unit length (in bp/nm), and P is the persistence length, a measure of chromatin's bending rigidity (in nm). Thus, changes in chromatin rigidity or compaction (or both) should be reflected by a change in distances —except in the special case where C and P change by the same factor.
We constructed 16 yeast strains, each of which had one chromatin locus fluorescently labeled in red and one locus labeled in green (Figs 1C and 2A, and Appendix Table S1, Materials and Methods) (Robinett et al, 1996). In order to cover representative regions of the chromosome, we chose four loci R1, R2, R3, and R4 located at different genomic positions along the chromosome arm IVR: R1 was pericentromeric, at only 4 kb from the centromere, R2 and R3 were internal, at 404 and 735 kb from the centromere, respectively (i.e., 678 and 347 kb from the telomere), and R4 was subtelomeric, at 20 kb from the telomere. These loci were labeled in red, while the green loci were chosen at distances between 40 and 231 kb from a red locus (Figs 1C and 2A). For each pair of loci, we measured 2D distances R from projected 3D images of n ~1,300 live cells, on average (Materials and Methods). Distributions of R are shown for two pairs in Fig 2B and for all 16 pairs in Fig EV2. As in earlier studies (Bystricky et al, 2004; Thérizols et al, 2010), measured distances were highly variable, ranging from ~30 nm to ~1.25 μm (percentiles 1% and 99%, respectively, of all distances). Root‐mean square distances (RMS), ½ ranged from 295 to 786 nm, and standard deviations, σ(R) from ~130 to ~320 nm. These distance distributions reflected actual physical separation with negligible or minor contributions of random measurement errors and locus mobility during acquisition (Appendix Supplementary Methods and Appendix Fig S4). Interestingly, for the majority of pairs (nine out of 16), the distance distribution was undistinguishable from that expected for a Gaussian distribution of the differences in coordinates between the loci, as expected for an ideal chain model (Fig EV2 and Appendix Supplementary Methods).
Figure 2. Intrachromosomal distances correlate with genomic separation.
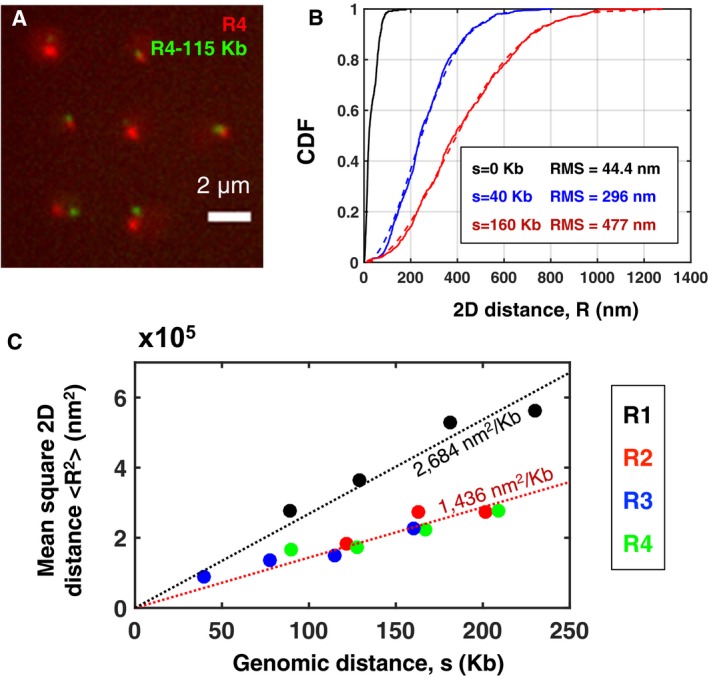
- Fluorescence microscopy image of yeast cells with the locus R4 labeled in red and another locus at 115 kb labeled in green from strain #15 in Appendix Table S1 (maximum intensity projection of a 3D stack).
- Cumulative distribution function (CDF) of 2D distances (from projected 3D z‐stacks) for three populations of cells. Black: control cells, with a single locus labeled in green and red (n = 344 cells). Blue: pair of loci separated by 40 kb (strain #8, n = 727). Red: pair of loci separated by 163 kb (strain #6, n = 546). Solid traces show the CDF of measured distances R; dashed curves show the function with set to the measured root mean square distance (RMS). The empirical and theoretical distributions agree very well (Kolmogorov–Smirnov test: P = 0.56 and P = 0.99 for blue and red, respectively). See Fig EV2 for all 16 intrachromosomal pairs shown in Fig 1C.
- Mean square 2D distances between pairs of loci on the right arm of chromosome IV are plotted as function of their genomic separation s (in kb). Each color corresponds to a different reference locus R1, R2, R3, or R4 (i.e., the locus tagged in red, see Fig 1C) as indicated in the legend on the right. For a given genomic distance, the mean square distances are very similar for all pairs, except those in the pericentromeric region (black dots, i.e., pairs involving locus R1), which have consistently larger mean square distances, indicative of chromatin fiber stretching. The black dotted line shows a linear fit to the four pericentromeric data points; the red dotted line is a linear fit to all other 12 data points. The fitted slope is indicated on each line.
Figure EV2. Distribution of distances between 16 pairs of chromatin loci in the absence of Zeocin.
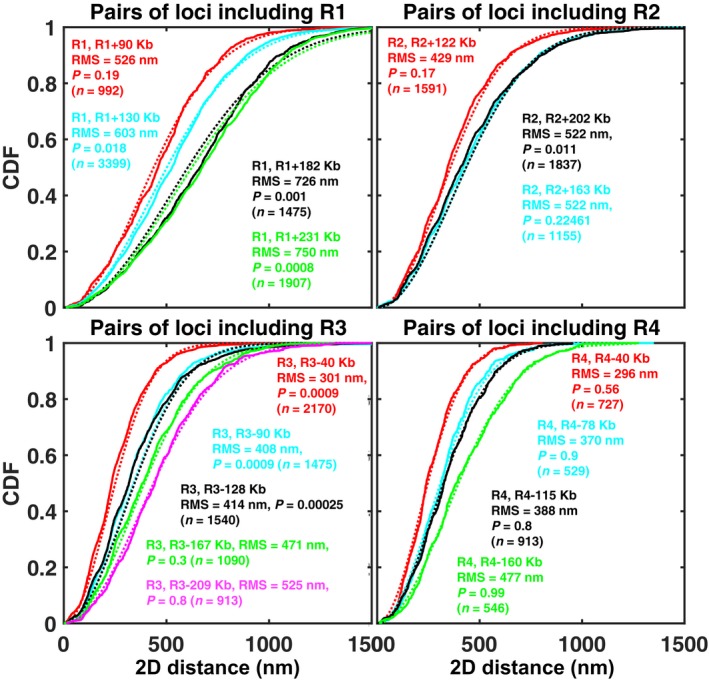
Each panel corresponds to a different reference locus (R1, R2, R3, or R4), as indicated. Each solid curve is the empirical cumulative distribution function (CDF) for the pair of loci indicated in the same‐colored legend. The dotted curve of the same color shows the function , where , is the experimentally measured root‐mean square (RMS) distance, measured between the two loci, as indicated in the legend. F is the CDF expected for a Gaussian distribution of the distance vector between the two loci, as predicted by an ideal chain model (see Appendix Supplementary Methods). The P‐value indicates the result of a Kolmogorov–Smirnov test comparing the experimentally measured CDF to F. For nine out of 16 pairs, the measured CDF is statistically undistinguishable from the Gaussian model (P > 0.05), for two more, the difference is only marginally significant (P > 0.01). The number of cells for each pair, n, is indicated.
We plotted the mean square distances as a function of genomic separation between the loci in Fig 2C, as previously shown in Arbona et al (2017). For the 12 pairs of loci located far from the centromere (involving loci R2, R3, or R4), increased similarly and roughly linearly with genomic separation s (Fig 2C). Similar correlations between spatial and genomic distances in yeast chromosomes were reported before for smaller genomic distances and shorter chromosomes, or between telomeres of different chromosomes (Bystricky et al, 2004; Thérizols et al, 2010). Our results now show that spatial and genomic distances correlate throughout the ~1‐Mb‐long chromosome arm IVR. These data are in rough agreement with an ideal chain model of constant compaction C and rigidity P. However, for pairs involving the pericentromeric locus R1, was consistently about twice as large for the same genomic separation (Fig 2C). This indicates a pronounced stretching of the chromatin fiber in the centromeric region relative to the rest of the chromosome. While the ideal chain model cannot readily explain this observation, pericentromeric stretching can be recapitulated by a polymer model that accounts for nuclear confinement, tethering of centromeres to the spindle pole body (SPB), as well as topological and steric constraints among chromosomes (Wong et al, 2012, 2013; Arbona et al, 2017). These effects result in entropic repulsion between chromosome arms, as in a polymer brush or star shaped polymer (De Gennes, 1979; Zimmer & Fabre, 2011; Daoud & Cotton, 1982), which leads to increased elongation away from the spindle pole. Unlike another recent model for mitotic chromatin, this explanation does not require any DNA loops (Lawrimore et al, 2016). Thus, our intrachromosomal distance data further strengthen the relevance of polymer models to describe yeast chromosome configuration and provide a solid reference to analyze alterations in these configurations.
We next examined the effect on these distances of a 1 h exposure to Zeocin at 250 μg/ml. For 11 out of 16 pairs, no significant change in distances was detected despite the large number of cells analyzed (n ~1,370 cells on average per pair and condition) (Appendix Fig S5). We then focused on a subset of four pairs of loci and exposed cells to Zeocin for 2, 4, and 6 h. Each of the loci R1, R2, R3, and R4 was paired to a locus at a distance of 160–209 kb on the same arm, as shown in Fig 1C (thick gray double arrows). The increased duration of Zeocin treatment led to a clear and significant change in intrachromosomal distances for all four pairs (Fig 3). The relative increase in distances was generally larger for longer Zeocin treatment. The change in distances was most prominent for R3, where 6 h of Zeocin treatment more than doubled . The smallest relative increase was observed in the pericentromeric region of locus R1 (~30%). Note that DNA damage by Zeocin leads to cell cycle arrest, which results in larger nuclei. However, intrachromosomal distances normalized by the mean nuclear diameter still increased, although slightly less (Fig EV3). Thus, DNA damage by persistent Zeocin treatment leads to an increase in intrachromosomal distances all along the chromosome arm. These observations have implications for the physical properties of chromatin and the mechanism underlying increased chromatin dynamics.
Figure 3. Intrachromosomal distances increase upon DNA damage.
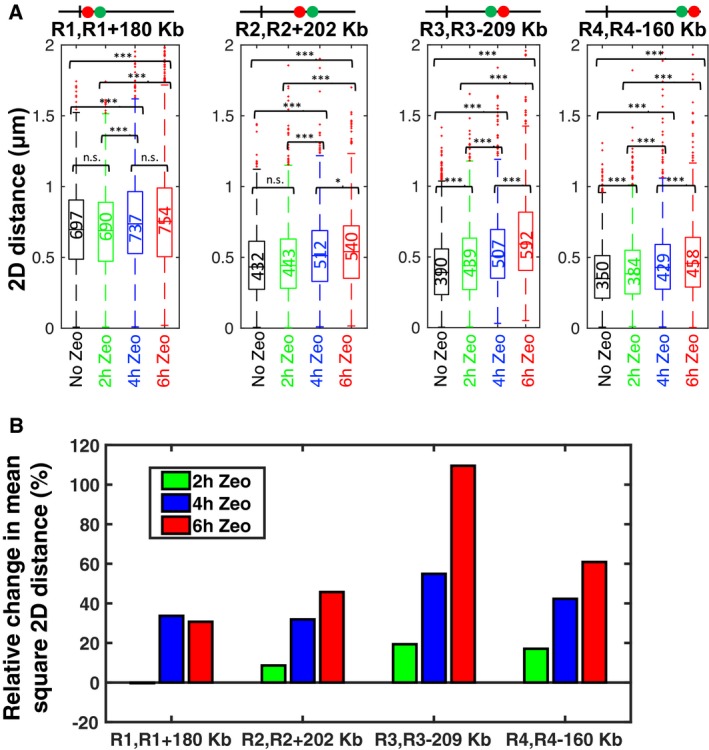
- Boxplots show the distribution of intrachromosomal distances measured for four pairs of loci as indicated, in the absence of Zeocin (black), after 2 h of Zeocin treatment (green), 4 h (blue), and 6 h (red). For each boxplot, the median distance in nm is indicated and shown by the horizontal line at the center. The lower and upper quartiles are indicated by the bottom and top limits of the box. The whiskers indicate the full range of the measured distances, except for outliers, which are shown as small red dots. The number of cells for each of the 16 cases is on average n = 1,696 (s.d. 490). Brackets indicate the results of a Wilcoxon rank‐sum test on pairs of distributions, with “n.s.” for not significant (P > 0.05), * for P < 0.05, and *** for P < 0.001.
- Bar plot shows the relative change in mean square distance of Zeocin‐treated cells compared to untreated cells for four pairs of loci (in %). Color indicates the duration of Zeocin treatment, with green for 2 h, blue for 4 h, and red for 6 h.
Figure EV3. Prolonged Zeocin treatment increases intrachromosomal distances.
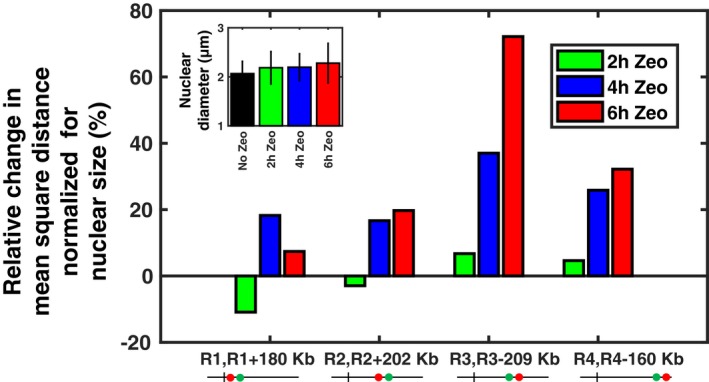
Relative change in mean square distances between pairs of loci (in %), as in Fig 3B, but after normalization by the mean nuclear diameter for each Zeocin exposure, as shown in the inset (diameter was measured in cells with fluorescently tagged nuclear envelope; error bars show standard deviations).
No evidence for a role of Sae2, Blm10, and Cep3 phosphorylation in intrachromosomal distance increase
The observed increase in intrachromosomal distances can potentially arise from several molecular processes known to be associated with DNA damage repair, such as resection and nucleosome loss. To address these potential molecular factors, we repeated our measurements of intrachromosomal distances (on loci R3 and R3‐167 kb) in deletion mutants of the proteins Sae2 and Blm10. Sae2 is essential for recombination, and its deletion was shown to slow down resection upon DSB induction (Baroni et al, 2004; Clerici et al, 2005; Sarangi et al, 2015), while Blm10 is an activator of the 20S proteasome, which plays an important role in the degradation of acetylated histones following DNA damage (Qian et al, 2013). The Δblm10 mutant exhibited a growth defect as previously reported (Doherty et al, 2012). In both mutants, the intrachromosomal distances did not significantly differ from the wild‐type cells in untreated cells, and distances increased significantly upon exposure to Zeocin for 6 h, again with no significant difference from wild‐type cells (Fig EV4). These data indicate that neither resection initiated by Sae2 nor loss of acetylated histones via the 20S proteasome significantly contributes to the intrachromosomal distance increase. However, we cannot rule out implication of these proteins at the site of the break, as previously reported for Sae2 (Miné‐Hattab & Rothstein, 2012), or a role of other resection or histone degradation pathways, as recently shown in a related study (Hauer et al, 2017).
Figure EV4. Proteins Sae2 and Blm10 do not contribute to the Zeocin‐dependent increase in intrachromosomal distances.
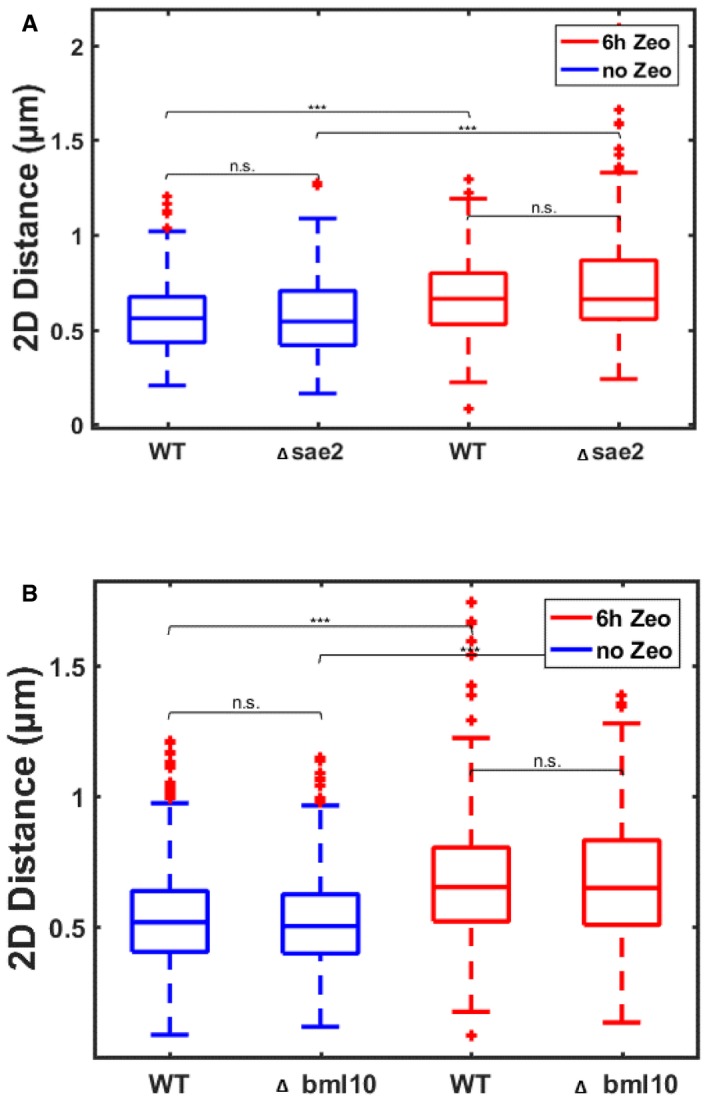
- Boxplots show the distributions of 2D intrachromosomal distances between loci R3 and R3‐167 kb (see Fig 1B) in a deletion mutant of Sae2 (Δsae2) as compared to wild‐type cells (WT), in untreated cells (blue) or in cells exposed to Zeocin for 6 h (red).
- Same as (A) but for the deletion mutant of Blm10 (Δblm10).
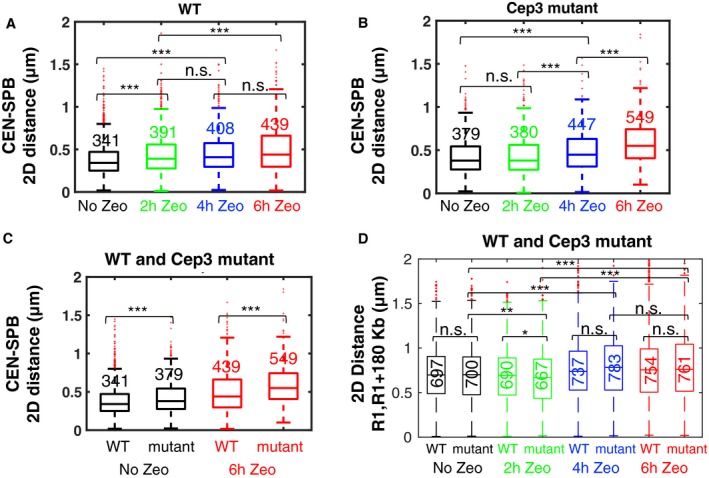
The enhancement of chromatin mobility following DSBs requires activation of the kinase Mec1 (Dion et al, 2012; Seeber et al, 2013). A recent study reported that Mec1‐dependent phosphorylation of the kinetochore component Cep3 partly relaxes the tethering of centromeres to the SPB, thereby leading to increased chromatin mobility (Strecker et al, 2016). We measured the distance between the SPB component Spc72 fused to mCherry and the centromere of chromosome IV (CEN4) (He et al, 2000) and found that it increased significantly upon DSB induction, from a median distance of 340 nm to 440 nm after 6 h of Zeocin treatment, that is, a 30% increase (Fig 4A). Because phosphorylation of Cep3 was shown to modulate the link between CEN and SPB, we also measured the SPB‐CEN distance in the phosphorylation‐defective mutant cep3S575A. In this mutant, the SPB‐CEN distance still increased significantly upon Zeocin treatment, from 380 to 550 nm, a 45% increase (Fig 4B). This suggests that the DNA damage‐dependent relaxation of centromeric tethering does not exclusively arise from Cep3 phosphorylation. The SPB‐CEN distance was somewhat larger in the mutant in the absence of Zeocin treatment (Fig 4C), possibly due to residual spontaneous DNA damage (Fig 1A and B). We then measured the distances between the pericentromeric chromatin locus R1 and a locus at 180 kb in the Cep3 mutant (Fig 4D). The median distance increased by ~10% from 700 nm to 760–782 nm upon Zeocin treatment during 4–6 h, in a manner that was undistinguishable from the wild‐type cells (P > 0.05); for 2 h Zeocin treatment, we measured a very small reduction in distances that was slightly significant (P < 0.05) in the mutant and more pronounced (~5%) than in wild‐type cells (~1%) (Fig 4D). These results suggest that phosphorylation of Cep3 does not play a significant role in the DSB‐dependent increase in intrachromosomal distances.
Figure 4. Effect of DNA damage and Cep3 phosphorylation on centromeric tethering and intrachromosomal distances.
-
A–CBoxplots show the distribution of distances measured between the centromere of chromosome IV (He et al, 2000) (CEN) and the spindle pole body (SPB), as function of Zeocin treatment duration, for wild‐type cells (WT) (A), the Cep3 phosphorylation mutant (cep3S375A) (B), or both (C). The CEN‐SPB distance increases significantly upon prolonged Zeocin treatment both in WT cells (A) and the Cep3 mutant (B). Distances are slightly but significantly larger in the Cep3 phosphorylation mutant both with and without Zeocin treatment (C).
-
DIntrachromosomal distances between R1 and R1+180 kb increase upon Zeocin treatment both for WT cells and the mutant, with no significant difference between them (P > 0.05) except for a marginally significant difference at 2 h Zeocin treatment (P < 0.05).
Chromatin stiffening can explain increase in chromatin dynamics and intrachromosomal distances
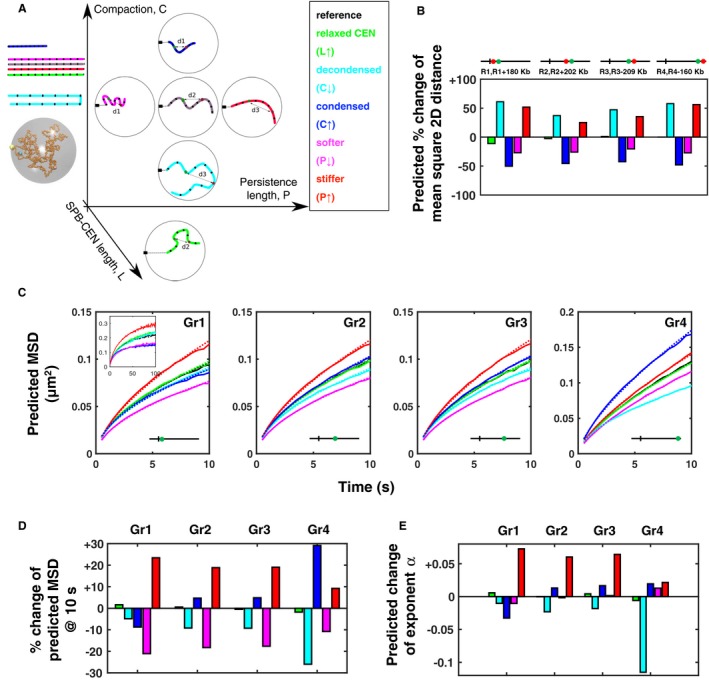
In order to understand the mechanistic links between increased intrachromosomal distances and enhanced chromatin mobility upon DSBs, we turned to computational simulations of yeast chromosomes (Wong et al, 2012, 2013; Arbona et al, 2017). In our simulations, chromosomes are defined by their known genomic lengths, an assumed constant compaction C, and persistence length P, the centromeres are tethered to the SPB using a spring‐like link of equilibrium length L, and the telomeres are tethered to the nuclear envelope using a short‐range attractive force. The model implements Langevin dynamics, whereby random motions are applied to monomers starting from a random initial configuration (Appendix Supplementary Methods). In addition to a reference model whose parameters were taken from a recent study (Arbona et al, 2017), we simulated the configurations and dynamics of chromosome IV for five scenarii (Fig 5A): a relaxation of the SPB–centromere link (relaxed CEN) (Strecker et al, 2016), an increase or decrease in chromatin compaction (condensed or decondensed, respectively), and an increase or decrease in chromatin rigidity (stiffer or softer, respectively). First, we simulated a lengthening of the distance between SPB and centromere from L = 300 to 500 nm, a larger change than observed in WT cells upon 6 h Zeocin treatment (Fig 5A). This lengthening of the centromeric tether was predicted to have very little effect on intrachromosomal distances and on the mobility of loci Gr1–Gr4 at the investigated time scales of 0.1–10 s (Fig 5B–D, green), although MSDs for longer time scales (~100 s) were predicted to slightly increase. Thus, relaxed centromeric tethering does not readily explain the increased mobility observed throughout the chromosome arm (Fig 1D) nor the increase in intrachromosomal distances (Fig 3). Second, we explored the effect of altering chromatin compaction C. Unsurprisingly, a decondensation (lower C) was predicted to increase intrachromosomal distances throughout the chromosome (Fig 5B, cyan). However, in this scenario, chromatin mobility was predicted to decrease throughout the chromosome arm, rather than increase as observed (Fig 5C and D, cyan). In the context of Rouse polymer dynamics, this effect can be understood as a consequence of lengthening the chromatin chain upon decondensation (Appendix Fig S6). Conversely, if chromatin condenses (larger C), the model predicted reduced intrachromosomal distances throughout the arm (Fig 5B, blue) and an increase in chromatin mobility, except in the pericentromeric region (Fig 5C and D, blue). Therefore, neither a global decondensation nor a global condensation of chromatin can simultaneously explain the observed increase in distances (Fig 3) and the enhanced dynamics along most of the chromosome arm (Fig 1D and E). In contrast, increasing chromatin rigidity (stiffening; larger P) was predicted to augment both intrachromosomal distances and chromatin mobility everywhere along the chromosome (Fig 5B–D red). These predictions are in agreement with our observations of increased intrachromosomal distances and increased chromatin mobility upon DNA damage throughout the chromosome arm (Figs 1D and E, and 3). Conversely, reducing P, that is, making the fiber more flexible, or softer, led to diminished intrachromosomal distances and weaker dynamics (Fig 5B–D, pink), and this scenario is therefore not supported by the experiments. Finally, we note that increased chromatin rigidity is the only of the five scenarii that predicted a notable increase in the subdiffusive exponent α for loci Gr1‐Gr3, as observed after Zeocin treatment (Fig 5E and Appendix Fig S2). The presence of other chromosomes and crowding can complicate this picture, but qualitatively similar predictions were obtained when removing the confinement and tethering constraints (data not shown). Thus, our data and analysis taken together support a model in which enhanced chromatin mobility after DNA damage is caused at least in part by a stiffening of the chromatin fiber throughout the yeast nucleus.
Figure 5. Increase in intrachromosomal distances and chromatin dynamics can be explained by global stiffening of the chromatin fiber.
-
ASix different scenarii for the conformation and dynamics of chromosome IV are explored using polymer simulations. The simulations are used to study the effect of five changes from a reference model (gray, center): relaxed tethering of the centromere to the SPB (green, bottom), chromatin decondensation (cyan, below center), chromatin condensation (blue, above center), reduction in chromatin rigidity, that is, softening (pink, left of center), increase in chromatin rigidity, that is, stiffening (red, right of center). Colored chains illustrate the effect of these changes on chromosome structure. The chains are also shown stretched out on the left to emphasize their similar or different linear lengths. Double arrows show the distance between two loci on the same chromosome. Black marks on the chromosome define intervals of equal number of DNA base pairs. An increase in distance between two loci from d2 to d3 can be explained by a lower compaction (chromatin decondensation, cyan) or an increase in rigidity P (chromatin stiffening, red). A snapshot of the dynamic simulation of chromosome IV is shown on the left. The boxed legend to the right shows the color code used for the remaining panels.
-
B–EAll plots show computational predictions obtained from our polymer simulations for different parameter values, as indicated by the distinct colors. Black: reference model, with a chromatin compaction C = C 0 = 50 bp/nm, a persistence length P = P 0 = 69 nm, and a length between SPB and centromere (CEN) of L = L 0 = 300 nm. Green: relaxed centromeric tethering: C = C 0, P = P 0, and L = 500 nm > L 0. Cyan: decondensed chromatin: C = 25 bp/nm < C 0, P = P 0, and L = L 0. Blue: condensed chromatin: C = 110 bp/nm > C 0, P = P 0, and L = L 0. Magenta: less rigid chromatin: C = C 0, P = 27 nm < P 0, L = L 0. Red, more rigid chromatin: C = C 0, P = 180 nm > P 0, L = L 0. (B) Bars show the predicted change in mean square intrachromosomal distance relative to the reference model, for four pairs of loci (R1 and R1+180 kb, R2 and R2+202 kb, R3 and R3+209 kb, R4 and R4‐160 kb, in %). (C) Curves show predicted mean square displacements (MSDs) for loci Gr1 to Gr4 as function of time interval from 0.1 to 10 s (the inset shows MSDs up to 100 s). Dotted lines show power laws fitted to each MSD curve. (D) Bars show the predicted relative change in MSD at 10 s for these loci compared to the reference model, in %. (E) Bars show the change in subdiffusive exponent α relative to the reference model, determined by fitting power laws to the curves in panel (C).
PALM/STORM imaging of Lac operator array is consistent with chromatin stiffening
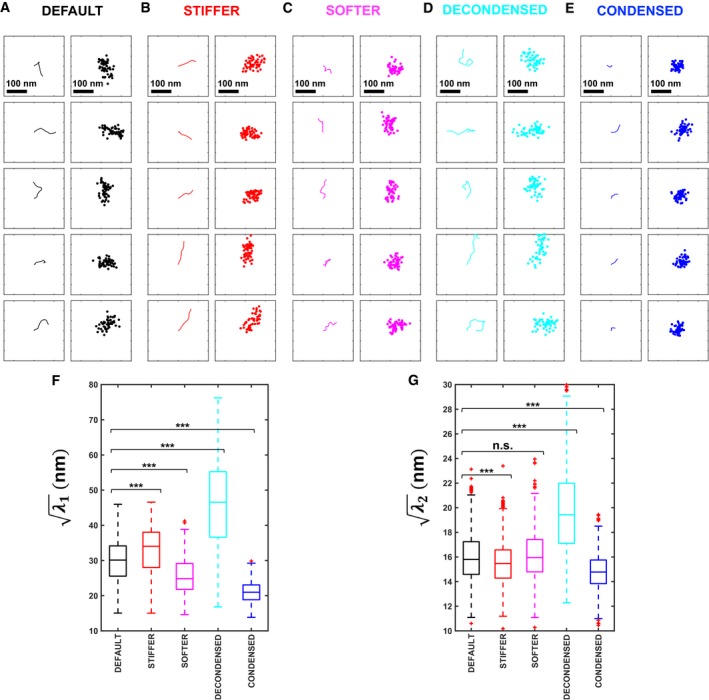
In order to assay chromatin structure by independent means, we proceeded to analyze how the shape of a small chromatin region changes upon Zeocin treatment. For this purpose, we used LacI‐GFP to visualize a ~7‐kb‐long Lac operator array at the position R3‐209 kb (see Fig 1B) on chromosome IV. We reasoned that global chromatin decondensation or stiffening could lead to a detectable change in the visual appearance of this locus. We indeed observed that LacI‐GFP spots increased in size upon Zeocin treatment (Appendix Fig S7). However, this change can potentially result from either decondensation or stiffening. Because the size of GFP spots was still close to the resolution limit of conventional microscopy, we turned to PALM/STORM microscopy, using anti‐GFP nanobodies conjugated to Alexa647 dyes to image the locus at high resolution in a distinct color channel (Ries et al, 2012) (Fig 6A). For each visible GFP‐tagged locus, we quantified the shape of the Alexa647 localization patterns by computing the large and small eigenvalues, λ 1 and λ 2 (λ 1 > λ 2) of the covariance matrix of the (x, y) coordinates, which measure the variance along and across the principal axis of elongation, respectively (Fig 6B). As discussed above, the increase in intrachromosomal distances taken alone can be explained either by chromatin stiffening or decondensation, or a combination of both. Our super‐resolution images can potentially distinguish between decondensation and stiffening, since the former is expected to always increase λ 2, whereas the latter can reduce it (if the curvilinear length of the imaged chromatin region is comparable to the persistence length)—as evidenced by simulations (Fig EV5). We computed these quantities on experimental PALM/STORM data of n = 85 Zeocin‐treated cells and n = 113 untreated cells (after filtering out localizations far from the locus, which likely originated from unbound LacI‐GFP or nanobodies) (Fig 6C). Although we could not detect a significant change in λ 1 (Wilcoxon rank‐sum test, P = 0.12), we observed a small, but significant, decrease in λ 2 in Zeocin‐treated cells as compared to untreated controls (P = 0.002) (Fig 6D). These data are more consistent with a stiffening of the chromatin fiber than a decondensation and therefore provide further evidence in support of a global increase in chromatin rigidity.
Figure 6. Super‐resolution imaging of LacI‐GFP is consistent with Zeocin‐dependent stiffening of chromatin.
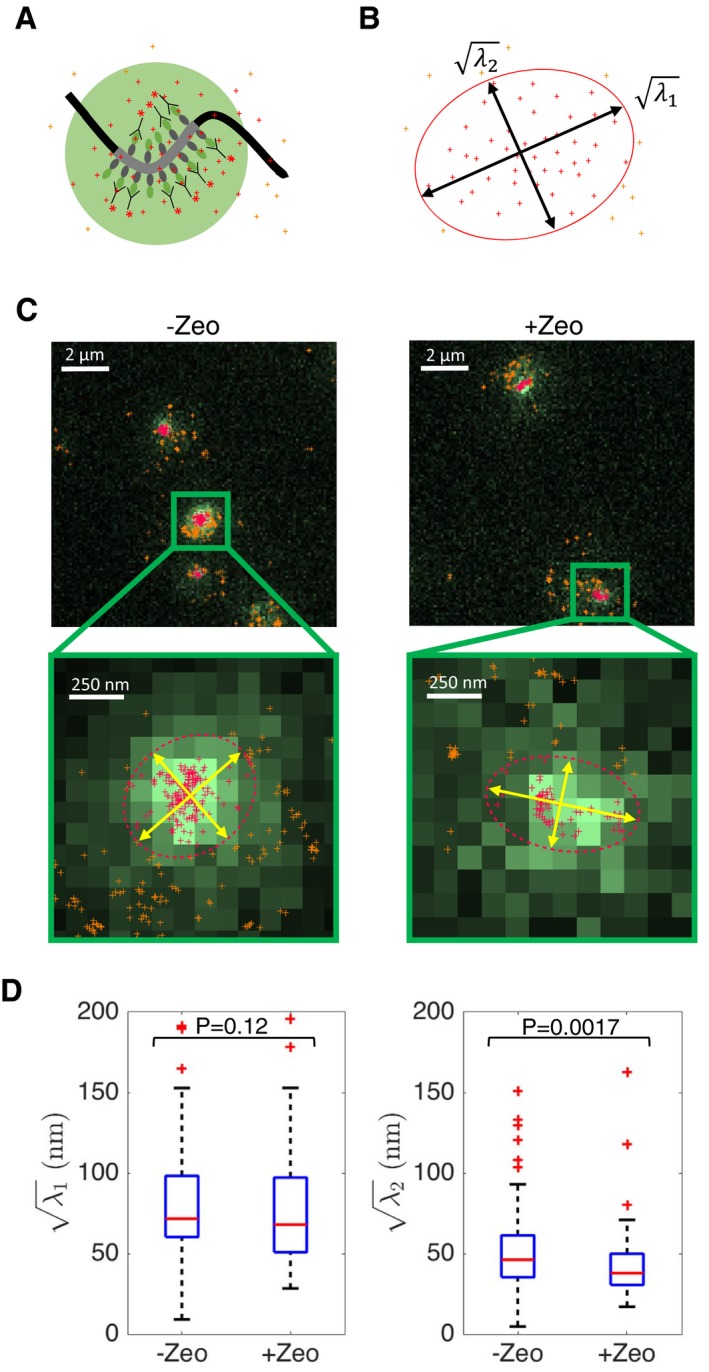
- Schematic showing a portion of chromosome IV containing the Lac operator sequence (dark gray). The Lac operators are recognized by LacI‐GFP proteins (gray and green), which are themselves targeted by nanobodies (Y symbols) conjugated to Alexa647 dyes (red asterisks). Standard GFP images (light green disk) reveal little information about the shape of the Lac sequence, whose size is close to the diffraction limit. The shape of the locus is better revealed by PALM/STORM imaging, which generates a cloud of single‐molecule localizations (crosses).
- The eigenvalues of the covariance matrix of (x, y) localization coordinates were computed to measure the localization cloud extent parallel to () and perpendicular to () the main axis of elongation, as indicated by the red ellipse and double arrows. We restrict the analysis to localizations in the vicinity of the GFP spot (red crosses inside the ellipse; orange crosses outside the ellipse show excluded localizations).
- Widefield and super‐resolution images of LacI‐GFP in the absence (left) and presence (right) of Zeocin treatment. PALM/STORM localizations (crosses) are shown superposed on the widefield GFP image. Top images show 2‐3 cells, bottom images show magnified views of a single locus.
- Boxplots show the distribution of and in the absence or presence of Zeocin, for n = 85 and n = 113 cells, respectively. The second eigenvalue is slightly but significantly reduced in presence of Zeocin (P = 0.0018); no significant difference is detected for (P = 0.12). The horizontal line at the center of each box indicates the median value, the bottom and top limits indicate the lower and upper quartiles, respectively. The whiskers indicate the full range of measured values, except for outliers, which are shown as red crosses.
Figure EV5. Shape analysis of a super‐resolved chromatin fiber region can distinguish between decondensation and stiffening.
-
AFive simulated configurations of a 7‐kb chromatin region (left column) and corresponding single‐molecule localizations (right column). The simulated configurations are 2D projections of 3D freely rotating chains with a persistence length of P 0 ≈ 70 nm and a compaction of C 0 ≈ 50 bp/nm, implying a contour length ≈ 140 nm (below the diffraction limit to optical resolution). Localization clouds (x i, y i)i=1…n were simulated by randomly sampling n = 50 positions along the chain and adding normally distributed random positioning errors with standard deviation σ ≈ 15 nm.
-
BSame as panel (A), but for a stiffer fiber, with P ≈ 180 nm and C = C 0.
-
CSame as panel (A), but for a softer fiber, with P ≈ 27 nm and C = C 0.
-
DSame as in panel (A), but for a less compact (decondensed) fiber, with P = P 0 and C = C 0/2 ≈ 25 bp/nm.
-
ESame as in panel (A), but for a more compact (condensed) fiber, with P = P 0 and C = 2C 0 ≈ 100 bp/nm.
-
F, GBoxplots show the distributions of and for 1,000 configurations in each of the five scenarios, where λ 1 and λ 2 are the eigenvalues of the covariance matrix of the localizations (x i, y i) for each simulated chain. The horizontal line at the center of each box indicates the median value, the bottom and top limits indicate the lower and upper quartiles, respectively. The whiskers indicate the full range of measured values, except for outliers, which are shown as red crosses. Brackets indicate the results of a Wilcoxon rank‐sum test on pairs of distributions, with “n.s.” for P > 0.05 (not significant), and *** for P < 0.001.
Phosphorylation of H2A in part underlies chromatin stiffening
What molecular mechanism might cause increased chromatin rigidity? Experiments on chromatin in vitro suggest that increasing negative charge could increase the stiffness of chromatin (Cui & Bustamante, 2000; Schiessel, 2003). A candidate mechanism is therefore phosphorylation of H2A, which extends over long chromatin regions in response to DSBs and adds highly negative charge (Nestler & Greengard, 1999; Jackson et al, 2000; Redon et al, 2002; Kim et al, 2007). To investigate the role of H2A phosphorylation on chromatin rigidity, we measured distances between the same four pairs of loci studied above (R1 and R1+180 kb, R2 and R2+202 kb, R3 and R3‐209 kb, R4 and R4‐160 kb) in a mutant where both genes encoding H2A (HTA1, HTA2) carry the mutation S129A and are not phosphorylable (Jackson et al, 2000) (Fig 7 and Appendix Fig S9). Western blotting indicated that levels of phosphorylated H2A increased upon Zeocin treatment in wild‐type cells, as expected, and decreased upon treatment in the mutant (Appendix Fig S8). In the absence of Zeocin, there was no significant difference in intrachromosomal distances between wild‐type and mutant cells (except for the pair (R3, R3‐209 kb), for which distances were somewhat larger in the mutant) (Appendix Fig S9). By contrast, the mutant cells showed a markedly different response to DNA damage. After 6 h of Zeocin treatment, intrachromosomal distances were significantly lower in the mutant compared to the wild‐type cells (except for (R2, R2+202 kb), where there was no significant difference) (Fig 7 and Appendix Fig S9). For pairs (R3, R3‐209 kb) and (R4, R4‐160 kb), the relative distance increase in the mutant was roughly half that measured in wild‐type cells; for pair (R1, R1+180 kb), we observed a slight and marginally significant reduction in distances in the mutant after Zeocin exposure (Fig 7 and Appendix Fig S9). Our data thus suggest that the DNA damage‐dependent increase in chromatin rigidity is mediated in part (though not entirely) by H2A phosphorylation.
Figure 7. Phosphorylation of H2A contributes to DNA damage‐dependent increase in intrachromosomal distances and dynamics.
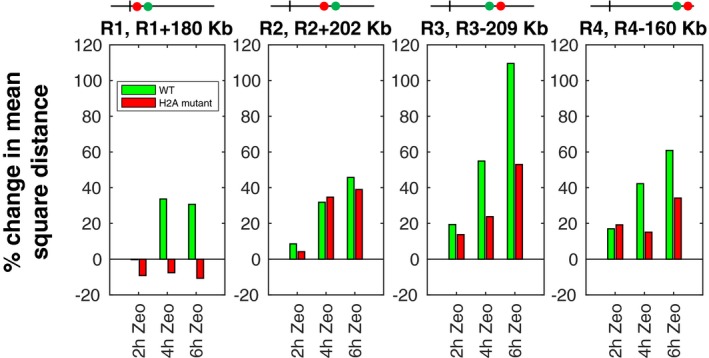
Bars show the relative change in mean square intrachromosomal distance after 2, 4, or 6 h of Zeocin treatment relative to distances without Zeocin, for four pairs of loci. Results for wild‐type cells are in green, and results for the H2A phosphorylation mutant (S129A) are in red. Boxplots of the absolute distance distributions for all these conditions, together with statistical tests, can be found in Appendix Fig S9.
Discussion
In conclusion, our study provides evidence that DNA damage induces a hitherto unreported increase in global chromatin rigidity in yeast. This stiffening of the chromatin fiber as a response to DSB is distinct from the decondensation of chromatin reported in previous studies in mammalian cells (Takahashi & Kaneko, 1985; Kruhlak et al, 2006; Ziv et al, 2006; Luijsterburg et al, 2012) and recently in yeast (Hauer et al, 2017) and also differs from previously proposed increased flexibility (reduction of rigidity) (Seeber et al, 2014). We note that chromatin stiffening at the site of targeted DSB and throughout the genome was invoked in another recent study of chromatin dynamics in diploid yeast, suggesting that increased rigidity can occur locally and globally (Miné‐Hattab et al, 2016). Since our data pertain only to global changes, we cannot rule out different alterations in chromatin structure around the damaged sites, such as decondensation or on the contrary condensation (Khurana et al, 2014; Price & D'Andrea, 2013). It is interesting to note that studies in mammalian cells have reported increased chromatin compaction ~3 μm away from laser‐induced DNA damage sites (Hinde et al, 2014). Since this distance is larger than the yeast nucleus, it is tempting to speculate that an evolutionarily conserved mechanism provokes chromatin alterations over ranges of multiple μm from the DSB location. We also cannot rule out transient relaxations of the chromatin fiber occurring at earlier time points after DNA damage, as observed before (Kruhlak et al, 2006; Khurana et al, 2014). Addressing the temporal sequence of chromatin structure alterations will therefore require follow‐up studies.
Our results support the notion that global chromatin stiffening is responsible at least in part for the increase in chromatin dynamics observed in response to DNA damage at time scales of ~0.1–10 s. This provides a novel mechanism in addition to the recently proposed role of centromeric relaxation (Strecker et al, 2016). While we cannot exclude a direct effect of Zeocin on chromatin structure independent of DSBs, our data suggest that phosphorylation of histone H2A contributes to the molecular basis of chromatin stiffening, since it can account for sizeable fraction of the increase in intrachromosomal distances. However, more work is needed to identify additional factors affecting chromatin properties in response to DNA damage, such as checkpoint effectors or repair proteins.
An important question is whether and how a localized DSB can alter chromatin structure and rigidity on other chromosomes (in trans). Although our Zeocin experiments are consistent with chromatin stiffening throughout the genome, they can also be explained by chromatin alterations restricted in cis to the broken chromosome, provided that the number of DSBs per cell is sufficiently high. However, the increased chromatin mobility in trans of a targeted DSB observed by us and others (Miné‐Hattab & Rothstein, 2012; Strecker et al, 2016) argues for chromatin stiffening across the genome. A global stiffening of chromatin can also explain the Zeocin observations without requiring a high frequency of DSBs. If H2A phosphorylation is also responsible for chromatin stiffening and enhanced mobility in trans, it remains to be understood by which mechanism this histone modification propagates to other chromosomes.
The reported stiffening of the chromatin fiber has a number of consequences for chromosome organization and function. Stiffer chromosomes lead to reduced chromosome folding and less frequent short‐range intrachromosomal contacts (Rosa et al, 2010). This in turn will affect processes that involve chromosomal contacts, such as DNA repair by homologous recombination or mating type switching (Haber et al, 2012; Agmon et al, 2013; Wong et al, 2013; Lee et al, 2016). Introducing chromatin stiffening in computational models of yeast chromosomes might result in a better quantitative account of DNA recombination and its kinetics (Agmon et al, 2013; Wong et al, 2013). If chromatin stiffening takes place in higher eukaryotes, it might also influence gene regulatory processes that depend on chromosome folding, such as enhancer–promoter interactions (Sanyal et al, 2012). Thus, our results point to a key role of altered physical chromatin properties in the response to DNA damage and contribute to a better understanding of the links between chromosome organization and function.
Materials and Methods
Yeast cell culture
Yeast cells were grown overnight at 30°C, diluted 1:50, and grown for two generations. Cells were plated on agarose patches (made of synthetic complete medium containing 2% agarose) and sealed using VaLaP (1/3 Vaseline, 1/3 Lanoline, and 1/3 Paraffin). When relevant, Zeocin was added to the culture 1, 2, 4, or 6 h before imaging. All strains used in this study are listed in Appendix Table S1.
Fluorescent labeling
Fluorescent labeling of single loci or pairs of loci was done using the classical Tet/Lac system (Robinett et al, 1996). For single‐locus labeling, we inserted 128 Lac operator (LacO) repeats next to the locus of interest and expressed the repressor (LacI) fused to eGFP. To label a second locus, we used an array of 256 Tet operator sequences (TetO) and the repressor (TetR) fused to mRFP.
Widefield microscopy
Live cell imaging was done using a widefield microscopy system featuring a Nikon Ti‐E body equipped with the Perfect Focus System and a 60× oil immersion objective with a numerical aperture of 1.4 (Nikon, Plan APO). We used an Andor Neo sCMOS camera, which features a large field of view of 276 × 233 μm at a pixel size of 108 nm. We acquired 3D z‐stacks consisting of 35 frames with z‐steps of 300 nm. We used a dual band filter set (eGFP, mRFP) and for each z position acquired two color channels consecutively with an exposure time of 100 ms. The complete imaging system including camera, piezo, LEDs (SpectraX) was controlled by the Andor IQ2 software.
Sample preparation for PALM/STORM
First, 18‐mm coverslips (#1.5) were washed three times in acetone and methanol and rinsed in distilled water. Next, the coverslips were sonicated for 1 h in a 1 M potassium hydroxide solution. The coverslips were treated with poly‐d‐lysine as recommended by Sigma‐Aldrich. Yeast cells expressing LacI‐GFP were subjected to cell wall removal, then deposed on the coverslips, and labeled with anti‐GFP nanobodies conjugated to the dye Alexa647 (GFP‐booster from ChromoTek).
A Parafilm sheet was stuck to the microscopy slides. A square hole fitting the round coverslip was cut into the Parafilm and filled with freshly prepared oxygen scavenger buffer containing 50 mM of MEA, 169 AU of glucose oxidase, 10% of glucose, 1,404 AU of catalase, Tris–HCl (pH = 8). The labeled cells were placed directly in contact with this buffer in a homemade holder. Then, the coverslip was deposed on the Parafilm, placing cells in direct contact with the buffer, and hermetically sealed with a nail polish.
Widefield image analysis and statistics
Image analysis was performed using Fiji plugins (Schindelin et al, 2012). First, images were corrected for chromatic aberrations using the plugin “Descriptor‐based registration (2d/3d)” found under Fiji (version 1.47d) > Plugins > Registration. This correction was done in three steps: First, we calculated an affine transform matrix using images of the cells with the single locus labeled with TetR‐eGFP and TetR‐mRFP; then, we tested this correction matrix on a different stack of images of the same strain, obtaining an estimation of random localization errors (Appendix Fig S4); finally, we applied the correction matrix to all acquired images. After converting 3D z‐stacks to 2D images using maximum intensity projection, we manually selected non‐dividing cells and computed the (x, y) coordinates of the red and green loci using a custom‐made Fiji plugin implementing Gaussian fitting. Comparisons between pairs of empirical distance distributions were done using Wilcoxon rank‐sum tests. Comparisons of empirical distance distributions to Gaussian models (Figs 2B and EV2) were done using two‐sample Kolmogorov–Smirnov tests. Both tests provide a low P‐value for statistically significant differences. For tracking in time‐lapse microscopy, we used the same custom‐written Fiji plugin, which allowed to extract locus positions over the entire time course for each nucleus. These trajectories were further analyzed by a custom‐made MATLAB script that corrected global displacements and computed MSD curves for each trajectory using non‐overlapping time intervals as, for example, in Cabal et al (2006). For Fig 1 and Appendix Fig S2B, these curves were further averaged over all cells in the population. Finally, other MATLAB scripts were used to fit power laws to individual MSD curves or population‐averaged MSD over time intervals 0.1–10 s.
PALM/STORM imaging of LacI‐GFP and analysis
The coverslip was placed under a 100× oil immersion TIRF objective lens (NA 1.49) installed on a Nikon Ti‐E Eclipse microscope equipped with the Perfect Focus System. Raw images were acquired on an EM‐CCD camera (Andor, IXON ultra 897). A low‐power 488 nm laser (MPB communication) was used to excite the GFP signal, and a 256 × 256 field of view (pixel size = 106 nm) was selected. A red 642 nm laser (Coherent) was used to excite single A647 molecules using Hilo illumination to reduce out‐of‐focus light (Tokunaga et al, 2008). We acquired sequences of 2,000–10,000 images with 100 ms exposure time. During acquisition, a 405‐nm laser was pulsed at low power to recover single‐molecule fluorescence from the dark state.
After acquisition, each sequence of diffraction‐limited images was processed with a modified version of the MTT software (Sergé et al, 2008). A custom‐made MATLAB software was used to correct for spatial drift using fiducial markers or cross‐correlation of the raw images and to fuse repeated localizations of the same molecule.
The LacI‐GFP locus was detected from the green color channel using the PeakFit algorithm of the GDSC ImageJ plugin. This algorithm fits a 2D Gaussian function to each detected spot, allowing us to measure its size. The STORM localization data from the red color channel were registered to the widefield green channel image using custom‐made MATLAB scripts. For each locus, we restricted the analysis of single‐molecule A647 localizations to those within a circle around the spot center of radius 1.4 times the largest standard deviation of the fitted Gaussian. This value was chosen empirically to encompass the vicinity of each locus and minimize the inclusion of unspecific signal. After automatic removal of outliers, we then measured the shape of the localization cloud for each LacI‐GFP spot by computing the largest and smallest eigenvalues, λ 1 and λ 2, of the covariance matrix using the MATLAB function pca. We discarded localization clouds with less than n = 20 localizations.
Analytical and numerical polymer models
Equations for mean square distances between loci were obtained from an ideal chain model. Model predictions in Fig 5 were obtained from Langevin dynamics simulations of yeast chromosomes (Wong et al, 2012, 2013; Arbona et al, 2017). See details in the Appendix Supplementary Methods.
Author contributions
SH: Videomicroscopy, image analysis, and initial Zeocin experiments. AB: all subsequent Zeocin experiments and mutants. J‐MA: Polymer modeling. ML, AV, FGF, EA, EB, EF: Additional experiments. ML, BL, JP, YK, CZ: Additional image analysis and modeling. EF, CZ: Supervised the study.
Conflict of interest
The authors declare that they have no conflict of interest.
Supporting information
Appendix
Expanded View Figures PDF
Review Process File
Acknowledgements
We thank K. N'Thiombane for initial experiments, R. Henriques and J‐Y. Tinevez for help with image analysis, D. Durocher and S. Marcand for cep3S575A and H2AS129A mutants, respectively, M. Kupiec for suggestions on an early version of the manuscript, J. Miné‐Hattab, X. Darzacq, C. Muchardt and J. Haber for helpful discussions. C.Z. acknowledges support from the Siebel Stem Cell Foundation during a visit to UC Berkeley, where an early version of the manuscript was completed. A.B, A.V, F.G‐F, E.A, Y.K, and E.F. acknowledge support from Agence Nationale de la Recherche (ANR‐13‐BSV8‐0013‐01), IDEX SLI (DXCAIUHSLI‐EF14), Labex Who am I (ANR‐11‐LABX‐0071, IDEX ANR‐11‐IDEX‐0005‐02), Cancéropôle Ile de France (ORFOCRISE PME‐2015). Y.K and EF acknowledge support from Fondation pour la Recherche Médicale (ING20160435205). S.H., J‐M.A., M.L., B.L., J.P., and C.Z. acknowledge funding by Institut Pasteur (including a Roux fellowship for J‐M.A.), Agence Nationale de la Recherche (ANR‐11‐MONU‐020–02), Institut National du Cancer (INCa 2015‐135), and Fondation pour la Recherche Médicale (Equipe FRM DEQ20150331762).
The EMBO Journal (2017) 36: 2595–2608
Contributor Information
Emmanuelle Fabre, Email: emmanuelle-g.fabre@inserm.fr.
Christophe Zimmer, Email: czimmer@pasteur.fr.
References
- Agmon N, Liefshitz B, Zimmer C, Fabre E, Kupiec M (2013) Effect of nuclear architecture on the efficiency of double‐strand break repair. Nat Cell Biol 15: 694–699 [DOI] [PubMed] [Google Scholar]
- Albert B, Mathon J, Shukla A, Saad H, Normand C, Léger‐Silvestre I, Villa D, Kamgoue A, Mozziconacci J, Wong H, Zimmer C, Bhargava P, Bancaud A, Gadal O (2013) Systematic characterization of the conformation and dynamics of budding yeast chromosome XII. J Cell Biol 202: 201–210 [DOI] [PMC free article] [PubMed] [Google Scholar]
- Arbona J‐M, Herbert S, Fabre E, Zimmer C (2017) Inferring the physical properties of yeast chromatin through Bayesian analysis of whole nucleus simulations. Genome Biol 18: 81 [DOI] [PMC free article] [PubMed] [Google Scholar]
- Avşaroğlu B, Bronk G, Gordon‐Messer S, Ham J, Bressan DA, Haber JE, Kondev J (2014) Effect of chromosome tethering on nuclear organization in yeast. PLoS ONE 9: e102474 [DOI] [PMC free article] [PubMed] [Google Scholar]
- Backlund MP, Joyner R, Weis K, Moerner WE (2014) Correlations of three‐dimensional motion of chromosomal loci in yeast revealed by the Double‐Helix Point Spread Function microscope. Mol Biol Cell 25: 3619–3629 [DOI] [PMC free article] [PubMed] [Google Scholar]
- Baroni E, Viscardi V, Cartagena‐Lirola H, Lucchini G, Longhese MP (2004) The functions of budding yeast Sae2 in the DNA damage response require Mec1‐ and Tel1‐dependent phosphorylation. Mol Cell Biol 24: 4151–4165 [DOI] [PMC free article] [PubMed] [Google Scholar]
- Berger AB, Cabal GG, Fabre E, Duong T, Buc H, Nehrbass U, Olivo‐Marin JC, Gadal O, Zimmer C (2008) High‐resolution statistical mapping reveals gene territories in live yeast. Nat Methods 5: 1031–1037 [DOI] [PubMed] [Google Scholar]
- Bonilla CY, Melo JA, Toczyski DP (2008) Colocalization of sensors is sufficient to activate the DNA damage checkpoint in the absence of damage. Mol Cell 30: 267–276 [DOI] [PMC free article] [PubMed] [Google Scholar]
- Bystricky K, Heun P, Gehlen L, Langowski J, Gasser SM (2004) Long‐range compaction and flexibility of interphase chromatin in budding yeast analyzed by high‐resolution imaging techniques. Proc Natl Acad Sci USA 101: 16495–16500 [DOI] [PMC free article] [PubMed] [Google Scholar]
- Cabal GG, Genovesio A, Rodriguez‐Navarro S, Zimmer C, Gadal O, Lesne A, Buc H, Feuerbach‐Fournier F, Olivo‐Marin JC, Hurt EC, Nehrbass U (2006) SAGA interacting factors confine sub‐diffusion of transcribed genes to the nuclear envelope. Nature 441: 770–773 [DOI] [PubMed] [Google Scholar]
- Chiariello AM, Annunziatella C, Bianco S, Esposito A, Nicodemi M (2016) Polymer physics of chromosome large‐scale 3D organisation. Sci Rep 6: 29775 [DOI] [PMC free article] [PubMed] [Google Scholar]
- Clerici M, Mantiero D, Lucchini G, Longhese MP (2005) The Saccharomyces cerevisiae Sae2 protein promotes resection and bridging of double strand break ends. J Biol Chem 280: 38631–38638 [DOI] [PubMed] [Google Scholar]
- Cui Y, Bustamante C (2000) Pulling a single chromatin fiber reveals the forces that maintain its higher‐order structure. Proc Natl Acad Sci USA 97: 127–132 [DOI] [PMC free article] [PubMed] [Google Scholar]
- Daoud M, Cotton JP (1982) Star shaped polymers: a model for the conformation and its concentration dependence. Journal de Physique 433: 531–538 [Google Scholar]
- De Gennes PG (1979) Scaling concepts in polymer physics. Ithaca, NY: Cornell University Press; [Google Scholar]
- Dion V, Kalck V, Horigome C, Towbin BD, Gasser SM (2012) Increased mobility of double‐strand breaks requires Mec1, Rad9 and the homologous recombination machinery. Nat Cell Biol 14: 502–509 [DOI] [PubMed] [Google Scholar]
- Doherty KM, Pride LD, Lukose J, Snydsman BE, Charles R, Pramanik A, Muller EG, Botstein D, Moore CW (2012) Loss of a 20S proteasome activator in Saccharomyces cerevisiae downregulates genes important for genomic integrity, increases DNA damage, and selectively sensitizes cells to agents with diverse mechanisms of action. G3: Genes ‐ Genomes ‐ Genetics 2: 943–959 [DOI] [PMC free article] [PubMed] [Google Scholar]
- Haber JE, Abraham J, Nasmyth KA, Strathern JN, Klar AJ, Hicks JB, Amati BB, Gasser SM, Ansari A, Gartenberg MR, Arcangioli B, Arcangioli B, de Lahondes R, Astell CR, Ahlstrom‐Jonasson L, Smith M, Tatchell K, Nasmyth KA, Aström SU, Rine J et al (2012) Mating‐type genes and MAT switching in Saccharomyces cerevisiae . Genetics 191: 33–64 [DOI] [PMC free article] [PubMed] [Google Scholar]
- Hajjoul H, Mathon J, Ranchon H, Goiffon I, Mozziconacci J, Albert B, Carrivain P, Victor J‐M, Gadal O, Bystricky K, Bancaud A (2013) High‐throughput chromatin motion tracking in living yeast reveals the flexibility of the fiber throughout the genome. Genome Res 23: 1829–1838 [DOI] [PMC free article] [PubMed] [Google Scholar]
- Hauer MH, Seeber A, Singh V, Thierry R, Sack R, Amitai A, Kryzhanovska M, Eglinger J, Holcman D, Owen‐Hughes T, Gasser SM (2017) Histone degradation in response to DNA damage enhances chromatin dynamics and recombination rates. Nat Struct Mol Biol 24: 99–107 [DOI] [PubMed] [Google Scholar]
- He X, Asthana S, Sorger PK (2000) Transient sister chromatid separation and elastic deformation of chromosomes during mitosis in budding yeast. Cell 101: 763–775 [DOI] [PubMed] [Google Scholar]
- Heun P, Laroche T, Shimada K, Furrer P, Gasser SM (2001) Chromosome dynamics in the yeast interphase nucleus. Science 294: 2181–2186 [DOI] [PubMed] [Google Scholar]
- Hinde E, Kong X, Yokomori K, Gratton E (2014) Chromatin dynamics during DNA repair revealed by pair correlation analysis of molecular flow in the nucleus. Biophys J 107: 55–65 [DOI] [PMC free article] [PubMed] [Google Scholar]
- Imakaev MV, Fudenberg G, Mirny LA (2015) Modeling chromosomes: beyond pretty pictures. FEBS Lett 589: 3031–3036 [DOI] [PMC free article] [PubMed] [Google Scholar]
- Jackson SP, Downs JA, Lowndes NF (2000) A role for Saccharomyces cerevisiae histone H2A in DNA repair. Nature 408: 1001–1004 [DOI] [PubMed] [Google Scholar]
- Khurana S, Kruhlak MJ, Kim J, Tran AD, Liu J, Nyswaner K, Shi L, Jailwala P, Sung M‐H, Hakim O, Oberdoerffer P (2014) A macrohistone variant links dynamic chromatin compaction to BRCA1‐dependent genome maintenance. Cell Rep 8: 1049–1062 [DOI] [PMC free article] [PubMed] [Google Scholar]
- Kim J‐A, Kruhlak M, Dotiwala F, Nussenzweig A, Haber JE (2007) Heterochromatin is refractory to γ‐H2AX modification in yeast and mammals. J Cell Biol 178: 209–218 [DOI] [PMC free article] [PubMed] [Google Scholar]
- Kruhlak MJ, Celeste A, Dellaire G, Fernandez‐Capetillo O, Müller WG, McNally JG, Bazett‐Jones DP, Nussenzweig A (2006) Changes in chromatin structure and mobility in living cells at sites of DNA double‐strand breaks. J Cell Biol 172: 823–834 [DOI] [PMC free article] [PubMed] [Google Scholar]
- Lawrimore J, Aicher JK, Hahn P, Fulp A, Kompa B, Vicci L, Falvo M, Taylor RM, Bloom K (2016) ChromoShake: a chromosome dynamics simulator reveals that chromatin loops stiffen centromeric chromatin. Mol Biol Cell 27: 153–166 [DOI] [PMC free article] [PubMed] [Google Scholar]
- Lee C‐S, Wang RW, Chang H‐H, Capurso D, Segal MR, Haber JE (2016) Chromosome position determines the success of double‐strand break repair. Proc Natl Acad Sci USA 113: E146–E154 [DOI] [PMC free article] [PubMed] [Google Scholar]
- Lisby M, Rothstein R, Mortensen UH (2001) Rad52 forms DNA repair and recombination centers during S phase. Proc Natl Acad Sci USA 98: 8276–8282 [DOI] [PMC free article] [PubMed] [Google Scholar]
- Luijsterburg MS, Lindh M, Acs K, Vrouwe MG, Pines A, van Attikum H, Mullenders LH, Dantuma NP (2012) DDB2 promotes chromatin decondensation at UV‐induced DNA damage. J Cell Biol 197: 267–281 [DOI] [PMC free article] [PubMed] [Google Scholar]
- Marshall WF, Straight A, Marko JF, Swedlow J, Dernburg A, Belmont A, Murray AW, Agard DA, Sedat JW (1997) Interphase chromosomes undergo constrained diffusional motion in living cells. Curr Biol 7: 930–939 [DOI] [PubMed] [Google Scholar]
- Miné‐Hattab J, Rothstein R (2012) Increased chromosome mobility facilitates homology search during recombination. Nat Cell Biol 14: 510–517 [DOI] [PubMed] [Google Scholar]
- Miné‐Hattab J, Rothstein R (2013) DNA in motion during double‐strand break repair. Trends Cell Biol 23: 529–536 [DOI] [PMC free article] [PubMed] [Google Scholar]
- Miné‐Hattab J, Recamier V, Izeddin I, Rothstein R, Darzacq X (2016) Chromatin mobility after DNA damage is modified to enhance long distance explorations and minimize local resampling. bioRxiv https://doi.org/10.1101/042051 [Google Scholar]
- Nestler EJ, Greengard P (1999) Protein phosphorylation is of fundamental importance in biological regulation. In Basic neurochemistry: molecular, cellular and medical aspects, 6th edn. Philadelphia, PA: Lippincott‐Raven; [Google Scholar]
- Neumann FR, Dion V, Gehlen LR, Tsai‐Pflugfelder M, Schmid R, Taddei A, Gasser SM (2012) Targeted INO80 enhances subnuclear chromatin movement and ectopic homologous recombination. Genes Dev 26: 369–383 [DOI] [PMC free article] [PubMed] [Google Scholar]
- Papamichos‐Chronakis M, Peterson CL (2013) Chromatin and the genome integrity network. Nat Rev Genet 14: 62–75 [DOI] [PMC free article] [PubMed] [Google Scholar]
- Price BD, D'Andrea AD (2013) Chromatin remodeling at DNA double‐strand breaks. Cell 152: 1344–1354 [DOI] [PMC free article] [PubMed] [Google Scholar]
- Qian M‐X, Pang Y, Liu CH, Haratake K, Du B‐Y, Ji D‐Y, Wang G‐F, Zhu Q‐Q, Song W, Yu Y, Zhang X‐X, Huang H‐T, Miao S, Chen L‐B, Zhang Z‐H, Liang Y‐N, Liu S, Cha H, Yang D, Zhai Y et al (2013) Acetylation‐mediated proteasomal degradation of core histones during DNA repair and spermatogenesis. Cell 153: 1012–1024 [DOI] [PMC free article] [PubMed] [Google Scholar]
- Redon C, Pilch D, Rogakou E, Sedelnikova O, Newrock K, Bonner W (2002) Histone H2A variants H2AX and H2AZ. Curr Opin Genet Dev 12: 162–169 [DOI] [PubMed] [Google Scholar]
- Renkawitz J, Lademann CA, Jentsch S (2014) Mechanisms and principles of homology search during recombination. Nat Rev Mol Cell Biol 15: 369–383 [DOI] [PubMed] [Google Scholar]
- Ries J, Kaplan C, Platonova E, Eghlidi H, Ewers H (2012) A simple, versatile method for GFP‐based super‐resolution microscopy via nanobodies. Nat Methods 9: 582–584 [DOI] [PubMed] [Google Scholar]
- Robinett CC, Straight A, Li G, Willhelm C, Sudlow G, Murray A, Belmont AS (1996) In vivo localization of DNA sequences and visualization of large‐scale chromatin organization using lac operator/repressor recognition. J Cell Biol 135: 1685–1700 [DOI] [PMC free article] [PubMed] [Google Scholar]
- Rogakou EP (1999) Megabase chromatin domains involved in DNA double‐strand breaks in vivo . J Cell Biol 146: 905–916 [DOI] [PMC free article] [PubMed] [Google Scholar]
- Rosa A, Becker NB, Everaers R (2010) Looping probabilities in model interphase chromosomes. Biophys J 98: 2410–2419 [DOI] [PMC free article] [PubMed] [Google Scholar]
- Rosa A, Zimmer C (2014) Computational models of large‐scale genome architecture. Int Rev Cell Mol Biol 307: 275–349 [DOI] [PubMed] [Google Scholar]
- Rubinstein M, Colby R (2003) Polymer physics. New York: Oxford University Press; [Google Scholar]
- Sanyal A, Lajoie BR, Jain G, Dekker J (2012) The long‐range interaction landscape of gene promoters. Nature 489: 109–113 [DOI] [PMC free article] [PubMed] [Google Scholar]
- Sarangi P, Steinacher R, Altmannova V, Fu Q, Paull TT, Krejci L, Whitby MC, Zhao X (2015) Sumoylation influences DNA break repair partly by increasing the solubility of a conserved end resection protein. PLoS Genet 11: e1004899 [DOI] [PMC free article] [PubMed] [Google Scholar]
- Schiessel H (2003) The physics of chromatin. J Phys Condens Matter 15: R699–R774 [DOI] [PubMed] [Google Scholar]
- Schindelin J, Arganda‐Carreras I, Frise E, Kaynig V, Longair M, Pietzsch T, Preibisch S, Rueden C, Saalfeld S, Schmid B, Tinevez JY (2012) Fiji: an open‐source platform for biological‐image analysis. Nat Methods 9: 676–682 [DOI] [PMC free article] [PubMed] [Google Scholar]
- Seeber A, Dion V, Gasser SM (2013) Checkpoint kinases and the INO80 nucleosome remodeling complex enhance global chromatin mobility in response to DNA damage. Genes Dev 27: 1999–2008 [DOI] [PMC free article] [PubMed] [Google Scholar]
- Seeber A, Dion V, Gasser SM (2014) Remodelers move chromatin in response to DNA damage. Cell Cycle 13: 877–878 [DOI] [PMC free article] [PubMed] [Google Scholar]
- Sergé A, Bertaux N, Rigneault H, Marguet D (2008) Dynamic multiple‐target tracing to probe spatiotemporal cartography of cell membranes. Nat Methods 5: 687–694 [DOI] [PubMed] [Google Scholar]
- Shi L, Oberdoerffer P (2012) Chromatin dynamics in DNA double‐strand break repair. Biochim Biophys Acta 1819: 811–819 [DOI] [PMC free article] [PubMed] [Google Scholar]
- Spichal M, Brion A, Herbert S, Cournac A, Marbouty M, Zimmer C, Koszul R, Fabre E (2016) Evidence for a dual role of actin in regulating chromosome organization and dynamics in yeast. J Cell Sci 129: 681–692 [DOI] [PubMed] [Google Scholar]
- Steinhauser MO (2008) Static and dynamic scaling of semiflexible polymer chains—a molecular dynamics simulation study of single chains and melts. Mech Time Depend Mater 12: 291–312 [Google Scholar]
- Strecker J, Gupta GD, Zhang W, Bashkurov M, Landry M‐C, Pelletier L, Durocher D (2016) DNA damage signalling targets the kinetochore to promote chromatin mobility. Nat Cell Biol 18: 281–290 [DOI] [PubMed] [Google Scholar]
- Takahashi K, Kaneko I (1985) Changes in nuclease sensitivity of mammalian cells after irradiation with 60Co γ‐rays. Int J Radiat Biol Relat Stud Phys Chem Med 48: 389–395 [DOI] [PubMed] [Google Scholar]
- Thérizols P, Duong T, Dujon B, Zimmer C, Fabre E (2010) Chromosome arm length and nuclear constraints determine the dynamic relationship of yeast subtelomeres. Proc Natl Acad Sci USA 107: 2025 [DOI] [PMC free article] [PubMed] [Google Scholar]
- Tjong H, Gong K, Chen L, Alber F (2012) Physical tethering and volume exclusion determine higher‐order genome organization in budding yeast. Genome Res 22: 1295–1305 [DOI] [PMC free article] [PubMed] [Google Scholar]
- Tokunaga M, Imamoto N, Sakata‐Sogawa K (2008) Highly inclined thin illumination enables clear single‐molecule imaging in cells. Nat Methods 5: 159–161 [DOI] [PubMed] [Google Scholar]
- Tsukuda T, Fleming AB, Nickoloff JA, Osley MA (2005) Chromatin remodelling at a DNA double‐strand break site in Saccharomyces cerevisiae . Nature 438: 379–383 [DOI] [PMC free article] [PubMed] [Google Scholar]
- Vasquez PA, Bloom K (2014) Polymer models of interphase chromosomes. Nucleus 5: 376–390 [DOI] [PMC free article] [PubMed] [Google Scholar]
- Weber SC, Spakowitz AJ, Theriot JA (2010) Bacterial chromosomal loci move subdiffusively through a viscoelastic cytoplasm. Phys Rev Lett 104: 238102 [DOI] [PMC free article] [PubMed] [Google Scholar]
- Weber SC, Spakowitz AJ, Theriot JA (2012) Nonthermal ATP‐dependent fluctuations contribute to the in vivo motion of chromosomal loci. Proc Natl Acad Sci USA 109: 7338–7343 [DOI] [PMC free article] [PubMed] [Google Scholar]
- Wong H, Marie‐Nelly H, Herbert S, Carrivain P, Blanc H, Koszul R, Fabre E, Zimmer C (2012) A predictive computational model of the dynamic 3D interphase yeast nucleus. Curr Biol 22: 1881–1890 [DOI] [PubMed] [Google Scholar]
- Wong H, Arbona J‐M, Zimmer C (2013) How to build a yeast nucleus. Nucleus 4: 361–366 [DOI] [PMC free article] [PubMed] [Google Scholar]
- Zimmer C, Fabre E (2011) Principles of chromosomal organization: lessons from yeast. J Cell Biol 192: 723–733 [DOI] [PMC free article] [PubMed] [Google Scholar]
- Ziv Y, Bielopolski D, Galanty Y, Lukas C, Taya Y, Schultz DC, Lukas J, Bekker‐Jensen S, Bartek J, Shiloh Y (2006) Chromatin relaxation in response to DNA double‐strand breaks is modulated by a novel ATM‐ and KAP‐1 dependent pathway. Nat Cell Biol 8: 870–876 [DOI] [PubMed] [Google Scholar]
Associated Data
This section collects any data citations, data availability statements, or supplementary materials included in this article.
Supplementary Materials
Appendix
Expanded View Figures PDF
Review Process File


