Abstract
The role of second messengers in the diversion of cellular processes by pathogens remains poorly studied despite their importance. Among these, Ca2+ virtually regulates all known cell processes, including cytoskeletal reorganization, inflammation, or cell death pathways. Under physiological conditions, cytosolic Ca2+ increases are transient and oscillatory, defining the so‐called Ca2+ code that links cell responses to specific Ca2+ oscillatory patterns. During cell invasion, Shigella induces atypical local and global Ca2+ signals. Here, we show that by hydrolyzing phosphatidylinositol‐(4,5)bisphosphate, the Shigella type III effector IpgD dampens inositol‐(1,4,5)trisphosphate (InsP3) levels. By modifying InsP3 dynamics and diffusion, IpgD favors the elicitation of long‐lasting local Ca2+ signals at Shigella invasion sites and converts Shigella‐induced global oscillatory responses into erratic responses with atypical dynamics and amplitude. Furthermore, IpgD eventually inhibits InsP3‐dependent responses during prolonged infection kinetics. IpgD thus acts as a pathogen regulator of the Ca2+ code implicated in a versatility of cell functions. Consistent with this function, IpgD prevents the Ca2+‐dependent activation of calpain, thereby preserving the integrity of cell adhesion structures during the early stages of infection.
Keywords: calcium, calpain, IpgD, Shigella, talin
Subject Categories: Microbiology, Virology & Host Pathogen Interaction; Signal Transduction
Introduction
To efficiently colonize tissue and promote infection, pathogens divert host cell signals to induce cytoskeletal rearrangements, or regulate inflammatory signals and tissue integrity (Ashida et al, 2012; Valdivia & Sedwick, 2014; LaRock et al, 2015). In most infection models, however, the role of second messengers has been poorly studied despite their being critical for fundamental functions. Among these, Ca2+ has been involved in the regulation of virtually all known cell processes, including cytoskeletal reorganization, inflammation, or cell death pathways (Berridge et al, 2000; Murakami et al, 2012; Rizzuto et al, 2012). Under physiological conditions, cytosolic Ca2+ increases are transient and often oscillatory, being regulated by an interplay between pumps and channels at the endoplasmic reticulum and plasma membranes (Berridge et al, 2000; Strehler, 2015). The discovery of a so‐called Ca2+ code, associating different cell responses with specific Ca2+ oscillatory patterns, has brought up mechanistic insights into Ca2+ signaling and has established modeling as unique means to apprehend the complexity of Ca2+ processes in integrated systems (Muallem, 2005; Uhlen & Fritz, 2010). Shigella, the agent of bacillary dysentery, invades colonic epithelial cells where it disseminates causing an intense inflammation responsible for the destruction of the mucosa (Ashida et al, 2012; Tanner et al, 2015). Disease progression involves an arsenal of bacterial effectors enabling lysis of the phagocytic vacuole, intracellular replication, and bacterial spreading (Kuehl et al, 2015). Shigella effectors injected in the host cell cytosol by the Shigella type III secretion system (T3SS) play a major role in these different steps (Galan et al, 2014; Ashida et al, 2015). While Shigella intracellular replication eventually leads to epithelial cell destruction, efficient bacterial spreading requires the delay of cell death processes and the maintenance of cell integrity (Carneiro et al, 2009; Ashida et al, 2014). During invasion, Shigella triggers InsP3‐dependent Ca2+ responses that differ from agonist‐induced Ca2+ responses. Shigella‐induced Ca2+ responses consist of isolated global increases of varying amplitude and dynamics, as well as local Ca2+ responses with durations exceeding several seconds termed RATPs for responses associated with trespassing pathogens (Tran Van Nhieu et al, 2013). We reasoned that the atypical aspects of these responses were due to the action of one or several bacterial effectors. Among Shigella effectors, the type III effector IpgD is as a phosphatidyl‐(4, 5)bisphosphate (PI(4,5)P2)‐4‐phosphatase regulating cytoskeletal remodeling, cell survival, endosomal trafficking, or macropinosome formation around invading bacteria (Niebuhr et al, 2002; Konradt et al, 2011; Mellouk et al, 2014; Boal et al, 2016; Weiner et al, 2016). PI(4,5)P2 is the main substrate used by phospholipases C (PLCs) to produce InsP3, and it is expected that a general depletion of PI(4,5)P2 will impact on InsP3 levels. However, as opposed to agonists acting diffusely and synchronously on cell surface receptors triggering InsP3‐mediated Ca2+ release, Shigella only interacts with a discrete area of the cell plasma membrane and invasion events are not synchronized. As a consequence, the overall levels of cell substrates targeted by injected type III effectors are not expected to be limiting, in particular at the onset of the invasion process. It is therefore unclear whether the PI(4,5)P2 phosphatase activity of IpgD could affect Ca2+ signaling during bacterial invasion. Any detected effects could provide insights into the local aspect of bacterial stimulation and the transition from local to global Ca2+ responses. These reasons prompted us to study the effects of IpgD on Ca2+ signaling during bacterial invasion.
Results
IpgD down‐regulates the recruitment of InsP3 receptors and InsP3 levels during Shigella invasion
During Shigella invasion, the atypical duration of bacterial‐induced local Ca2+ responses was shown to depend on the confinement of InsP3 and enrichment of InsP3 receptors (IP3Rs) at bacterial entry sites (Tran Van Nhieu et al, 2013). We reasoned that through its action on PI(4,5)P2, IpgD could regulate InsP3‐mediated signaling.
We first analyzed the effects of IpgD on the recruitment of the InsP3 receptors at invasion foci induced by an ipgD mutant isogenic to wild‐type Shigella (Niebuhr et al, 2002). As shown in Fig 1A and B and as previously observed in HeLa cells, the InsP3 receptor type 1 (IP3R1) was enriched by 1.5‐fold as early as 5 min following bacterial challenge for both wild‐type and ipgD mutant strains. While this enrichment factor only moderately increased for wild‐type Shigella at later stages of focus formation, however, invasion foci induced by the ipgD mutant showed a drastic increase in IP3R1 enrichment, reaching 2.2‐fold after 30 min (Fig 1B). Consistent with a role for IpgD‐mediated hydrolysis of PI(4,5)P2 in IP3R1 recruitment, invasion foci induced by an ipgD mutant complemented with catalytically inactive IpgD C438S also showed a similar increase in IP3R1 enrichment compared to the ipgD strain complemented with wild‐type IpgD (Fig EV1).
Figure 1. IpgD down‐regulates IP3R recruitment and InsP3 levels during Shigella invasion.
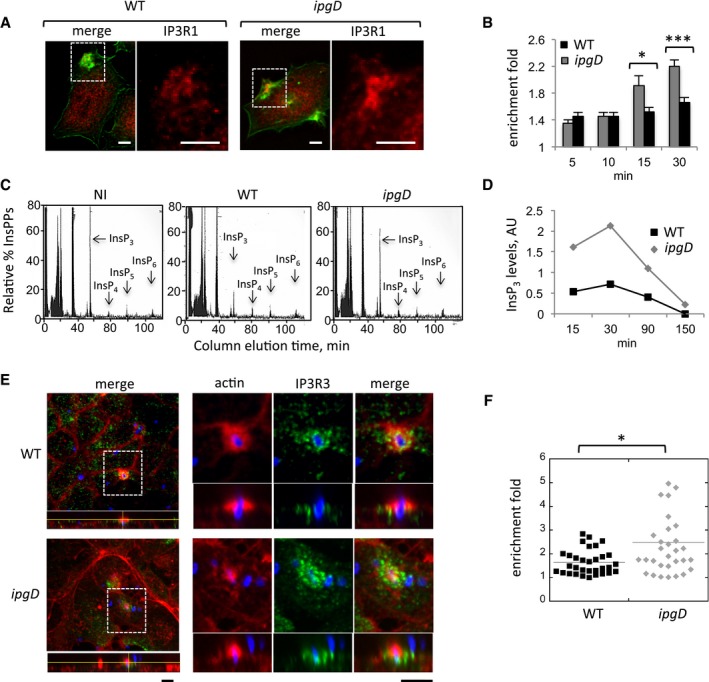
- Representative confocal fluorescence images of cells challenged with the indicated bacterial strains for 15 min at 37°C and processed for immunofluorescence staining. The right panels are higher magnifications of the corresponding boxed inset. Red: IP3R1; green: actin. Scale bar = 5 μm.
-
The enrichment fold of IP3R1 at invasion foci ± SEM was determined at the indicated time points (Materials and Methods). WT Shigella: solid bars; ipgD mutant: gray bars.N = 3,200 foci. Wilcoxon test, *P = 0.0220; ***P = 2.7 × 10⁻¹⁵.
- Cells were labeled with H3‐myo‐inositol and challenged with the indicated bacteria for 30 min at 37°C. IPPs were analyzed by anion‐exchange chromatography as described (Leyman et al, 2007). InsPP elution profiles are shown. Note the decrease in InsP3 levels during infection with WT Shigella.
- The ratio of InsP3 relative to initial levels in uninfected cells was determined from measurements as in panel (C) in extracts from cells challenged with WT Shigella (black squares) or the ipgD mutant (gray diamonds). The time post‐infection is indicated.
- Polarized TC7 cell monolayers were challenged with the indicated bacterial strains for 20 min at 37°C and processed for immunofluorescence staining. The IP3R3 panel is a higher magnification of the corresponding boxed inset. Green: IP3R3; red: actin; blue: bacterial LPS. Scale bar = 5 μm.
- The enrichment fold of IP3R3 at invasion foci was determined for the indicated strains. Each mark represents a determination. N = 2, Wilcoxon test, *P = 0.033.
Figure EV1. The catalytic activity of IpgD is required for down‐regulation of IP3R1 recruitment at invasion sites.
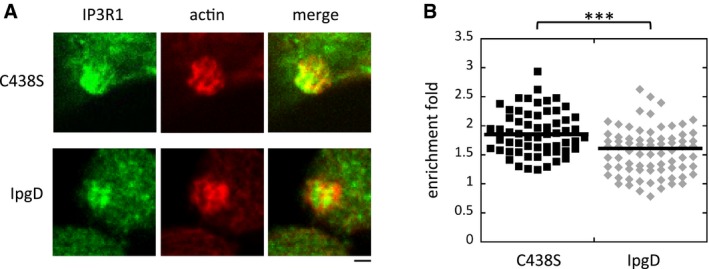
- Representative confocal fluorescence images of HeLa cells challenged with the ipgD mutant complemented with catalytically inactive IpgD C438S (C48S) or wild‐type IpgD (IpgD) for 15 min at 37°C and processed for immunofluorescence staining. Green: IP3R1; red: actin. Scale bar = 5 μm.
- The enrichment fold of IP3R1 at invasion foci was determined for the indicated strains. Each mark represents a determination. N = 2, Wilcoxon rank‐sum test. ***P ≤ 0.005.
We next wanted to determine whether IpgD affected the levels of InsP3 during Shigella invasion. Cells were metabolically labeled with H3‐inositol, and inositol‐polyphosphates (InsPPs) were measured (Materials and Methods). As shown in Fig 1C, among the InsPPs, InsP3 levels were much higher in cells infected with the ipgD mutant as compared to WT Shigella. For both strains, however, InsP3 dropped to undetectable levels after 150 min of infection, suggesting that IpgD regulated InsP3‐mediated signaling during the early phases of infection (Fig 1D). Together, these results are consistent with the depletion of PI(4,5)P2 by IpgD, leading to decreased InsP3 levels during Shigella invasion. When PI(4,5)P2 recruitment was analyzed at Shigella invasion sites with a GFP‐PH‐PLCδ probe (Materials and Methods; Balla & Varnai, 2009), enrichment could be detected as early as 5 min following cell contact and peaked at 15 min, with kinetics that paralleled those of bacterial internalization (Appendix Fig S1). Similar to I3R1, PI(4,5)P2 recruitment at foci induced by the ipgD mutant was significantly higher than that observed in foci induced by WT Shigella (Appendix Fig S1).
To confirm these results in a more relevant cell system, we analyzed the recruitment of IP3R in intestinal epithelial TC7 cell monolayers that were allowed to polarize for 7 days (Materials and Methods). As opposed to HeLa cells, TC7 cells do not express IP3R1 but mainly IP3R type 3 (IP3R3) (Shibao et al, 2010). Apical staining of the junctional marker ZO‐1 confirmed that cells were polarized under the conditions used (Appendix Fig S2A). As shown in Fig 1E, polarized TC‐7 cells presented a granular pattern of IP3R3 diffusively distributed over their cytoplasm. As previously observed, while much less efficient than in non‐polarized HeLa cells, bacterial invasion could also be detected at the apical surface of polarized TC7 cells (Mounier et al, 1992; Romero et al, 2011). IP3R3 recruitment could be detected at these invasion sites, with IP3R3 trapped within or outlining bacterial‐induced actin foci (Figs 1E and EV3B). As observed for IP3R1 in non‐polarized cells, recruitment was more important in foci induced by the ipgD mutant compared to wild‐type Shigella (Fig 1E and F, Appendix Fig S2B).
Figure EV3. The ipgD/IpgDC438S mutant predominantly induces global Ca2+ responses during invasion.
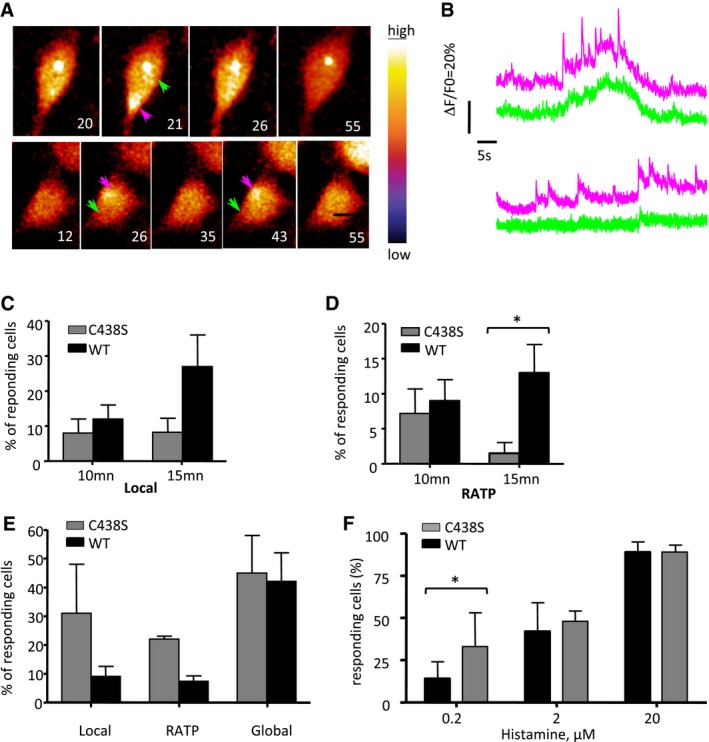
- HeLa cells were loaded with Fluo‐4‐AM and challenged with the ipgD mutant strain complemented with catalytically inactive IpgD C438S. Left: Phase‐contrast images. Right: Time series of Fluo‐4 fluorescence of the corresponding fields depicted with the indicated color code. The elapsed time from the start of acquisition is indicated in seconds. Arrowheads: invasion foci (purple); control area (green). Scale bar = 5 μm.
- Traces of Ca2+ variations in area pointed to by the arrow with the corresponding color in panel (A).
- Percentage of cells ± SEM showing local Ca2+ responses at the indicated time following challenge with the ipgD/IpgD (WT) or ipgD/IpgD C438S (C438S) strain. Results are representative of four independent experiments and at least 60 cells for each determination.
- Percentage of cells ± SEM showing RATPs. Results are representative of four independent experiments and at least 60 cells for each determination. Wilcoxon test, *P < 0.05.
- Percentage of cells ± SEM of cells showing local Ca2+ responses, RATPs, and global Ca2+ responses following 5 min of bacterial challenge. Cells challenged with the ipgD mutant complemented with WT IpgD (black bars) or IpgD C438S (gray bars). Results are representative of four independent experiments and at least 60 cells for each determination. Wilcoxon test, *P < 0.05.
- Percentage of Ca2+ responding cells ± SEM following bacterial challenge at the indicated histamine concentration. Cells challenged with the ipgD mutant complemented with WT IpgD (black bars) or IpgD C438S (gray bars). Results are representative of at least 20 cells in four independent experiments for each determination. Wilcoxon test, *P < 0.05.
Together, these results indicate that IpgD down‐regulates the recruitment of IP3Rs and InsP3 levels during Shigella invasion.
IpgD shapes Ca2+ responses during Shigella invasion
Shigella induces sustained atypical local Ca2+ responses that are associated with bacterial invasion (Tran Van Nhieu et al, 2013). Since these responses depend on InsP3‐mediated Ca2+ signaling, we investigated the role of IpgD in Ca2+ signals during Shigella invasion. For this, cells were loaded with the Ca2+ fluorescent indicator Fluo‐4, challenged with bacteria, and subjected to high‐speed fluorescent microscopy analysis to detect local Ca2+ transients.
As shown in Fig 2A and as observed previously, local Ca2+ responses with atypically long duration (RATPs) and associated with bacterial invasion sites could be detected in cells infected with the Shigella wild‐type strain (Fig 2A, WT). Upon cell invasion, the ipgD mutant elicited local responses at a similar frequency, but significantly less RATPs than WT Shigella (Fig 2B). Instead, the ipgD mutant induced fast spiking and oscillating local Ca2+ responses reminiscent of repetitive puffs that were seldom observed with WT Shigella (Fig 2A, middle panels). Strikingly, the ipgD mutant elicited more global Ca2+ responses than WT Shigella, with 40.3 ± 7.5 (SEM) % and 11.3 ± 4.4 (SEM) % of cells showing global responses in the case of the ipgD mutant and WT after 15 min, respectively (Fig 2B). Consistent with InsP3‐mediated Ca2+ release, cell treatment with the PLC inhibitor U73122 virtually abolished local and global Ca2+ responses induced by wild‐type Shigella and the ipgD mutant (Fig EV2). Catalytically inactive IpgD C438S did not complement the ipgD mutant, indicating that the IpgD phosphatase activity was required for the confinement of Ca2+ responses at invasion sites (Fig EV3). Of note, because of the higher MOI required to perform Ca2+ imaging with these complemented strains, higher percentages of Ca2+‐responsive cells were observed during bacterial challenge at 5 min post‐infection (Fig EV3). At these early time points of infection, however, the ipgD/IpgD C438S strain induced more responses than the ipgD/IpgD complemented strain, consistent with the catalytic activity of IpgD in the down‐regulation and confinement of Ca2+ responses at invasion sites.
Figure 2. IpgD shapes local and global Ca2+ responses during Shigella invasion.
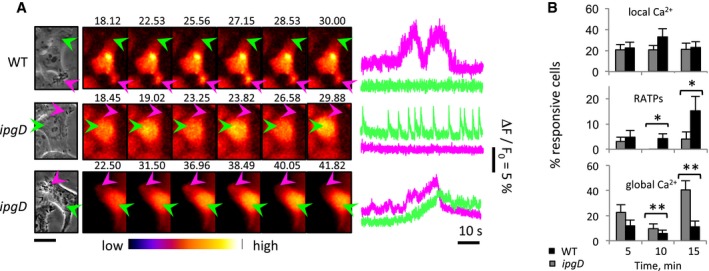
- HeLa cells were loaded with Fluo‐4‐AM and challenged with the indicated bacterial strains. Left: Phase‐contrast images. Center: Time series of Fluo‐4 fluorescence of the corresponding fields depicted with the indicated color code. The elapsed time from the start of acquisition is indicated in seconds. Arrowheads: invasion foci (purple); control area (green). Scale bar = 5 μm. Right: Traces of Ca2+ variations in area pointed to by the arrow with the corresponding color in left panels. From top to bottom, these traces are representative of local RATPs, local fast spiking, and global responses.
- Percentage of cells ± SEM showing local responses, RATPs, or global Ca2+ responses induced by the ipgD mutant (gray bars) or WT Shigella (black bars). N = 4, > 60 cells for each determination. Wilcoxon test, *P < 0.05; **P < 0.01.
Figure EV2. Ca2+ responses induced by WT Shigella and the ipgD mutant are abolished by cell treatment with the PLC inhibitor U73122.
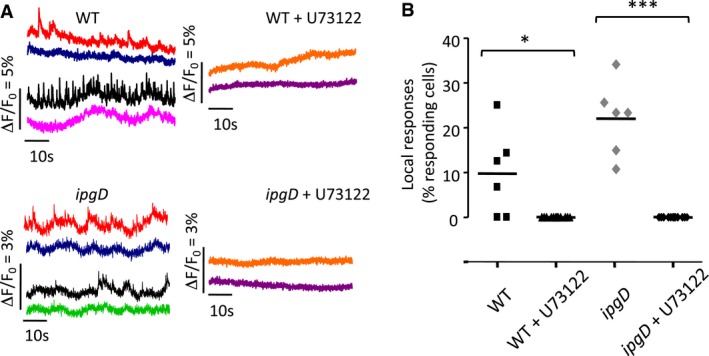
- HeLa cells were loaded with Fluo‐4‐AM and challenged with the indicated bacterial strains for 15 min at 37°C. When indicated, cells were treated with 2 μM U73122 30 min prior to imaging. Traces in red and blue, black and green, or black and pink correspond to Ca2+ variations in different area of the same cell. Traces and orange and purple represent Ca2+ variations in different area of different cells.
- Dot plot representing the % of cells showing local Ca2+ responses upon challenge with the indicated strains in the presence or absence of U73122 in independent experiments (N = 7, > 200 cells for each sample). Unpaired t‐test, *P = 0.027; ***P ≤ 0.001.
These results indicated that IpgD, through its PI(4,5)P2 phosphatase activity, is involved in the confinement of Ca2+ responses at Shigella invasion sites. In the absence of IpgD, Shigella triggered less local and more global Ca2+ transients during cell invasion.
Invasion foci induced by the ipgD mutant are less restrictive in diffusion than WT foci
In addition to its effects on InsP3 production, IpgD has been reported to favor the polymerization of actin at Shigella entry sites by disconnecting cortical actin from the plasma membrane or alternatively, through PI(5)P synthesis and activation of Tiam‐1, a guanine exchange factor (GEF) for the Cdc42 and Rac GTPases (Niebuhr et al, 2002). We also reported that InsP3‐mediated signaling contributes to actin polymerization at Shigella invasion sites (Tran Van Nhieu et al, 2013), suggesting that through the regulation of InsP3 levels and confinement of Ca2+ signals reported in this study, IpgD may also affect actin dynamics. Since actin polymerization may in turn restrict diffusion, IpgD could therefore control Ca2+ signals by dampening InsP3 synthesis at its point source, as well as its diffusion at invasion sites.
We thus wanted to clarify whether differences in actin polymerization sites could affect the diffusion parameters in foci induced by the ipgD mutant compared to wild‐type Shigella.
Consistent with the reported effects of IpgD on actin polymerization (Niebuhr et al, 2002), actin foci induced by the ipgD mutant were smaller in size and were less dense compared to foci induced by WT (Fig 3A–C). In previous works, the restriction of diffusion due to actin polymerization at entry sites was shown to determine the atypical long‐lasting local Ca2+ responses during Shigella invasion (Tran Van Nhieu et al, 2013). To test the diffusion properties in actin foci induced by the ipgD mutant, we performed fluorescence recovery after photobleaching (FRAP) experiments on cells loaded with the freely diffusible fluorescent dye calcein and infected with bacteria (Materials and Methods). As shown in Fig 3D and E and as previously observed, actin foci induced by WT Shigella showed calcein fluorescence recovery kinetics that were consistent with restricted diffusion, with a half‐maximal recovery time (T1/2) of 347 ± 25 (SEM) ms, compared to 222 ± 14 (SEM) ms for free diffusion in control area (Tran Van Nhieu et al, 2013). Consistent with the lesser density of polymerized actin in foci induced by the ipgD mutant, however, the determined average T1/2 corresponded to 287 ± 22 (SEM) ms, which indicates that diffusion was not as restricted as that observed in WT‐induced foci.
Figure 3. Invasion foci induced by the ipgD mutant are less restrictive in diffusion than foci induced by WT Shigella .
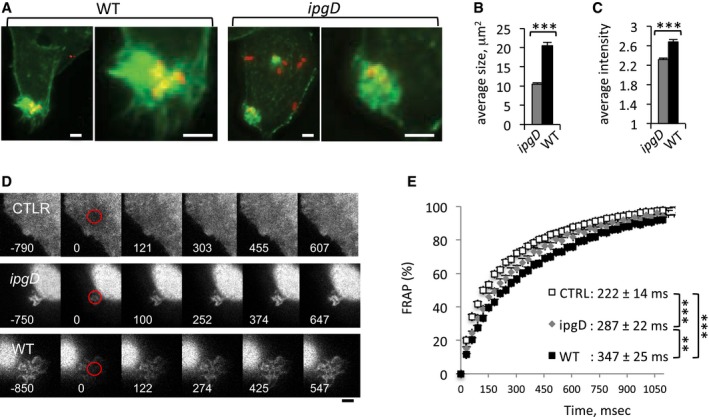
- Representative fluorescent confocal micrographs of cells challenged with the indicated bacterial strains for 15 min at 37°C and processed for fluorescence staining of F‐actin (green) and bacteria (red). Right: Larger magnification of the insets depicted in the left panels. Scale bar, 5 μm.
- The average size of invasion foci stained with fluorescent phalloidin ± SEM is indicated for each bacterial strain (N = 3; n > 35). Wilcoxon test, ***P < 0.001.
- The relative fluorescence intensity of invasion foci stained with fluorescent phalloidin ± SEM is indicated for each bacterial strain (N = 3; n > 35). Unpaired t‐test, ***P < 0.001.
- Representative time‐lapse images of cells loaded with calcein, challenged with the indicated bacteria, and subjected to FRAP analysis. Red: bleached area. The time after bleach is indicated in ms. Scale bar = 5 μm.
- Fluorescence recovery kinetics in % in control area (empty squares), foci induced by wild‐type Shigella (solid squares) or ipgD mutant (gray diamonds). The traces represent the average of more than 27 determinations in three independent experiments. The estimated half‐maximal recovery times (T1/2) ± SEM are indicated. Unpaired t‐test, WT vs. ipgD: **P = 0.0076; WT vs control or ipgD vs control: ***P < 0.0001.
Thus, foci induced by the ipgD mutant show a restriction of diffusion, which, while less pronounced than that observed for wild‐type Shigella, may restrict the extent of InsP3 propagation and impact on bacterial‐induced Ca2+ signals.
Modeling points to a critical role for IpgD in regulating Shigella‐induced local and global Ca2+ responses
Using computational modeling, we previously showed that restricted diffusion and increased InsP3 synthesis at invasion sites accounted for local and long‐lasting Ca2+ responses (RATPs) observed during invasion of WT Shigella (Tran Van Nhieu et al, 2013). We then used the model to investigate the respective roles of restricted diffusion and InsP3 levels in IpgD‐mediated confinement of Ca2+ responses during Shigella invasion (Materials and Methods). Typical local RATPs and global Ca2+ responses obtained by simulation of the model are shown in Fig 4A and B. In agreement with experimental observations, when scoring responding cells, the ipgD mutant showed more global and less local Ca2+ responses than WT Shigella, with 80% of global and 20% of local responses for the ipgD mutant, and 60% of global and 40% of local responses for WT Shigella (Fig 4C). According to the model, the diffusivity characteristics and the rate of InsP3 synthesis determined for the ipgD mutant were both important in defining the local versus global character of the Ca2+ response. By decreasing the rate of InsP3 synthesis, IpgD limited the propagation of this messenger in the bulk of the cytoplasm. Indeed, if only taking into account an increased rate of InsP3 synthesis, the proportion of global responses increased to 68% (Fig 4C, middle panel). The higher diffusivity accounted for the higher percentage (80%) of global responses in the ipgD mutant. When modeled during prolonged kinetics of bacterial infection, the rates of InsP3 synthesis at invasion sites were larger for the ipgD mutant, with JIP = 4.5 μM/s compared to 2.5 μM/s for WT, in agreement with the experimental determinations of levels of InsP3 in Fig 1. The model reproduced the occurrence of irregular and small‐amplitude Ca2+ increases during infection by WT Shigella and predicted regular and spiky Ca2+ oscillations for the ipgD mutant (Fig 4D). The shift in the pattern of Ca2+ dynamics observed in the ipgD mutant was due to larger InsP3 concentrations, favoring high‐amplitude and regular Ca2+ responses (Dupont et al, 2008; Thurley et al, 2014).
Figure 4. Modeling of the effects of IpgD on Shigella‐induced Ca2+ responses.
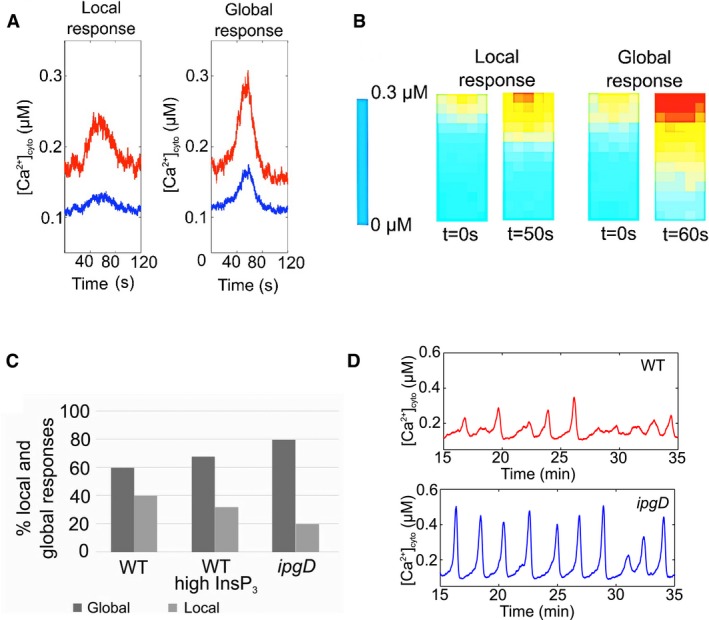
- Spatial profiles of Ca2+ concentrations corresponding to simulations shown in panel (A). The geometry of the system is depicted in Appendix Fig S7.
- Percentages of local (gray bars) and global (solid bars) Ca2+ responses in cells challenged with WT Shigella, WT with InsP3 levels estimated for the ipgD mutant (WT with high InsP3), and ipgD mutant.
- Prediction of Ca2+ responses induced by WT Shigella or by the ipgD mutant over prolonged infection kinetics. Parameter values are those listed in Table EV1, except for JIP = 2.5 μM/s and 4.5 μM/s for the WT and the ipgD mutant, respectively.
IpgD inhibits Ca2+ signals during prolonged infection kinetics
When experimentally investigated, WT Shigella induced atypical isolated Ca2+ responses during the first 30 min of infection, but a drastic decrease in amplitude and frequency of these responses was observed during further incubation (Fig 5A). In contrast and consistent with the model, cells infected with the ipgD mutant showed responses with sharp increases and oscillations reminiscent of Ca2+ responses to agonists, which were still elicited after 30 min of bacterial infection (Fig 5A). After bacterial incubation for 90 min, cells infected with WT Shigella showed a clear inhibition in the elicitation of Ca2+ responses to agonist compared to cells infected with the ipgD mutant (Fig 5B), with 40.4 ± 1.6 (SEM) % compared to 59.1 ± 7.4 (SEM) % of cells responding to 0.5 μM histamine, respectively (N = 3, n > 45 cells). Furthermore, at this histamine concentration, WT Shigella‐infected cells showed Ca2+ responses with an average amplitude of 13.9 ± 3.8 (SEM) % of the maximal response, compared to 46 ± 8.4 (SEM) % for cells infected with the ipgD mutant (N = 3, n > 45 cells; Fig 5C). As expected, the ipgD complemented with catalytically active IpgD was less responsive to histamine stimulation than the ipgD/IpgD C438S strain (Fig EV3F).
Figure 5. IpgD shapes global Ca2+ responses and inhibits InsP3‐mediated signaling during prolonged infection kinetics.
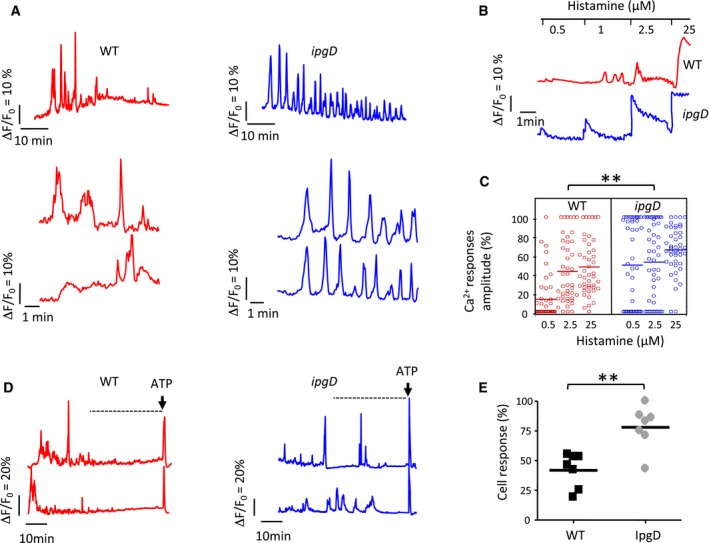
- Representative traces of single cell global Ca2+ responses are shown for challenge with the indicated strains.
- Representative traces of infected HeLa cells stimulated with histamine at the indicated concentrations at 90 min post‐infection.
- Amplitude of Ca2+ responses relative to the maximal response upon stimulation at the indicated histamine concentrations of cells infected with the indicated bacteria for 90 min. Wilcoxon test, **P < 0.01.
- Representative traces of global Ca2+ responses are shown for polarized TC7 cells. The arrow indicates stimulation with 30 μM ATP.
- Dot plot representing the % of polarized TC7 cells challenged with the indicated bacterial strain, showing global Ca2+ responses during a 30‐min period, 30 min following infection, and prior to ATP stimulation (dotted line in panel D) (N = 7, > 200 cells). Wilcoxon test: **P = 0.007.
To determine whether IpgD was sufficient to account for the inhibition of Ca2+ signaling, cells were transfected with a GFP‐IpgD construct, and their ability to respond to agonists stimulating InsP3‐dependent Ca2+ responses was analyzed. As shown in Fig EV4, GFP‐IpgD‐transfected cells were unresponsive to 0.2 μM histamine or 1 μM ATP, as opposed to cells transfected with catalytically inactive GFP‐IpgDC438S. Furthermore, GFP‐IpgD transfectants showed more than a fivefold decrease in the percentage of responding cells when stimulated at 2 μM histamine or 5 μM ATP compared to control cells (Fig EV4).
Figure EV4. GFP‐IpgD‐expressing cells show decreased responses to Ca2+ agonists.
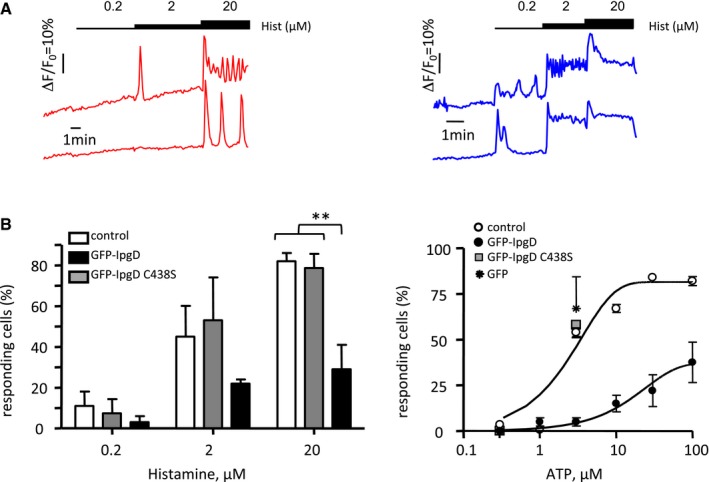
- Representative traces of cells transfected with GFP‐IpgD (red traces) or catalytically inactive GFP‐IpgDC438S (blue traces), loaded with Fura‐2‐AM, and stimulated with the indicated concentrations of histamine. Changes in the ratio of Fura‐2 fluorescence intensity (∆R) were calculated relative to the resting ratio value (R 0) as ∆R/R 0.
- The percentage of cells responding to the indicated agonist concentration was scored and expressed as an average ± SEM. The values are representative of 3–15 determinations in three independent experiments. Cells were transfected with the indicated constructs. Control: non‐transfected cells. Unpaired t‐test, **P = 0.0081.
When analyzed during Shigella invasion of polarized TC7 cells, Ca2+ responses were reminiscent of those observed in HeLa cells, with isolated responses of various amplitudes. However, pseudo‐oscillatory responses were not detected even upon challenge with the ipgD mutant strain (Fig 5D). These results are in line with a poorer efficiency of Shigella invasion in these cells compared to non‐polarized cells (Mounier et al, 1992; Romero et al, 2011). Strikingly, however, as opposed to cells challenged with the ipgD mutant, cells challenged with wild‐type Shigella showed a sharp decrease in the occurrence of Ca2+ responses during the incubation period, with very few responses elicited after 30 min of bacterial challenge (Fig 5D). When quantified during this period, the percentage of cells showing responses was significantly different between these samples, with 42 ± 6 compared to 78 ± 7 (SEM) % of responsive cells for challenge with wild‐type Shigella and the ipgD mutant, respectively.
Together, these results indicate that IpgD down‐regulates InsP3‐dependent Ca2+ responses during Shigella infection.
IpgD delays Ca2+‐dependent focal adhesion disappearance
Ca2+ is implicated in the majority of fundamental cell processes, including actin cytoskeletal reorganization or cell death induced during Shigella invasion of epithelial cells (Berridge et al, 2000; Carneiro et al, 2009; Bergounioux et al, 2012). IpgD‐mediated effects on Ca2+ signals are likely prominent early during infection, because InsP3 levels were undetectable 2 h post‐infection (Fig 1) and since at prolonged infection kinetics, plasma membrane permeabilization leads to Ca2+ overload (Carneiro et al, 2009; Tattoli et al, 2012). Consistently, Ca2+‐dependent degradation of caspases 3 and 9 could be detected at 4 and 6 h post‐infection, but only minor differences could be observed between cells challenged with Shigella WT or ipgD mutant strains (Appendix Fig S3). Also, as reported, IpgD stimulated the PI3K/Akt pathway and phosphorylation of the pro‐apoptotic protein BAD (Pendaries et al, 2006; Ramel et al, 2011), but little difference was observed when cells were challenged in the absence of Ca2+ (Appendix Fig S3).
Remarkably, however, at 2 h post‐infection, the ipgD mutant was 2.8‐fold more cytotoxic compared to WT Shigella (Fig 6A), an effect that was not observed in the absence of extracellular Ca2+ (Fig 6B). As expected from the InsP3 kinetics, this difference in cytotoxicity did not evolve during further bacterial incubation (Fig 6A). The “hyper‐cytotoxicity” associated with the ipgD mutant was accompanied by a Ca2+‐dependent cell retraction, suggesting that it resulted from cell detachment (Fig EV5A and B). We thus tested the effects of IpgD on cell adhesion structures. As shown in Fig 6C, cells infected with WT Shigella showed pronounced peripheral and radially oriented talin‐containing focal adhesions (FAs), similar to uninfected cells or cells infected with the T3SS‐deficient mxiD strain (Figs 6C and EV5). In contrast, cells infected with the ipgD mutant showed fewer FAs as early as an hour post‐infection, with an average number of 13.2 ± 2.0 (SEM) FAs/cell compared to 21.4 ± 1.2 (SEM) FAs/cell for WT‐infected cells, in association with a decrease in the cell adhesion surface (Fig 6D and E). In addition, the percentage of cells showing FA disappearance was lower in cells infected with WT Shigella compared to ipgD mutant with kinetics that inversely mirrored that of cells showing large FAs (Fig EV5C) and paralleled that observed for cytotoxicity (Fig 6A). Quantification of anti‐LPS immunofluorescence as a proxy indicated that the decrease in FAs was not due to a difference in bacterial load (Fig EV5E).
Figure 6. IpgD prevents Ca2+‐dependent early cytotoxicity linked to cell detachment induced by Shigella .
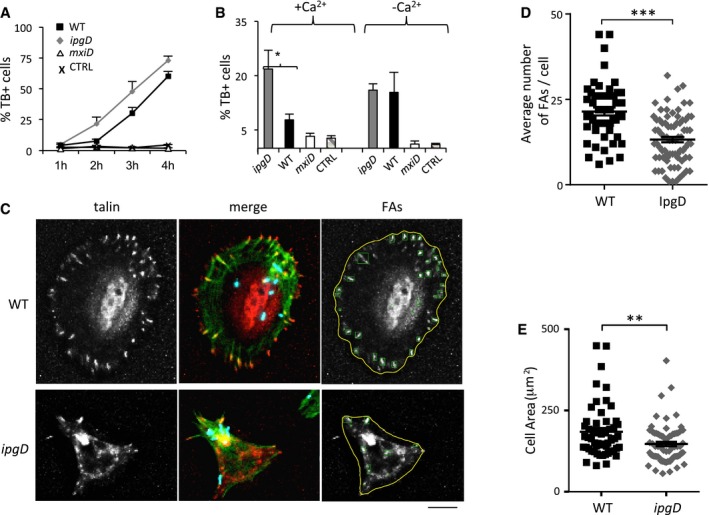
- Cells were challenged with wild‐type Shigella (black squares) or the ipgD mutant (gray diamonds) for the indicated time points, and non‐viable cells were scored by trypan blue staining. Representative experiments performed with triplicate determinations, n > 1,000 cells per point. The results are expressed as the average percentage of trypan blue‐positive cells ± SEM.
- Average percentage of trypan blue‐positive cells ± SEM following bacterial challenge with the indicated strains for 2 h in the absence (−Ca2+) of presence of extracellular Ca2+ (+Ca2+). CTRL: non‐infected cells. N = 3, > 30 cells. Unpaired t‐test, *P = 0.0283.
- Talin‐GFP‐transfected cells were challenged with the indicated Shigella strains for 1 h and processed for immunofluorescence staining. Talin: representative projection of deconvolved epifluorescence microscopy planes showing cells challenged with the indicated Shigella strains. Merge: actin: red, talin: green; bacteria: blue. FAs: detection of FAs performed using an automated algorithm (Materials and Methods). Scale bar, 5 μm.
- The average number of FAs/cell ± SEM was determined for cells infected with the indicated bacteria as in (C). N = 3, > 30 cells. Unpaired t‐test, ***P ≤ 0.001
- The average cell area ± SEM was determined for cells infected with the indicated bacteria as in (C). N = 3, > 30 cells. Wilcoxon test, **P = 0.0031.
Figure EV5. The ipgD mutant induces cell retraction and detachment.
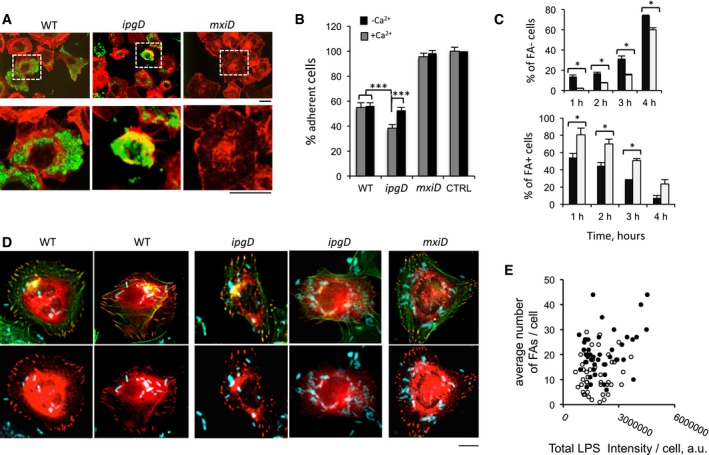
- Representative micrographs of cells challenged for 6 h with the indicated bacterial strains and processed for immunofluorescence staining. F‐actin: red; bacteria: green. Scale bar, 5 μm.
- The number of remaining adherent cells was scored (Materials and Methods) and expressed as average percentage ± SEM relative to control non‐infected cells. Challenge in RPMI medium (gray bars) or in RPMI containing 2 mM EGTA (black bars). The values are representative of at least 200 cells scored in 4 independent experiments. t‐test, ***P < 0.001.
- Cells were transfected with GFP‐talin prior to bacterial challenge. The average percentage ± SEM of cells devoid of FAs (FAs−) or showing prominent FAs (FAs+) is shown for the indicated bacterial strain and infection time. Wilcoxon test, *P < 0.05. Each determination was performed on at least 200 cells in three independent experiments.
- Representative micrographs of cells challenged for 1 h with the indicated bacterial strains and processed for immunofluorescence staining. GFP‐talin: red; actin: green; bacteria: cyan. Scale bar, 5 μm.
- The number of automatically detected focal adhesions per cell is plotted against the bacterial load using LPS‐fluorescence intensity. Cells challenged with WT (solid circles) and ipgD mutant (empty circles). No correlation is observed between the bacterial load and the average number of FAs per cell.
In polarized TC7 cells, bacteria were detected apically following a 90‐min incubation period, several microns above the cell basal side where FAs were detected (Appendix Fig S4A). A reduction in FAs was observed for cells infected with wild‐type Shigella compared to control non‐infected cells (Appendix Fig S4). As observed for HeLa cells, however, the decrease in FAs was significantly more pronounced in cells challenged with the ipgD mutant, or the ipgD mutant complemented with catalytically inactive IpgD C438S relative to wild‐type Shigella (Appendix Fig S4B). As expected, complementation of the ipgD mutant with wild‐type IpgD led to a less severe reduction in FAs (Appendix Fig S4B).
Together, these results indicate that IpgD delays FA disassembly during Shigella infection of epithelial cells.
IpgD regulates the Ca2+‐dependent activation of calpain and talin cleavage
The physiological disassembly of focal adhesions is triggered by cleavage of talin by the Ca2+‐dependent protease calpain and depends on InsP3‐mediated Ca2+ oscillations (Franco et al, 2004; Sorimachi & Ono, 2012). As previously described, cell infection with WT Shigella led to calpain activation that was detected starting from 3 h post‐infection as assessed by the autoproteolytic cleavage of the small regulatory subunit Capn4 (Fig 7A and B) (Bergounioux & Arbibe, 2012; Sorimachi et al, 2012). Consistent with the kinetics of talin cleavage and as opposed to WT Shigella, the ipgD mutant induced calpain activation at the onset of bacterial challenge (Fig 7A and B). As expected, calpain activation depended on the presence of Ca2+ and was not observed with the mxiD mutant (Fig 7A and B, and Appendix Fig S5). Cell treatment with the calpain inhibitor ALLN prevented the degradation of talin induced by WT Shigella or the ipgD mutant strain, indicating the key role of calpain in the disassembly of focal adhesions (Fig 7C and D, and Appendix Fig S6).
Figure 7. IpgD delays Ca2+‐dependent calpain activation and talin cleavage during Shigella invasion.
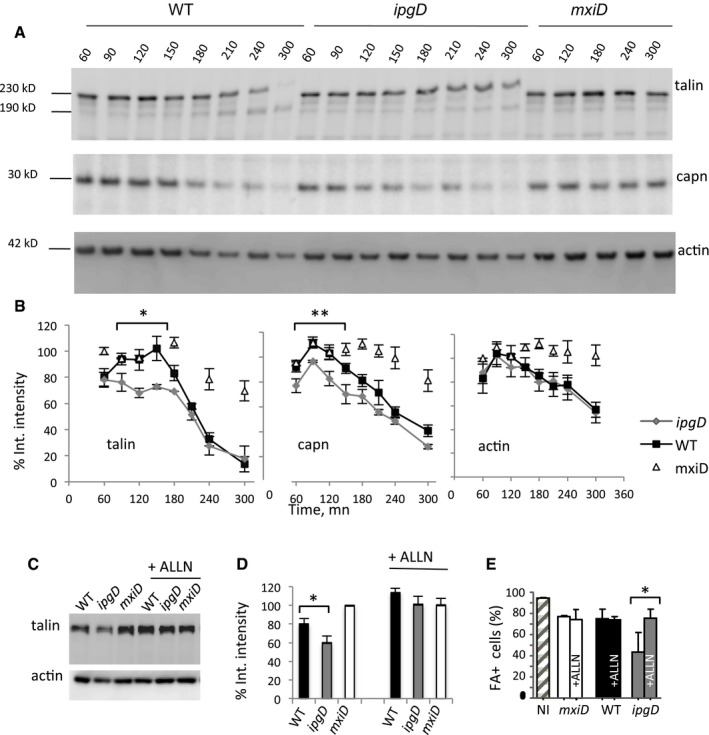
- Cells were infected with bacterial strains for the time indicated in minutes. Infected‐cell lysates were analyzed by Western blotting using antibodies directed against the indicated proteins. A representative experiment is shown. Migration of the molecular weight markers is indicated.
- The average integrated intensity of bands ± SEM corresponding to the indicated proteins was determined from at least three independent experiments and expressed as a percentage of that determined for control cells challenged with the non‐invasive mxiD mutant. Cells were infected for the indicated incubation time with wild‐type Shigella (black squares), the ipgD mutant (gray diamonds), or the mxiD mutant (empty triangles) strains. Statistical tests performed for values between 90 and 180 min. ANCOVA test, *P = 0.01122. **P = 0.008.
- Cells were pre‐treated with the calpain inhibitor ALLN at a final concentration of 10 μM for 1 h and challenged with bacteria for 1 h. Cell lysates were analyzed by anti‐talin or anti‐actin Western blotting. A representative experiment is shown.
- The average integrated intensity ± SEM of the talin band was determined in independent experiments for the indicated bacterial strain. N = 3, Wilcoxon test, *P < 0.05.
- The relative percentage of cells challenged with the indicated strains and presenting large FAs ± SEM is shown. n > 30 cells, N = 2. Wilcoxon test, *P < 0.05.
Source data are available online for this figure.
These results indicate that IpgD delays the Ca2+‐dependent activation of calpain, talin cleavage, and focal adhesion disassembly, during cell infection by Shigella.
Discussion
In this report, we provide evidence for a key role of IpgD in regulating local and global Ca2+ signals during Shigella infection of epithelial cells. We show that IpgD plays a major role in the confinement of Ca2+ responses at invasion sites. In its absence, Shigella induces sharp and oscillating global Ca2+ responses, due to higher InsP3 levels during bacterial invasion. Through modeling studies, we provide a mechanistic explanation for the IpgD‐mediated confinement of Ca2+ responses at invasion sites, based on the observed increased InsP3 levels and higher diffusion rates. Because of the non‐linear relationship between InsP3 and Ca2+, modest variations in InsP3 concentration can indeed induce drastic differences in Ca2+ release from the ER at invasion sites (Dupont et al, 2011; Tran Van Nhieu et al, 2013). This effect is further amplified by the increased recruitment of InsP3 receptors observed at invasion sites induced by the ipgD mutant. How precisely IpgD regulates InsP3 receptors recruitment is not clear and probably pertains to the general and long‐standing debate over InsP3 receptor clustering upon agonist stimulation. The observation that increased InsP3 receptor recruitment at Shigella invasion sites correlates with higher InsP3 levels induced by the ipgD mutant is in line with works showing oligomerization of InsP3 receptors upon InsP3 binding (Tateishi et al, 2005; Taufiq Ur et al, 2009). According to this view, increased InsP3 levels would favor the oligomerization and entrapping of InsP3 receptors by diffusion–capture in a process likely favored by the meshwork of polymerized actin at Shigella invasion sites (Tran Van Nhieu et al, 2013).
Considering the differential patterns of Ca2+ responses between WT Shigella and the ipgD mutant, the occurrence and duration of responses are likely the predominant parameters accounting for the IpgD‐mediated regulation of calpain activity during the early stages of infection. According to this view, IpgD prevents calpain activation during cell infection by limiting the number and duration of responses during the early stages of bacterial infection. Cell death comes as an ineluctable fate associated with Shigella intracellular replication and the permeabilization of the plasma membranes. Shigella, however, expresses various type III effectors to delay cell death or detachment. OspC3 prevents rapid apoptotic death (Kobayashi et al, 2013). Interestingly, apoptotic death induced by the ospC3 mutant is not accompanied by the usually observed loss of cell adhesion (Kobayashi et al, 2013). By targeting ILK (integrin‐linked kinase), OspE was shown to reinforce adhesions (Kim et al, 2009). We show here that IpgD contributes to delay such cell detachment by preventing the Ca2+‐dependent calpain activation and cleavage of talin (Fig 8). The VirA type III effector was proposed to induce early calpain activation through calpastatin degradation in a Ca2+‐dependent manner during Shigella invasion (Bergounioux & Arbibe, 2012). We show here that by preventing InsP3‐mediated Ca2+ release, IpgD inhibits the early activation of calpain, but does not prevent the Ca2+‐dependent activation of calpain at late stages of infection. Thus, through its effects on Ca2+ signaling, IpgD regulates the function of various type III effectors during Shigella invasion of epithelial cells.
Figure 8. Model for IpgD‐mediated regulation of Ca2+ signals and FA disassembly during Shigella invasion of epithelial cells.
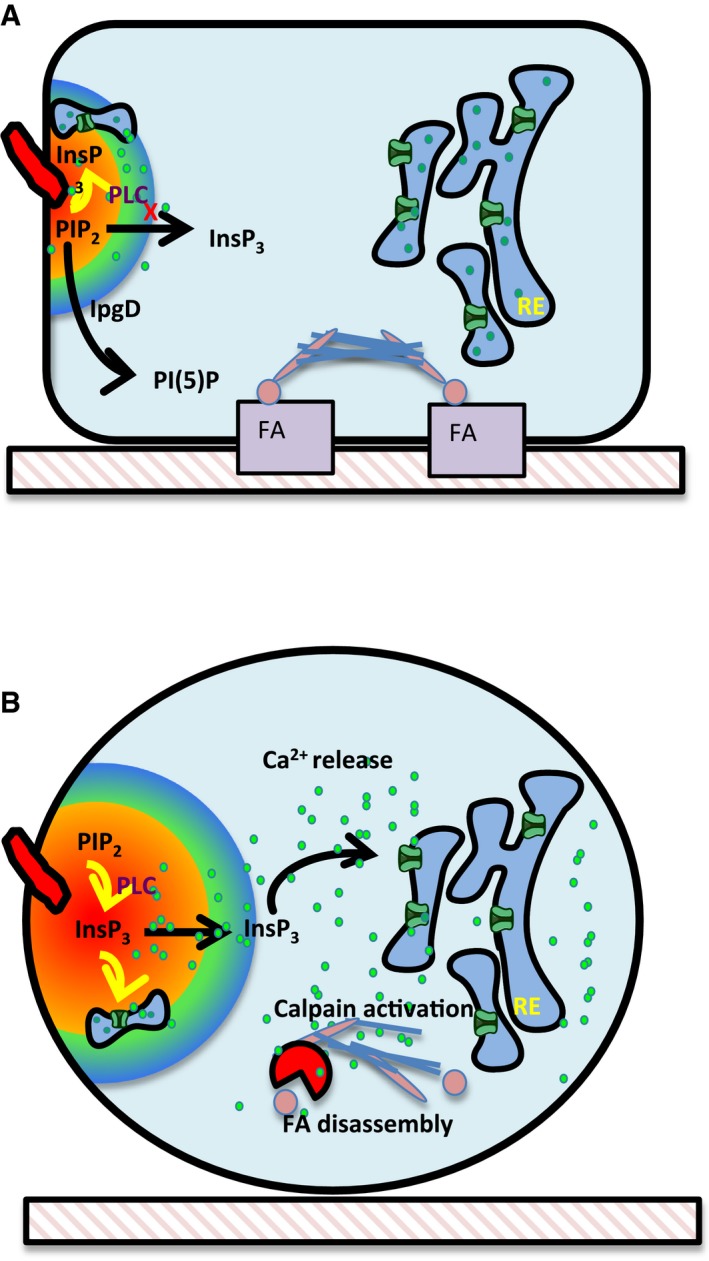
- IpgD hydrolyzes PI(4,5)P2 thereby limiting the substrate pool available to PLCs at bacterial invasion sites. This results in a decrease in InsP3 production which, combined with restricted diffusion, favors long‐lasting local Ca2+ responses at Shigella‐induced actin foci.
- In the absence of IpgD, bacterial‐induced actin foci are less restrictive in diffusion, and increased InsP3 levels stimulate Ca2+ release. Increased cytosolic Ca2+ activates the calpain‐dependent cleavage of talin and focal adhesion disassembly.
Because of the versatility of Ca2+ signaling, the effects of IpgD on the regulation of Ca2+ signals are likely to impact various processes during Shigella infection. Ca2+ regulates the activity of kinases and phosphatases, and their relative catalytic on/off constants for Ca2+ are generally recognized as main components of the decoding of Ca2+ signals (Smedler & Uhlen, 2014). Specifically, the persistent duration of RATPs induced by WT Shigella will be decoded differently than the repeated Ca2+ spikes induced in the absence of IpgD. Such differential Ca2+ decoding could impact on the reported IpgD functions in impairment of lymphocyte migration or recruitment of exocytic vesicles during vacuolar rupture following Shigella invasion (Konradt et al, 2011; Mellouk et al, 2014).
Materials and Methods
Bacterial strains, cell line, and reagents
The invasive Shigella flexneri 5a wild‐type stain (M90T), the non‐invasive mxiD mutant, and the ipgD mutant expressing the AfaE afimbrial adhesin of uropathogenic E. coli were described previously (Tran Van Nhieu et al, 2003). Bacteria were grown at 37°C in trypticase soy broth. HeLa cells were from ATCC and grown in RPMI + Glutamax medium (RPMI1640; GIBCO, Invitrogen) supplemented with 5% fetal calf serum (FCS) and grown at 37°C with 5% CO2. Caco‐2/TC7 cells were described previously (Chantret et al, 1994) and were grown in DMEM + Glutamax medium (Dulbecco's modified Eagle's medium; GIBCO, Invitrogen) containing 4.5 g/l glucose, supplemented with 10% FCS and non‐essential amino acids. The rabbit polyclonal antibody against the type1 InsP3 receptor was from ABR Affinity BioReagents. The monoclonal antibody against the type 3 InsP3 receptor was from Thermo Fisher. The anti‐Shigella LPS FlexV polyclonal antibody was described previously (Mounier et al, 2009). The mouse monoclonal anti‐capn4 antibody and anti‐talin clone 8D4 antibodies were from Biovision and Sigma Corporation, respectively. The phalloidin‐A488, phalloidin‐A633, and anti‐rabbit IgG‐Alexa547 were from Thermo Fisher Scientific. The fluorescent probes calcein‐AM and Fluo‐4‐AM were from Invitrogen. The PLC inhibitor U73122 and the calpain inhibitor ALLN were from Sigma Corporation. [3H] myo‐inositol (15.0 Ci/mmol) was from Amersham. [3H] Ins(1,4,5)P3 (21.4 Ci/mmol), [3H] Ins(1,3,4,5)P4 (21.0 Ci/mmol), and [3H] IP6 (21.4 Ci/mmol) used as standards to calibrate the HPLC SAX column were from Perkin‐Elmer.
Plasmid constructions
The plasmid constructs expressing the GFP‐PH‐PLCδ1 and GFP‐talin were described previously (Franco et al, 2004; Balla & Varnai, 2009).
Bacterial infection
For immunofluorescence staining experiments, HeLa cells were plated the day before onto coverslips in 6‐well plates at a density of 1 × 10⁵ cells/well. When mentioned, cells were transfected using the JetPei TM reagent (Polyplus) according to the manufacturer's instructions. TC7 cells were plated onto coverslips in 6‐well plates at a density of 4 × 10⁵ cells/well and allowed to polarize for 7 days, with a daily change of medium upon cell confluency. Bacterial strains grown to exponential phase were resuspended in RPMI1640 medium or DMEM for challenge of HeLa cells and TC7 cells, respectively, supplemented with 50 mM HEPES pH 7.5. Cells were challenged with bacteria at a MOI of 40 and 80, for challenge of HeLa cells and TC7 cells, respectively, for 15 min at 21°C prior to incubation at 37°C for the indicated period. At the indicated time points, cells were washed three times, fixed with 3.7% paraformaldehyde (PFA) for 20 min at 21°C, and with ethanol:acetone 1:1 for 5 min at 21°C, and processed for immunofluorescence staining of InsP3R1 and InsP3R3 or talin, respectively.
Inositol‐polyphosphate measurements
HeLa cells were labeled with 100 μCi/ml [3H] myo‐inositol for 3 days, and the levels of inositol‐polyphosphates were measured as described previously (Leyman et al, 2007).
Immunofluorescence microscopy analysis
After fixation with PFA, cells were permeabilized with 0.1% Triton X‐100 for 4 min. Samples were washed three times with PBS and blocked with PBS containing 5% FCS for 20 min. Cells were incubated for 1 h with primary antibodies at the following dilution: rabbit polyclonal anti‐type 1 InsP3 receptor antibody (1:2,000), mouse monoclonal anti‐type 3 InsP3 receptor antibody (1:200), mouse monoclonal anti‐talin (1:300), and rabbit polyclonal anti‐FlexV LPS antibody (1:5,000); and incubated with the corresponding secondary anti‐rabbit IgG or anti‐mouse IgG antibodies, or Alexa‐conjugated phalloidin at a dilution of 1:200. Samples were mounted in Dako mounting medium (DAKO) and analyzed using an Eclipse Ti microscope (Nikon) equipped with a 100× objective, a CSU‐X1 spinning disk confocal head (Yokogawa), and a Coolsnap HQ2 camera (Roper Scientific Instruments), controlled by the Metamorph 7.7 software. Analysis by epifluorescence microscopy was performed using a DMRIBe microscope (LEICA Microsystems) using 380‐nm, 470‐nm, or 546‐nm LED source excitation, equipped with a Cascade 512 camera (Roper Scientific) driven by the Metamorph (7.7) software. Images were analyzed using the Metamorph software.
Image analysis
For the quantification of PI(4,5)P2 enrichment fold, the average fluorescence intensity of the PH‐PLCδ1 probe of Shigella invasion foci in transfected cells corrected to background was normalized by the average fluorescence intensity of a control area in the same transfected cell. A similar method was applied to quantify the enrichment fold of InsP3R1 except that samples were subjected to quantitative immunofluorescence staining as described previously (Tran Van Nhieu et al, 2013). For focal adhesion numbers and cell adhesion surface quantification, a semi‐automated protocol was developed using Icy bioimaging software (de Chaumont et al, 2012). Briefly, epifluorescent microscopy planes spaced by 0.2 μm were deconvolved with the Meinel algorithm using the Metamorph (7.7) software and measured PSFs. Large talin‐containing structures were detected using the inbuilt “Wavelet Spot Detector” plugin on the maximum Z‐projections of deconvolved GFP‐talin fluorescent planes. The identified structures were overlaid in a binary mask obtained from thresholded projections of F‐actin labeled images, using the “Moments method”. Focal adhesions were detected as structures positive for talin and actin. Cell area was identified using the inbuilt Active Contours Icy plugin in the GFP‐talin channel.
Calcium imaging
HeLa cells seeded on coverslips were loaded with 3 μM Fluo‐4‐AM in EM buffer containing 120 mM NaCl, 7 mM KCl, 1.8 mM CaCl2, 0.8 mM MgCl2, 5 mM glucose, and 25 mM HEPES (pH = 7.3) for 30 min at 21°C, washed in EM buffer, and further incubated for 20 min. For TC7 cells, pluronate was added during the Fluo‐4‐AM loading procedure at a final concentration of 0.1%. Samples were analyzed at 33°C on an inverted Leica DMRIBe fluorescence microscope, equipped with light‐emitting diode 470‐nm illuminating sources and a 480‐nm band‐pass excitation filter, a 505‐nm dichroic filter, and a 527‐nm band‐pass emission filter driven by the Metamorph software from Roper Scientific Instruments. For analysis of local Ca2+ variations, images were captured using a Cascade 512B EM‐CCD back‐illuminated camera in a stream mode, with an acquisition every 30 ms. Changes in the ratio of Fura‐2 (ΔR) or Fluo‐4 fluorescence intensity (ΔF) were calculated relative to the resting ratio or fluorescence value (R 0 or F 0) as ΔR/R 0 or ΔF/F 0, respectively. Cells showing local Ca2+ responses were scored by high‐speed fluorescence microscopy (HSFM). The average percentage of responsive cells showing a detectable Ca2+ response during the length of the analysis was determined.
FRAP analysis
Cells were cultured on 25‐mm‐diameter coverslips (Marienfeld) and loaded with 3 μM calcein‐AM (3 kDa) in EM buffer for 30 min. Cells were mounted in an observed chamber on a plate of an inverted spinning disk confocal microscopy heated at 37°C (Nikon Eclipse Ti) and analyzed with a 60× objective, using an EM‐CCD camera equipped with a FRAP module and driven by the Metamorph software (Roper Scientific Instruments), allowing to the acquisition of images during the bleaching phase. Samples were infected with ipgD mutant or WT for 10 min; then, Shigella‐induced foci were subjected to FRAP (fluorescence recovery after photobleaching) analysis, essentially as described previously (Tran Van Nhieu et al, 2013). Fluorescence recovery curves corresponding to the normalized intensity in the bleached area were performed; average from several measurements showed good‐quality fit with a single component diffusion (> 30 foci, N = 4).
Modeling of intracellular Ca2+ and InsP3 dynamics during bacterial invasion
As an improvement to our previous model, we took into account the possible effects of molecular noise, because of the random character of Shigella‐induced Ca2+ responses and the well‐established stochastic nature of Ca2+ dynamics. Using the Gillespie's algorithm, we developed a stochastic version of the model used in our previous analysis to investigate the origin of the Ca2+ responses confined at the invasion site during Shigella invasion (Tran Van Nhieu et al, 2013). This model consists in three differential equations describing the evolution of the fraction of inhibited InsP3 receptors (R i), the concentration of cytosolic Ca2+ (C), and the concentration of InsP3 (I):
| (1) |
| (2) |
| (3) |
where represents the fraction of open (active) receptors.
Equations are described in Tran Van Nhieu et al (2013). Parameters are defined in Table EV1, where their values in the simulations are also provided. Initial conditions correspond to the steady‐state situation in the absence of bacterial invasion. A typical HeLa cell is simulated as a two‐dimensional 26 × 10 μm system, in which the Shigella actin focus is defined by its lower diffusivity, higher density of InsP3 receptors, and higher rate of InsP3 synthesis and covers the 6 × 6 μm top central region (Appendix Fig S7). In most simulations, this system is discretized into 13 × 5 mesh points; results were not qualitatively affected when dividing by 2 the size of the grid.
Fluctuations due to molecular noise are taken into account using the Gillespie's algorithm (Gillespie, 1976). This method associates a probability to each kinetic transition considered in the model. At each grid point, diffusion is treated as a kinetic reaction by computing the probability that an InsP3 molecule or a Ca2+ ion will “jump” to a nearest‐neighbor grid point. This probability depends on the deterministic diffusion coefficient and on the difference between the number of molecules at the considered grid point and at each of its neighbor (Kraus et al, 1996). At each time step of the simulation, the algorithm stochastically determines the change that takes place corresponding to a reactive or diffusive step, according to its relative propensity related to the number of molecules involved in the reaction and on the rate constants. The level of molecular noise, which determines the amplitude of the fluctuations around the corresponding deterministic evolution, is scaled by parameter Ω. The higher the Ω, the larger the number of molecules considered in the simulations and the lower the amplitude of the fluctuations. Here, two different Ω are considered, to take into account that the number of InsP3 and Ca2+ molecules/ions is not scaled by the same factor than the number of InsP3 receptors (Dupont et al, 2008). In the simulations presented in Fig 4, Ω1 = 105 for InsP3 and Ca2+, and Ω2 = 6,000 for the InsP3 receptors. The scoring of local and global responses during infection with WT Shigella, the ipgD mutant, or the theoretical scenario of infection with WT Shigella in the presence of the high InsP3 levels observed for the ipgD mutant was performed on at least 25 determinations for each sample. Concentrations shown in ordinate correspond to the number of particles divided by the corresponding Ωi.
Trypan blue exclusion test
To quantify cell death, following bacterial infection, samples' supernatants were recovered and cells were pelleted by centrifugation for 5 min at 800 × g. Following resuspension, these cells were stained with PBS containing 0.4% trypan blue for 5 min. Adherent cells were also trypsinized and subjected to trypan blue staining. Cells were scored using a Malassez chamber using bright‐field microscopy and a 20× objective. The ratio of dead cells was as (S b + A b/S t + A t) × 100, where S b and A b represent the number of trypan blue‐positive cells in the supernatant and attached cells, respectively, and the S t and A t represent for the total number of cells in the supernatant and attached cells, respectively. For each determination, the results shown are representative of over 2,000 cells scored in at least three independent experiments. For experiments without extracellular Ca2+, EGTA was added to the RPMI medium at a final concentration of 2 mM, a concentration that was determined to suppress a detectable increase in the fluorescence of Fluo‐4‐AM‐loaded cells following ionophore challenge.
Western blotting
Cells challenged with Shigella strains were scraped in 200 μl Laemmli sample lysis buffer. Western blot analysis was performed using the following primary and secondary antibody dilutions: anti‐calpn4 (1:50,000); anti‐talin (1:10,000); anti‐actin (1:50,000); anti‐mouse IgG (1:20,000); and anti‐rabbit IgG (1:10,000) coupled to peroxidase. Immunoreactive bands were detected by chemiluminescence using the ECL plus reagent (GE Healthcare Biosciences) and the FujiFilm LAS 4000 system.
Statistical analysis
Statistical analysis was performed using Student's t‐test, Wilcoxon rank‐sum test, or one‐way analysis of variance (ANOVA). The error bars represent the standard error of the mean. P‐value < 0.05 was considered significant different between two groups, indicated by asterisks: *P ≤ 0.05; **P ≤ 0.01; and ***P ≤ 0.001.
Author contributions
CHS planned and performed most of the experimentation. GD and BW did the Ca2+ responses simulations and models. DIA analyzed the data and performed the statistical analysis. CE, NC, KD, SB, CS, and AL provided with key technical help. JE and LA provided with materials. CE and PS planned experiments and discussed the results. CV‐G performed statistical analysis. LC and GTVN planned, performed, and analyzed experiments. GD, BW, LC, and GTVN wrote the manuscript.
Conflict of interest
The authors declare that they have no conflict of interest.
Supporting information
Appendix
Expanded View Figures PDF
Table EV1
Review Process File
Source Data for Figure 7
Acknowledgements
The work was supported by the ANR grants MITOPATHO and PATHIMMUN, grant from Tournesol program No. 31268YG, and grants from the Labex Memolife and PSL IDEX Shigaforce. CHS is a recipient of a PhD grant from the China Scholarship Council. DA is a recipient of a CONACYT grant and Labex Memolife. CV‐G was a recipient of the PSL IDEX grant. NC is a recipient of a Marie‐Curie IRG grant. BW and GD are Research Fellow and Research Director at the Belgian F.R.S.‐F.N.R.S., respectively. This work was supported by the Fonds de la Recherche Scientifique‐FNRS under Grant No. J0043.14 and by the Fonds David and Alice Van Buuren. JE was supported by an ERC Starting (“Rupteffects” No. 261166) and a Consolidator Grant (“Endosubvert” No. 682809). LC, GD, and GTVN are recipients of a WBI‐France Exchange Program (Wallonie‐Bruxelles International, Fonds de la Recherche Scientifique, Ministère Français des Affaires étrangères et européennes, Ministère de l'Enseignement supérieur et de la Recherche dans le cadre des Partenariats Hubert Curien).
The EMBO Journal (2017) 36: 2567–2580
References
- Ashida H, Ogawa M, Kim M, Mimuro H, Sasakawa C (2012) Bacteria and host interactions in the gut epithelial barrier. Nat Chem Biol 8: 36–45 [DOI] [PubMed] [Google Scholar]
- Ashida H, Kim M, Sasakawa C (2014) Manipulation of the host cell death pathway by Shigella. Cell Microbiol 16: 1757–1766 [DOI] [PubMed] [Google Scholar]
- Ashida H, Mimuro H, Sasakawa C (2015) Shigella manipulates host immune responses by delivering effector proteins with specific roles. Front Immunol 6: 219 [DOI] [PMC free article] [PubMed] [Google Scholar]
- Balla T, Varnai P (2009) Visualization of cellular phosphoinositide pools with GFP‐fused protein‐domains. Curr Protoc Cell Biol 42: 24.4.1–24.4.27 [DOI] [PMC free article] [PubMed] [Google Scholar]
- Bergounioux J, Arbibe L (2012) Calpain activation by Shigella flexneri regulates key steps in the life and death of bacterium's epithelial niche. Med Sci (Paris) 28: 1029–1031 [DOI] [PubMed] [Google Scholar]
- Bergounioux J, Elisee R, Prunier AL, Donnadieu F, Sperandio B, Sansonetti P, Arbibe L (2012) Calpain activation by the Shigella flexneri effector VirA regulates key steps in the formation and life of the bacterium's epithelial niche. Cell Host Microbe 11: 240–252 [DOI] [PubMed] [Google Scholar]
- Berridge MJ, Lipp P, Bootman MD (2000) The versatility and universality of calcium signalling. Nat Rev Mol Cell Biol 1: 11–21 [DOI] [PubMed] [Google Scholar]
- Boal F, Puhar A, Xuereb JM, Kunduzova O, Sansonetti PJ, Payrastre B, Tronchere H (2016) PI5P triggers ICAM‐1 degradation in shigella infected cells, thus dampening immune cell recruitment. Cell Rep 14: 750–759 [DOI] [PubMed] [Google Scholar]
- Carneiro LA, Travassos LH, Soares F, Tattoli I, Magalhaes JG, Bozza MT, Plotkowski MC, Sansonetti PJ, Molkentin JD, Philpott DJ, Girardin SE (2009) Shigella induces mitochondrial dysfunction and cell death in nonmyleoid cells. Cell Host Microbe 5: 123–136 [DOI] [PubMed] [Google Scholar]
- Chantret I, Rodolosse A, Barbat A, Dussaulx E, Brot‐Laroche E, Zweibaum A, Rousset M (1994) Differential expression of sucrase‐isomaltase in clones isolated from early and late passages of the cell line Caco‐2: evidence for glucose‐dependent negative regulation. J Cell Sci 107(Pt. 1): 213–225 [DOI] [PubMed] [Google Scholar]
- de Chaumont F, Dallongeville S, Chenouard N, Herve N, Pop S, Provoost T, Meas‐Yedid V, Pankajakshan P, Lecomte T, Le Montagner Y, Lagache T, Dufour A, Olivo‐Marin J‐C (2012) Icy: an open bioimage informatics platform for extended reproducible research. Nat Methods 9: 690–696 [DOI] [PubMed] [Google Scholar]
- Dupont G, Abou‐Lovergne A, Combettes L (2008) Stochastic aspects of oscillatory Ca2+ dynamics in hepatocytes. Biophys J 95: 2193–2202 [DOI] [PMC free article] [PubMed] [Google Scholar]
- Dupont G, Lokenye EF, Challiss RA (2011) A model for Ca2+ oscillations stimulated by the type 5 metabotropic glutamate receptor: an unusual mechanism based on repetitive, reversible phosphorylation of the receptor. Biochimie 93: 2132–2138 [DOI] [PubMed] [Google Scholar]
- Franco SJ, Rodgers MA, Perrin BJ, Han J, Bennin DA, Critchley DR, Huttenlocher A (2004) Calpain‐mediated proteolysis of talin regulates adhesion dynamics. Nat Cell Biol 6: 977–983 [DOI] [PubMed] [Google Scholar]
- Galan JE, Lara‐Tejero M, Marlovits TC, Wagner S (2014) Bacterial type III secretion systems: specialized nanomachines for protein delivery into target cells. Annu Rev Microbiol 68: 415–438 [DOI] [PMC free article] [PubMed] [Google Scholar]
- Gillespie DT (1976) General method for numerically simulating stochastic time evolution of coupled chemical‐reactions. J Comput Phys 22: 403–434 [Google Scholar]
- Kim M, Ogawa M, Fujita Y, Yoshikawa Y, Nagai T, Koyama T, Nagai S, Lange A, Fassler R, Sasakawa C (2009) Bacteria hijack integrin‐linked kinase to stabilize focal adhesions and block cell detachment. Nature 459: 578–582 [DOI] [PubMed] [Google Scholar]
- Kobayashi T, Ogawa M, Sanada T, Mimuro H, Kim M, Ashida H, Akakura R, Yoshida M, Kawalec M, Reichhart JM, Mizushima T, Sasakawa C (2013) The Shigella OspC3 effector inhibits caspase‐4, antagonizes inflammatory cell death, and promotes epithelial infection. Cell Host Microbe 13: 570–583 [DOI] [PubMed] [Google Scholar]
- Konradt C, Frigimelica E, Nothelfer K, Puhar A, Salgado‐Pabon W, di Bartolo V, Scott‐Algara D, Rodrigues CD, Sansonetti PJ, Phalipon A (2011) The Shigella flexneri type three secretion system effector IpgD inhibits T cell migration by manipulating host phosphoinositide metabolism. Cell Host Microbe 9: 263–272 [DOI] [PubMed] [Google Scholar]
- Kraus M, Wolf B, Wolf B (1996) Crosstalk between cellular morphology and calcium oscillation patterns. Insights from a stochastic computer model. Cell Calcium 19: 461–472 [DOI] [PubMed] [Google Scholar]
- Kuehl CJ, Dragoi AM, Talman A, Agaisse H (2015) Bacterial spread from cell to cell: beyond actin‐based motility. Trends Microbiol 23: 558–566 [DOI] [PMC free article] [PubMed] [Google Scholar]
- LaRock DL, Chaudhary A, Miller SI (2015) Salmonellae interactions with host processes. Nat Rev Microbiol 13: 191–205 [DOI] [PMC free article] [PubMed] [Google Scholar]
- Leyman A, Pouillon V, Bostan A, Schurmans S, Erneux C, Pesesse X (2007) The absence of expression of the three isoenzymes of the inositol 1,4,5‐trisphosphate 3‐kinase does not prevent the formation of inositol pentakisphosphate and hexakisphosphate in mouse embryonic fibroblasts. Cell Signal 19: 1497–1504 [DOI] [PubMed] [Google Scholar]
- Mellouk N, Weiner A, Aulner N, Schmitt C, Elbaum M, Shorte SL, Danckaert A, Enninga J (2014) Shigella subverts the host recycling compartment to rupture its vacuole. Cell Host Microbe 16: 517–530 [DOI] [PubMed] [Google Scholar]
- Mounier J, Vasselon T, Hellio R, Lesourd M, Sansonetti PJ (1992) Shigella flexneri enters human colonic Caco‐2 epithelial cells through the basolateral pole. Infect Immun 60: 237–248 [DOI] [PMC free article] [PubMed] [Google Scholar]
- Mounier J, Popoff MR, Enninga J, Frame MC, Sansonetti PJ, Van Nhieu GT (2009) The IpaC carboxyterminal effector domain mediates Src‐dependent actin polymerization during Shigella invasion of epithelial cells. PLoS Pathog 5: e1000271 [DOI] [PMC free article] [PubMed] [Google Scholar]
- Muallem S (2005) Decoding Ca2+ signals: a question of timing. J Cell Biol 170: 173–175 [DOI] [PMC free article] [PubMed] [Google Scholar]
- Murakami T, Ockinger J, Yu J, Byles V, McColl A, Hofer AM, Horng T (2012) Critical role for calcium mobilization in activation of the NLRP3 inflammasome. Proc Natl Acad Sci USA 109: 11282–11287 [DOI] [PMC free article] [PubMed] [Google Scholar]
- Niebuhr K, Giuriato S, Pedron T, Philpott DJ, Gaits F, Sable J, Sheetz MP, Parsot C, Sansonetti PJ, Payrastre B (2002) Conversion of PtdIns(4,5)P(2) into PtdIns(5)P by the S. flexneri effector IpgD reorganizes host cell morphology. EMBO J 21: 5069–5078 [DOI] [PMC free article] [PubMed] [Google Scholar]
- Pendaries C, Tronchere H, Arbibe L, Mounier J, Gozani O, Cantley L, Fry MJ, Gaits‐Iacovoni F, Sansonetti PJ, Payrastre B (2006) PtdIns5P activates the host cell PI3‐kinase/Akt pathway during Shigella flexneri infection. EMBO J 25: 1024–1034 [DOI] [PMC free article] [PubMed] [Google Scholar]
- Ramel D, Lagarrigue F, Pons V, Mounier J, Dupuis‐Coronas S, Chicanne G, Sansonetti PJ, Gaits‐Iacovoni F, Tronchere H, Payrastre B (2011) Shigella flexneri infection generates the lipid PI5P to alter endocytosis and prevent termination of EGFR signaling. Sci Signal 4: ra61 [DOI] [PubMed] [Google Scholar]
- Rizzuto R, De Stefani D, Raffaello A, Mammucari C (2012) Mitochondria as sensors and regulators of calcium signalling. Nat Rev Mol Cell Biol 13: 566–578 [DOI] [PubMed] [Google Scholar]
- Romero S, Grompone G, Carayol N, Mounier J, Guadagnini S, Prevost MC, Sansonetti PJ, Van Nhieu GT (2011) ATP‐mediated Erk1/2 activation stimulates bacterial capture by filopodia, which precedes Shigella invasion of epithelial cells. Cell Host Microbe 9: 508–519 [DOI] [PMC free article] [PubMed] [Google Scholar]
- Shibao K, Fiedler MJ, Nagata J, Minagawa N, Hirata K, Nakayama Y, Iwakiri Y, Nathanson MH, Yamaguchi K (2010) The type III inositol 1,4,5‐trisphosphate receptor is associated with aggressiveness of colorectal carcinoma. Cell Calcium 48: 315–323 [DOI] [PMC free article] [PubMed] [Google Scholar]
- Smedler E, Uhlen P (2014) Frequency decoding of calcium oscillations. Biochim Biophys Acta 1840: 964–969 [DOI] [PubMed] [Google Scholar]
- Sorimachi H, Mamitsuka H, Ono Y (2012) Understanding the substrate specificity of conventional calpains. Biol Chem 393: 853–871 [DOI] [PubMed] [Google Scholar]
- Sorimachi H, Ono Y (2012) Regulation and physiological roles of the calpain system in muscular disorders. Cardiovasc Res 96: 11–22 [DOI] [PMC free article] [PubMed] [Google Scholar]
- Strehler EE (2015) Plasma membrane calcium ATPases: from generic Ca(2+) sump pumps to versatile systems for fine‐tuning cellular Ca(2.). Biochem Biophys Res Commun 460: 26–33 [DOI] [PubMed] [Google Scholar]
- Tanner K, Brzovic P, Rohde JR (2015) The bacterial pathogen‐ubiquitin interface: lessons learned from Shigella. Cell Microbiol 17: 35–44 [DOI] [PubMed] [Google Scholar]
- Tateishi Y, Hattori M, Nakayama T, Iwai M, Bannai H, Nakamura T, Michikawa T, Inoue T, Mikoshiba K (2005) Cluster formation of inositol 1,4,5‐trisphosphate receptor requires its transition to open state. J Biol Chem 280: 6816–6822 [DOI] [PubMed] [Google Scholar]
- Tattoli I, Sorbara MT, Vuckovic D, Ling A, Soares F, Carneiro LA, Yang C, Emili A, Philpott DJ, Girardin SE (2012) Amino acid starvation induced by invasive bacterial pathogens triggers an innate host defense program. Cell Host Microbe 11: 563–575 [DOI] [PubMed] [Google Scholar]
- Taufiq Ur R, Skupin A, Falcke M, Taylor CW (2009) Clustering of InsP3 receptors by InsP3 retunes their regulation by InsP3 and Ca2+ . Nature 458: 655–659 [DOI] [PMC free article] [PubMed] [Google Scholar]
- Thurley K, Tovey SC, Moenke G, Prince VL, Meena A, Thomas AP, Skupin A, Taylor CW, Falcke M (2014) Reliable encoding of stimulus intensities within random sequences of intracellular Ca2+ spikes. Sci Signal 7: ra59 [DOI] [PMC free article] [PubMed] [Google Scholar]
- Tran Van Nhieu G, Clair C, Bruzzone R, Mesnil M, Sansonetti P, Combettes L (2003) Connexin‐dependent inter‐cellular communication increases invasion and dissemination of Shigella in epithelial cells. Nat Cell Biol 5: 720–726 [DOI] [PubMed] [Google Scholar]
- Tran Van Nhieu G, Kai Liu B, Zhang J, Pierre F, Prigent S, Sansonetti P, Erneux C, Kuk Kim J, Suh PG, Dupont G, Combettes L (2013) Actin‐based confinement of calcium responses during Shigella invasion. Nat Commun 4: 1567 [DOI] [PubMed] [Google Scholar]
- Uhlen P, Fritz N (2010) Biochemistry of calcium oscillations. Biochem Biophys Res Commun 396: 28–32 [DOI] [PubMed] [Google Scholar]
- Valdivia R, Sedwick C (2014) Raphael Valdivia: how Chlamydia settles in. J Cell Biol 207: 4–5 [DOI] [PMC free article] [PubMed] [Google Scholar]
- Weiner A, Mellouk N, Lopez‐Montero N, Chang YY, Souque C, Schmitt C, Enninga J (2016) Macropinosomes are key players in early shigella invasion and vacuolar escape in epithelial cells. PLoS Pathog 12: e1005602 [DOI] [PMC free article] [PubMed] [Google Scholar]
Associated Data
This section collects any data citations, data availability statements, or supplementary materials included in this article.
Supplementary Materials
Appendix
Expanded View Figures PDF
Table EV1
Review Process File
Source Data for Figure 7


