

Abstract
The generation of neocortical neurons from neural progenitor cells (NPCs) is primarily controlled by transcription factors binding to DNA in the context of chromatin. To understand the complex layer of regulation that orchestrates different NPC types from the same DNA sequence, epigenome maps with cell type resolution are required. Here, we present genomewide histone methylation maps for distinct neural cell populations in the developing mouse neocortex. Using different chromatin features, we identify potential novel regulators of cortical NPCs. Moreover, we identify extensive H3K27me3 changes between NPC subtypes coinciding with major developmental and cell biological transitions. Interestingly, we detect dynamic H3K27me3 changes on promoters of several crucial transcription factors, including the basal progenitor regulator Eomes. We use catalytically inactive Cas9 fused with the histone methyltransferase Ezh2 to edit H3K27me3 at the Eomes locus in vivo, which results in reduced Tbr2 expression and lower basal progenitor abundance, underscoring the relevance of dynamic H3K27me3 changes during neocortex development. Taken together, we provide a rich resource of neocortical histone methylation data and outline an approach to investigate its contribution to the regulation of selected genes during neocortical development.
Keywords: Cas9, epigenome, histone methylation, neocortical development, neural progenitor cell
Subject Categories: Chromatin, Epigenetics, Genomics & Functional Genomics; Methods & Resources; Neuroscience
Introduction
The neocortex is the evolutionary youngest part of the mammalian brain and is considered to be the seat of higher cognitive functions in humans. Neocortical neurons result from balanced proliferative and differentiative divisions of diverse types of neural stem and progenitor cells—a process termed neurogenesis. Differences in proliferative capacity, abundance of NPC subtypes and their lineage relationships are thought to underlie interspecies differences in neuron number and neocortex size (Lui et al, 2011; Borrell & Reillo, 2012; Florio & Huttner, 2014; Silver, 2016).
During early development, the neural tube is formed by neuroepithelial cells (NECs), which undergo symmetric, proliferative divisions generating two daughter stem cells (Götz & Huttner, 2005; Taverna et al, 2014). With the switch to neurogenesis, NECs are replaced by apical radial glia (aRG), which are characterized by their ability to self‐renew and to generate neurons, either directly or indirectly through basal progenitors (BPs). The aRG cell bodies reside in the ventricular zone (VZ), whereas long basal processes contact the basal lamina (Götz & Huttner, 2005; Lui et al, 2011; Taverna et al, 2014). BPs have delaminated from the ventricular surface and their cell bodies reside in the subventricular zone (SVZ; Lui et al, 2011; Florio & Huttner, 2014). Two types of BPs, which both produce neurons, can be distinguished: basal intermediate progenitors (bIP) and basal radial glia (bRG). Whereas bIPs lack apical–basal polarity, bRGs have long basal processes contacting the basal lamina. Finally, newborn neurons migrate along the radial fibers to settle within the cortical plate (Götz & Huttner, 2005; Lui et al, 2011; Taverna et al, 2014).
Recent genomewide transcriptome studies in different mammalian species [reviewed in Silver (2016) and Florio et al (2016)] have uncovered gene expression signatures that specify neural cell type identities and underlie differential cortical progenitor behavior. Epigenetic information, in concert with transcription factors (TFs), enables the same primary DNA sequence to confer different identities to different cell types. Epigenetic systems, including modifications of DNA and histones, histone variants, and non‐coding RNAs, play essential roles as facilitators of cell fate transitions during development. Transcriptome analyses suggested that non‐coding RNAs control corticogenesis by tuning the expression of genes involved in proliferation and cell fate determination (Aprea et al, 2013; Arcila et al, 2014).
Histone modifications constitute a major epigenetic regulatory system. However, with regard to the development of the neocortex, histone modifications have so far only been annotated on bulk brain tissues and genomewide cell type‐specific histone methylation maps of the neocortex are lacking. Such data are required to reveal the complex layer of regulation that orchestrates diversity of NPC types from the same underlying genomic information.
Tri‐methylation of histone 3 at lysine 4 (H3K4me3) and lysine 27 (H3K27me3) have been intensely studied and shown to exert major functional roles. H3K27me3 is a hallmark of Polycomb group (PcG)‐associated transcriptional gene silencing (Comet et al, 2016). During neocortical development, PcG complexes were shown to contribute to the regulation of the balance between self‐renewal and differentiation of NPCs (Pereira et al, 2010; Egan et al, 2013) and to neuronal subtype specification (Morimoto‐Suzki et al, 2014). Moreover, PcGs control the transition from neurogenesis to gliogenesis (Hirabayashi et al, 2009; Pereira et al, 2010; Sparmann et al, 2013). From these studies, a few Polycomb‐regulated genes contributing to the observed phenotypes have emerged, including the neuronal TF Fezf2 (Morimoto‐Suzki et al, 2014) and the glial marker Gfap (Sparmann et al, 2013).
In contrast to H3K27me3, H3K4me3 has been linked to active transcription (Schubeler et al, 2004) and marks the majority of genes in embryonic stem cells (ESCs; Bernstein et al, 2006; Mikkelsen et al, 2007; Mohn et al, 2008). In addition to H3K4me3, many genes encoding developmental regulators also carry H3K27me3 in ESCs, resulting in a “bivalent” state, which has been hypothesized to keep future lineage choices open (Bernstein et al, 2006; Voigt et al, 2013). It remains unclear, however, how dynamic H3K4me3 and H3K27me3 changes are in the context of the rapid cellular transitions during neocortex development, and whether and how bivalency is used by diverse NPC populations during cortical lineage progression.
To date, the contribution of histone methylation to neurogenesis has been mainly investigated by genetic studies of histone‐modifying enzymes, typically affecting methylation at hundreds to thousands of downstream target genes. However, with technological advances in epigenome editing tools, the investigation of histone methylation at any genomic site of interest is within reach. Several proof‐of‐principle studies in tissue culture cells have shown that editing of histone and DNA methylation is possible and results in targeted transcriptional activation or repression, depending on the chosen effector protein (reviewed in Thakore et al 2016). Two recent seminal studies have achieved targeted DNA methylation editing in the developing mouse neocortex (Liu et al, 2016; Morita et al, 2016), opening avenues to manipulate epigenetic modifications in vivo.
Here, we have set out to resolve histone methylation dynamics in vivo in different neocortical cell populations. We describe genomewide H3K4me3 and H3K27me3 with cell type resolution in the developing mouse neocortex. Moreover, we establish H3K27me3 editing in the developing brain and apply it to investigate the functional relevance of H3K27me3 dynamics at a key regulator of cortical NPCs.
Results
Profiling histone methylation in the developing mouse neocortex
To characterize histone methylation dynamics in the developing mouse neocortex, we isolated various neural cell populations exploiting a combination of morphological features and molecular markers together with fluorescent activated cell sorting (FACS; Florio et al, 2015). NECs were purified from the dorsolateral telencephalon of embryonic day (E) 9.5 mouse embryos based on positivity for the apical plasma membrane marker Prom1 and negativity for Tis21‐GFP, specifically marking progenitors undergoing differentiative divisions (Haubensak et al, 2004; Fig 1A). At mid‐neurogenesis (E14.5), we isolated aRG contacting both the ventricular surface and the basal lamina by Prom1 staining and basal application of the fluorescent membrane dye DiI (Florio et al, 2015). aRG were further distinguished by the absence and presence of Tis21‐GFP expression into proliferative aRG (aRG‐P) and aRG committed to the neurogenic lineage (aRG‐N) constituting nascent BPs. Moreover, we included bRG as representative of BPs. Even though bRG are less abundant than bIPs in mouse, their basal processes facilitated isolation by basal application of DiI. Moreover, bRG and bIPs are largely similar in their gene expression in mouse (Florio et al, 2015). bRG were distinguished from neurons using the transgenic Tubb3‐GFP mouse line, in which GFP is expressed specifically by neurons (Attardo et al, 2008).
Figure 1. Histone methylation patterns in defined cortical progenitor cell types and neurons.
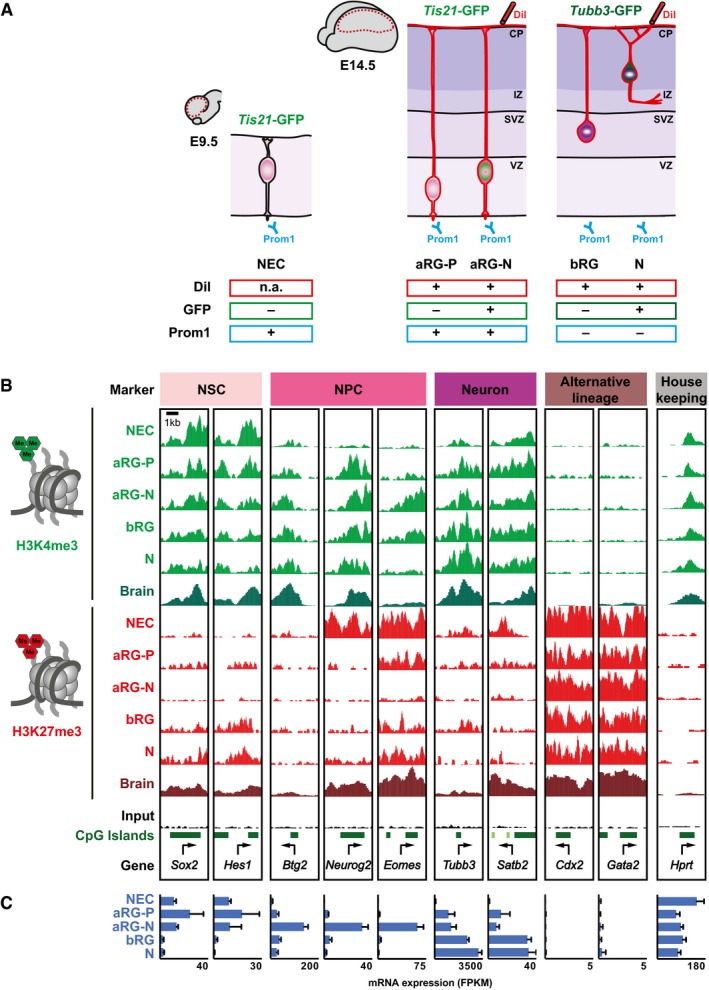
- Schematic overview of the transgenic mouse lines and markers used to isolate distinct neural progenitor cell types and neurons from the developing mouse neocortex (Florio et al, 2015): NECs at E9.5; aRG‐P, aRG‐N, bRG, and neurons (N) at E14.5 (collectively referred to as defined neural cell populations). Dashed red lines in the brain cartoons indicate dissected area.
- H3K4me3 (green) and H3K27me3 (red) ChIP‐seq signals around selected TSS (± 2 kb) in the defined neural cell populations. Genes were selected to represent the distinct cell states indicated on top. For comparison, E14.5 whole‐brain (Brain) ChIP‐seq profiles from ENCODE/LICR are shown.
- mRNA expression of genes shown in (B), analyzed by RNA‐seq. RNA‐seq data for RG and neurons are from Florio et al (2015), and those for NEC were determined here. Error bars represent SD of four or five biological replicates.
In all, we have isolated five neural cell populations (Fig 1A). To confirm the identity of isolated populations, we performed RT–qPCR of known cell type markers (Appendix Fig S1) and, in addition, generated RNA‐seq data for NECs, which we compared to previously reported data from E14.5 cell populations (Florio et al, 2015).
Next, we performed ChIP‐sequencing (ChIP‐seq) for H3K4me3 and H3K27me3, adapting a protocol for small cell numbers (see Materials and Methods) using two biological replicates of batches of 50,000 sorted cells. For each of the neural cell populations, we confirmed that H3K4me3 was enriched at highly expressed genes with the known bimodal peak shape around the TSS, whereas H3K27me3 was enriched across silent or lowly expressed genes (Appendix Fig S2). For constitutively expressed housekeeping (Hprt) or constitutively repressed alternative lineage (Cdx2, Gata2) genes, our ChIP‐seq data recapitulated ENCODE results generated by conventional ChIP‐seq on whole E14.5 brain (Fig 1B and C). Moreover, our data set enabled us to resolve cell type‐specific histone methylation patterns. Neural stem cell (NSC) genes like Sox2 and Hes1 display high levels of H3K4me3 in NECs and aRG, in which they are highly expressed, while H3K4me3 levels decline and H3K27me3 levels increase with ceasing expression (Fig 1B and C). The NPC TFs Btg2, Neurog2, and Eomes show dynamic H3K4me3, and in particular, Eomes displays highly dynamic H3K27me3 levels. These NPC genes show highest expression in aRG‐N (Florio et al 2015; Fig 1C), in which H3K27me3 is absent from their promoters. Finally, the promoters of neuronal markers, like Tubb3 and Satb2, gradually acquire H3K4me3.
The ChIP‐seq data were highly reproducible between biological replicates (Appendix Fig S3) and were validated by two independent ChIP‐qPCR experiments for selected genes (Appendix Fig S4). Taken together, we have generated high‐quality H3K4me3 and H3K27me3 ChIP‐seq maps with cell type resolution of the developing mouse neocortex.
Bivalent genes in neural lineage progression
We then identified genes with significant histone methylation peaks at their TSS using the MACS2 program (Fig 2A; Datasets EV1, EV2 and EV3). We first asked which genes are marked by H3K27me3 in the neural lineage. Gene ontology (GO) analyses revealed that genes marked by H3K27me3 in all the defined neural cell types are enriched for genes critical for the development of other organs, including the digestive tract, reproductive organs, and skeletal system, which are silenced in the brain (Appendix Fig S5A). In addition, several genes expressed in the oligodendrocytic lineage are also marked by H3K27me3, whereas genes characteristic for astrocytes do not carry H3K27me3 (Appendix Fig S6, see our data and ENCODE data). This is in agreement with previous reports indicating that astrocyte‐specific genes are regulated by DNA methylation in NPCs (Fan et al, 2005; Hatada et al, 2008).
Figure 2. Genes that are bivalent in embryonic neurons are primed for expression during postnatal neuronal maturation.
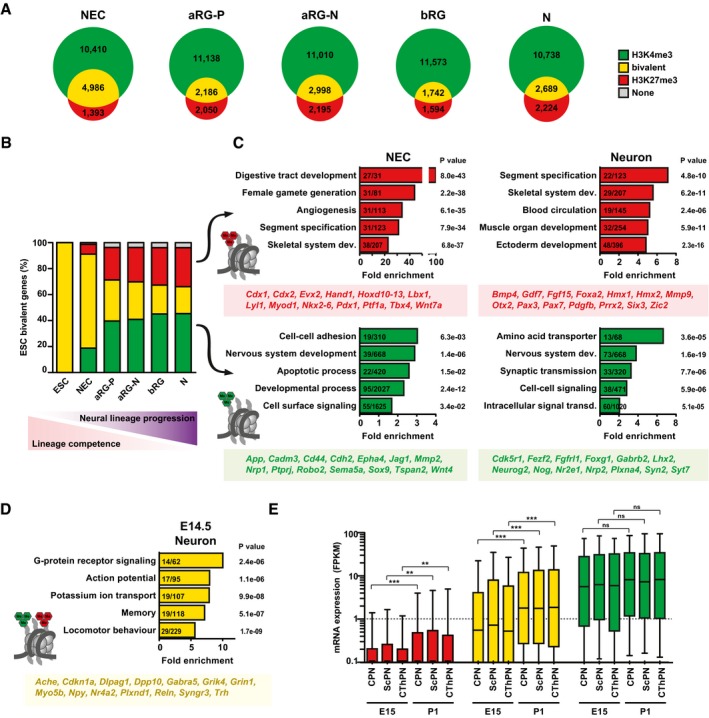
- Venn diagrams showing the numbers of genes with significant H3K4me3 peaks, H3K27me3 peaks, or both, for each of the defined neural cell populations.
- The genes that were previously identified to be bivalent in mouse ESC (Mikkelsen et al, 2007; Mohn et al, 2008; n = 2,491, yellow) were analyzed for the percentage of H3K4me3 (green), H3K27me3 (red), bivalent (yellow), or no modifications (gray), in the defined neural cell populations, that is, during neural lineage progression.
- GO term enrichment analysis of those ESC‐bivalent genes that are resolved to either H3K27me3 (top) or H3K4me3 (bottom) in NECs (left) or up to neurons (right), as shown in (B). The five GO term clusters with the lowest P‐value are shown (category: biological process). The number of genes present in the tested list over the number of genes in the reference gene set is indicated within the bars. The P‐value is given next to each bar. Example genes present in the four groups are given below each graph.
- GO term enrichment analysis of ESC‐bivalent genes that remain bivalent in E14.5 neurons.
- The genes marked by H3K27me3 (red), bivalent genes (yellow), and the genes marked by H3K4me3 (green) in E14.5 neurons (see B) were analyzed for their mRNA expression shown as box plots (expressed in FPKM) during subsequent neuronal differentiation in specific neuron subpopulations at E15 and postnatal day 1 (P1), using the data of Molyneaux et al (2015); CPN, callosal projection neurons; ScPN, subcerebral projection neurons; CThPN, corticothalamic projection neurons. Boxes represent first quartile (bottom), median, and third (top) quartile; whiskers refer to 10th and 90th percentiles. Log scale was used to facilitate viewing of FPKM values in the lower range. Significance was calculated using a Kruskal–Wallis test; **P < 0.01; ***P < 0.0001.
In each of our defined neural cell populations, we found that more than half of the genes with H3K27me3 also carried H3K4me3 (Appendix Fig S5B and C), that is, were “bivalent” (Bernstein et al, 2006; Mikkelsen et al, 2007). Bivalent domains are thought to be less abundant in differentiated cells (Mikkelsen et al, 2007; Burney et al, 2013). In line with this, we found that ~80% of H3K27me3‐positive genes were bivalent in NECs before the onset of neurogenesis, whereas with developmental progression numbers dropped to < 60% in RG. Notably, numbers did not drop further in neurons, indicating that these post‐mitotic cells maintain a substantial number of bivalent domains.
In ESCs, many bivalent genes encode TFs of developmental importance (Bernstein et al, 2006). The resolution of genes that are bivalent in ESCs to an H3K4me3‐positive state in ESC‐derived differentiated cells has been exploited to discover novel regulators in cell lineages of interest (Lien et al, 2011). We therefore assessed the histone methylation dynamics of previously identified ESC‐bivalent genes (Mikkelsen et al, 2007; Mohn et al, 2008) during neocortical development. While a large fraction of ESC‐bivalent genes remains bivalent in NECs at E9.5, many ESC‐bivalent genes are resolved during lineage progression to neurons at E14.5 (Fig 2B). Genes that are resolved to H3K27me3 are involved in the development of other organs (Fig 2C), whereas genes that are resolved to H3K4me3 are related to “nervous system development”, “cell adhesion”, and “cell surface signaling”. Among the genes that are resolved to an H3K4me3‐positive state in the neural lineage are many known key regulators of neurogenesis, including the TFs Sox9, Fezf2, Foxg1, and Neurog2, as well as many as yet uncharacterized genes (Dataset EV4) that may represent novel regulators of cortical development awaiting future exploration.
Notably, ESC‐bivalent genes that remained bivalent in neurons at mid‐neurogenesis were enriched for genes involved in neuron differentiation, specifically “action potential”, “ion transport”, “memory”, and “locomotor behavior” (Fig 2D; Burney et al, 2013). We therefore hypothesized that these genes may be poised for activation during later stages of neuronal maturation. To investigate this possibility, we examined recently published transcriptomes of various pyramidal neuron subtypes across cortical development (Molyneaux et al, 2015). This analysis revealed low average expression (< 1 FPKM) of the described neuron‐bivalent genes at E15, which, however, significantly increased in postnatal neurons of different subtypes (Fig 2E; Appendix Fig S5D and E). Among the genes that were bivalent in neurons at E14.5 and increased expression postnatally were several calcium channel subunits (Cacna1g, Cacna2d3, and Cacng2), the glutamate receptor channel subunit NMDA1 (Grin1), the neuromodulator neuropeptide Y (Npy), and the extracellular matrix glycoprotein reelin (Reln).
Taken together, genes marked by bivalent histone marks in neurons are expressed at subthreshold levels during development, but show increased expression with postnatal neuronal maturation. This suggests that bivalent marking in post‐mitotic neurons helps to maintain genes responsive to developmental cues, as has been previously proposed for various stem cell types (Voigt et al, 2013).
Genes with broad H3K4me3 domains are enriched for neural cell type regulators
In addition to bivalent domains, another feature of chromatin has recently been used to identify novel cell type regulators—that is, H3K4me3 domain breadth (Benayoun et al, 2014). In various cell types, the genes with the 5% broadest H3K4me3 domains were characteristic for the identity and function of that specific cell type. We applied the same approach to the defined neural cell populations and identified many TFs, epigenetic regulators, and non‐coding RNAs as well as many uncharacterized genes (Fig 3A–C; Dataset EV5). Of the genes with broad H3K4me3 domains, 166 were common to all five cell types, including the TFs Myc, Foxp1, and Foxp4 and the non‐coding RNAs Malat1 and Mir99b. Genes with these shared broad domains showed enrichment for general GO terms like “regulation of transcription” and “RNA splicing” (Fig 3D).
Figure 3. Genes with broad H3K4me3 domains at their TSS are enriched for neural cell type regulators.
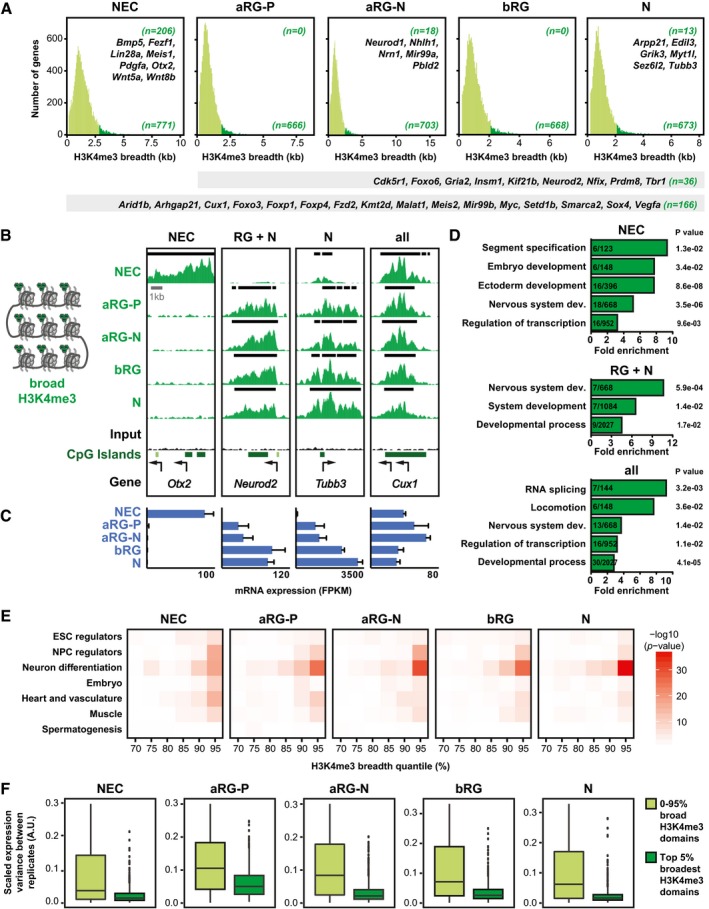
- Breadth distributions of H3K4me3 ChIP‐seq peaks at TSS (± 2 kb) in the defined neural cell populations. The 5% broadest H3K4me3 peaks are highlighted in dark green for each cell type, with the number of such genes shown in the bottom right corner of each graph. The numbers of genes that are specific to one cell type and a number of example genes are shown in the top right corner. The numbers of genes that are found in all of the defined neural cell populations or in the four E14.5 neural cell populations and a number of example genes are shown in the gray bars below the graphs.
- Example ChIP‐seq tracks for genes with broad H3K4me3 peaks. Black lines above each track indicate significant peaks (called with MACS2). Arrows indicate TSS. Note that for the ChIP‐seq data for Tubb3, a larger region around the TSS is shown than in Fig 1B.
- mRNA expression for genes shown in (B), analyzed by RNA‐seq. Error bars represent SD of four or five biological replicates.
- GO term enrichment analysis of genes marked by broad H3K4me3 peaks in NECs (top), all radial glia (RG) plus neurons (N, middle), or all cell types (bottom). The five GO term clusters with the lowest P‐value are shown (category: biological process).
- For each neural cell type shown, previously identified genes implicated in different biological categories (see Dataset EV6) were plotted against H3K4me3 peak breadth, binned into 5% quantiles. Significance of enrichment is presented as −log10(P‐value) and was calculated using Fisher's exact test.
- Transcriptional variability of genes with the top 5% broadest H3K4me3 domains compared to remaining genes (0–95% H3K4me3 domains), based on RNA‐seq data. Significance was calculated with a Wilcoxon rank sum test with continuity correction and is < 2.2e‐16 for all cell types. Boxes represent first quartile (Q1, bottom), median, and third quartile (Q3, top); whiskers refer to 1.5 × IQR (interquartile range); dots represent outliers.
In addition to shared broad H3K4me3 domains, NECs were distinguished by 206 NEC‐specific broad H3K4me3 domains. The related genes showed enrichment for the GO term categories “segment specification”, “embryo development”, and “nervous system development” (Fig 3D). Notably, most genes with NEC‐specific broad H3K4me3 domains were linked by co‐expression relationships, suggesting that they may be functionally related (Appendix Fig S7A). The four neural cell populations isolated at E14.5 were highly similar and yielded only a few genes with cell type‐specific broad H3K4me3 domains (Fig 3A), among which were Neurod1 (Pataskar et al, 2016) and Mir99a for aRG‐N and Myt1l and Tubb3 for neurons.
Next, we compared the genes with broad H3K4me3 domains in the defined neural cell populations with previously identified genes implicated in various distinct cell lineages (Fig 3E; Dataset EV6). In NECs, the set of the 5% broadest H3K4me3 domains showed the strongest enrichment for the gene lists “NPC regulators” and “neuron differentiation”. In line with their role as earliest and least committed stem cells in the neural lineage, NECs also showed enrichment of other embryonic and stem cell gene lists including “ESC regulators”, “embryo”, and “heart and vasculature”. With neural lineage progression, the genes with the broadest H3K4me3 domains became specifically enriched for “neuron differentiation” genes. For each of the five defined neural cell populations, the 5% broadest H3K4me3 domains showed the greatest enrichment for these gene sets, underscoring the validity of the approach.
Genes marked by the broadest H3K4me3 domains were shown to exhibit enhanced transcriptional consistency rather than increased transcriptional levels (Benayoun et al, 2014). Indeed, the genes with the top 5% broadest H3K4me3 domains showed significantly reduced variance in gene expression compared to the remaining genes in all five neural cell populations (Fig 3F).
Taken together, we have used H3K4me3 domain breadth as a tool to discover potential cortical regulators (Dataset EV5). Some of the identified genes are well‐known players in brain development, including seven out of the eleven known induced neural stem cell reprogramming factors (Appendix Fig S7B and C; Dataset EV6), whereas many of the other identified genes await future investigation regarding their role in neurogenesis.
Histone methylation changes during neurogenesis
To compare the distribution of histone methylation across the entire genome among the defined neural cell populations, we performed principal component analysis (PCA). Regarding H3K4me3, the five cell populations were positioned along PC1 according to the known progression of the neural lineage (Fig 4A and Appendix Fig S8A). In contrast, PCA for H3K27me3 revealed three different groups: NECs were separate from aRG‐P and aRG‐N, which clustered together, and those three populations were separate from bRG and neurons, which were also close together (Fig 4B and Appendix Fig S8B). This suggests that there are two transitions with respect to the genomic distribution of H3K27me3 during neocortical lineage progression: the first between NECs at E9.5 and aRG at E14.5, and the second between apical and basal RG. Notably, comparison of transcriptome data identified most differentially expressed genes for the same two transitions (Appendix Fig S9A–D).
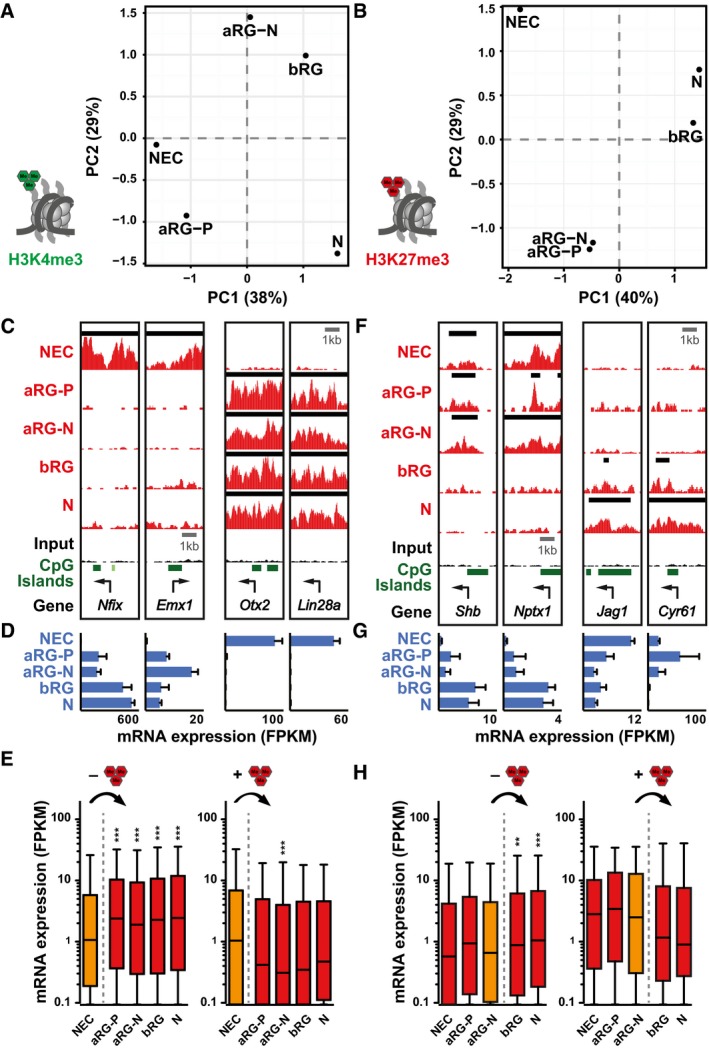
Figure 4. Changes in histone methylation correlate with gene expression differences and mark major developmental transitions.
-
A, BPrincipal component analysis (PCA) of H3K4me3 (A) and H3K27me3 (B) signals. The percentage of variance covered by the first two components is indicated.
-
CExample ChIP‐seq tracks for genes that loose (left) or gain (right) H3K27me3 from E9.5 NECs to E14.5 aRG‐P. Black lines above each track indicate peaks (called with MACS2). Arrows indicate TSS.
-
DmRNA expression for genes shown in (C), analyzed by RNA‐seq.
-
EmRNA expression (in FPKM) of genes that loose (left, n = 2,857) or gain (right, n = 714) H3K27me3 from E9.5 NECs to E14.5 aRG‐P, shown as box plots.
-
FExample ChIP‐seq tracks for genes that loose (left) or gain (right) H3K27me3 from aRG‐N to bRG.
-
GmRNA expression for genes shown in (F), analyzed by RNA‐seq.
-
HmRNA expression (in FPKM) of genes that loose (left, n = 2,051) or gain (right, n = 197) H3K27me3 from aRG‐N to bRG, shown as box plots.
Next, we asked whether transitions in H3K27me3 correlated with gene expression differences. For the first major transition in H3K27me3 from E9.5 NECs to E14.5 aRG‐P (Fig 4C and D), genes losing H3K27me3 were expressed at higher levels in all the four cell populations at E14.5 compared to E9.5 NECs, whereas gain of H3K27me3 did not result in immediate overall gene expression differences (Fig 4E). Likewise, for the second transition in H3K27me3 from apical (aRG‐N) to basal (bRG) progenitors (Fig 4F and G), genes losing H3K27me3 were expressed at higher levels in bRG and neurons as compared to aRG‐N, whereas gain of H3K27me3 did not significantly reduce gene expression (Fig 4H). In contrast, changes in H3K27me3 among other cell populations were not predictive of global gene expression differences (Appendix Fig S9E and F).
Taken together, differences in the genomic distribution of H3K27me3 highlight two major transitions in neocortical development. The first transition characterizes the developmental progression from the earliest neural progenitors before the onset of neurogenesis to more committed aRG at mid‐neurogenesis. The second transition occurs between apical and basal RG, which in mouse is characterized by the loss of ventricular contact and reduced proliferative capacity. These transitions in H3K27me3 distribution are accompanied by global gene expression changes and may thus facilitate cell type transitions.
Dynamic H3K27me3 in closely related neural cell populations
Next, we were interested to find out whether H3K27me3 also undergoes transient changes, in addition to the unidirectional loss and gain described above. In particular, we aimed at identifying genes that show a transient decrease in H3K27me3 in the closely related neural cell populations at E14.5, potentially involved in subpopulation‐specific induction of gene expression. We first filtered for genes with a significant H3K27me3 peak in aRG‐P and neurons (based on Dataset EV1) to identify genes that could potentially undergo a transient decrease in H3K27me3. To then quantitatively compare H3K27me3 levels among the E14.5 populations, we calculated an enrichment score for each gene (Pataskar et al, 2016). Secondly, using this enrichment score, we filtered for genes with an enrichment > 0.5 in aRG‐P and neurons to select genes with high levels of H3K27me3. Lastly, we filtered for genes which showed a more than 1.5‐fold decrease in H3K27me3 enrichment from proliferative to neurogenic aRG. We found 50 such genes undergoing transient loss of H3K27me3 in the E14.5 neural cell populations (Fig 5A and B). For six of these 50 genes, transient decrease in H3K27me3 levels correlated with significantly increased mRNA expression levels (Fig 5C). Among the genes with transient decrease in H3K27me3 and concomitant increase in gene expression were several TFs with known functions in neocortex development like Eomes, Pou3f2, Sox6, Dmrta2, and Neurog1. Moreover, GO term enrichment analysis also indicated that genes with dynamic H3K27me3 showed enrichment for the categories “cell proliferation forebrain”, “cell fate commitment”, and “transcription” (Fig 5D), suggesting that histone methylation dynamics may contribute to the regulation of key developmental regulators of neocortex development.
Figure 5. Dynamic changes in H3K27me3 in closely related neural cell types.
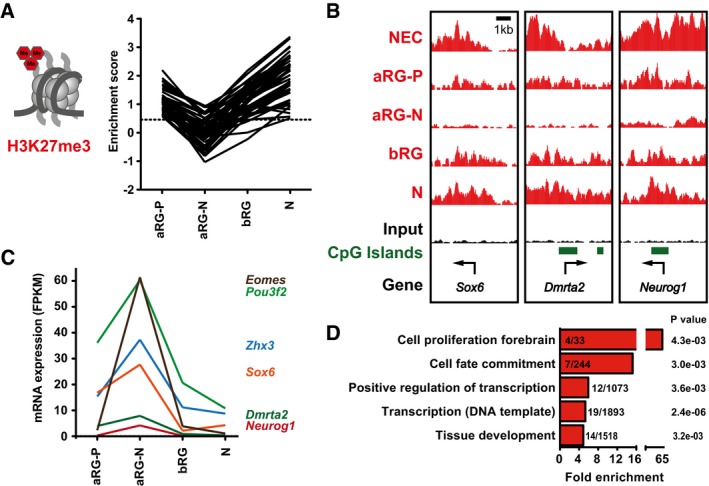
- Line plot depicting H3K27me3 enrichment scores of genes with transient dynamic changes in H3K27me3 in the neural cell populations isolated at E14.5 (n = 50 genes).
- Example ChIP‐seq tracks for genes with dynamic changes in H3K27me3 in E14.5 neural cell populations. Arrows indicate TSS.
- mRNA expression (in FPKM) of genes with dynamic changes in H3K27me3 in E14.5 neural cell populations and significant changes in gene expression (n = 6 genes) between aRG‐P and aRG‐N, shown as line plots. The differential gene expression analysis was performed with cufflinks (v2.2.1) using 0.01 as P‐value cutoff.
- GO term enrichment analysis of genes with dynamic changes in H3K27me3 in E14.5 neural cell populations. The five GO term clusters with the lowest P‐value are shown (category: biological process).
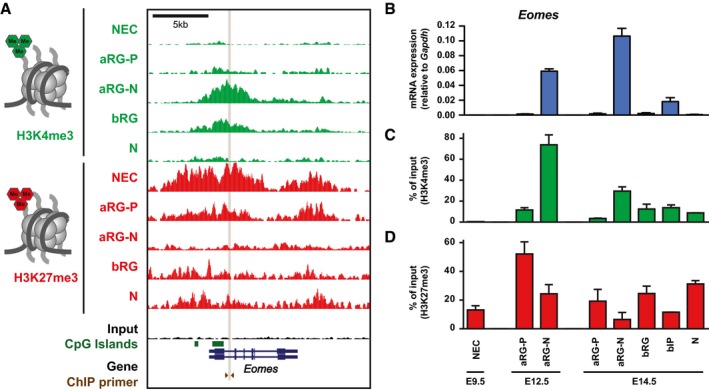
To further test this possibility, we selected one of the genes for more detailed analysis of gene expression and histone methylation dynamics. We chose Eomes (Fig 6A), which expresses the key BP regulator Tbr2 and is implicated in the transition of aRG into BPs (Arnold et al, 2008; Sessa et al, 2008). Eomes mRNA is highly expressed in aRG‐N (both at E12.5 and E14.5), remains expressed at intermediate levels in bIP, and is downregulated in neurons (Figs 1C and 6B; Florio et al, 2015). To confirm the ChIP‐seq data for Eomes, we performed two independent ChIP‐qPCR experiments (using 50,000 cells each) and also added additional cell populations including E12.5 aRG‐P and aRG‐N as well as E14.5 bIP (Fig 6C and D), which is the main cell type expressing Tbr2 protein in mouse. The Eomes locus is initially marked by H3K27me3 in NECs. H3K27me3 levels decline from aRG‐P to aRG‐N with a concomitant increase in H3K4me3 levels (both at E12.5 and E14.5). In accordance with intermediate Eomes mRNA expression in bIP (Fig 6B; Florio et al, 2015), H3K4me3 levels are lower and H3K27me3 higher in bIP than in aRG‐N. Eventually, high H3K27me3 levels are re‐established and H3K4me3 levels become reduced in neurons. Collectively, Eomes mRNA is only expressed in those neural cell populations in which H3K4me3 levels predominate over H3K27me3.
Figure 6. Histone methylation at the mouse Eomes locus undergoes dynamic changes during neocortex development.
-
AH3K4me3 (green) and H3K27me3 (red) ChIP‐seq tracks at the mouse Eomes locus in the defined neural cell populations. Note that a larger region showing the entire Eomes locus is shown, compared to the TSS in Fig 1B.
-
BTime course of Eomes mRNA expression in the defined neural cell populations at E9.5, E12.5, and E14.5, as determined by RT–qPCR.
-
C, DTime course of the level of H3K4me3 (C) and H3K27me3 (D) at the Eomes locus as determined by ChIP‐qPCR in the defined neural cell populations at E9.5, E12.5, and E14.5. The amount of DNA obtained after ChIP‐qPCR using control IgG was < 0.5% of the input DNA for all cell populations. The location of the primers used for ChIP‐qPCR is indicated in (A).
Editing of H3K27me3 in the developing neocortex
To investigate whether H3K27me3 changes at the Eomes locus are instrumental to the regulation of gene expression and lineage progression in the developing neocortex, we established a CRISPR/Cas9‐based system (Thakore et al, 2016) that allows targeted editing of H3K27me3 in vivo. To edit histone methylation at the Eomes locus, we first designed and tested several guide RNAs (gRNAs; Appendix Fig S10A–C; Dataset EV7) targeting the two CpG islands located close to the Eomes TSS (Fig 7A). We selected CpG islands for targeted editing because PcG complexes (mediating H3K27me3) are known to primarily localize to CpG islands, and induced de novo binding of PcG complexes has been shown to be restricted to CpG islands of untranscribed genes (Mendenhall et al, 2010; Riising et al, 2014). For in vivo epigenome editing, we started with a construct that encodes a gRNA, Cas9, and a fluorescent reporter and that we had previously applied successfully for gene disruption in the embryonic mouse neocortex (Kalebic et al, 2016). With this construct as template, we introduced two mutations into Cas9 to render it nuclease‐deficient (dCas9; Qi et al, 2013) and fused it via its C‐terminus to the H3K27me3 histone methyltransferase Ezh2, using a previously described linker (Kearns et al, 2015). Several variant constructs for in vivo epigenome editing were generated, each encoding a specific gRNA and dCas9‐Ezh2‐T2A‐PaprikaRFP (Fig 7B). A gRNA targeting LacZ (gLacZ) was used as control (Kalebic et al, 2016). For targeting of the Eomes locus, two constructs, each expressing one gRNA targeting one of the CpG islands (gRNA2 or gRNA4), were combined (referred to as gEomes).
Figure 7. Epigenome editing of Eomes in the developing mouse neocortex.
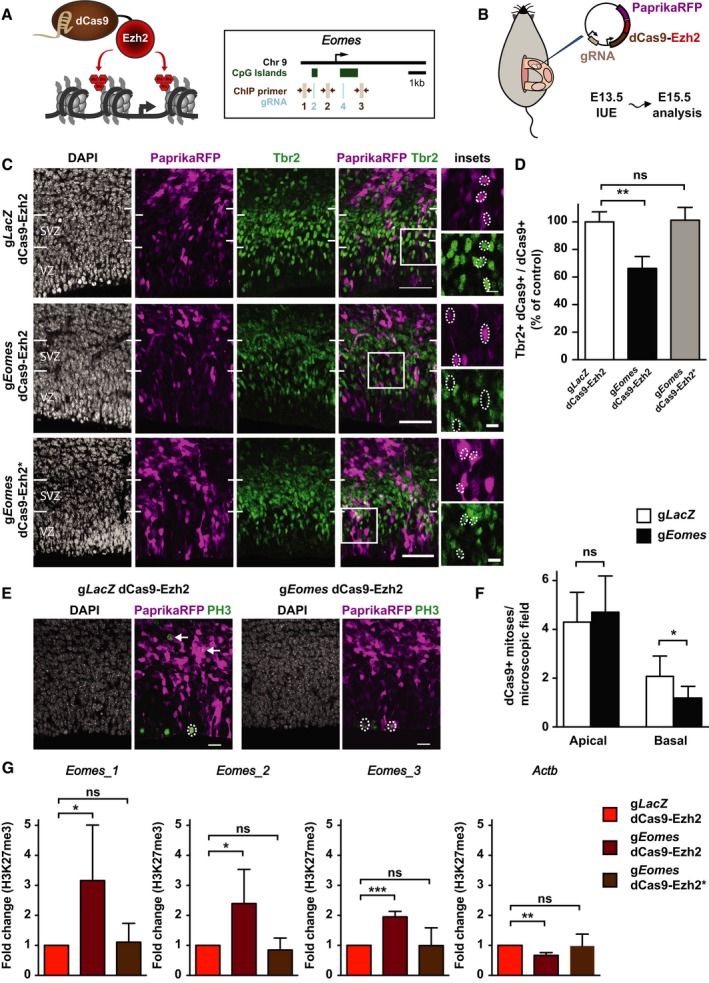
- Schematic overview of the CRISPR/Cas9‐based deposition of H3K27me3 at the Eomes locus. The localization of gRNAs (light blue) and ChIP‐qPCR primers (brown) is indicated.
- Schematic overview (adapted from Kalebic et al, 2016) of the IUE experiments using dCas9‐Ezh2.
- Mouse E13.5 dorsolateral telencephalon was in utero electroporated with a plasmid encoding PaprikaRFP and either gLacZ dCas9‐Ezh2 (control, top row), gEomes dCas9‐Ezh2 (middle row), or gEomes dCas9‐Ezh2* mutant (bottom row), followed by analysis at E15.5 of PaprikaRFP fluorescence (magenta) and Tbr2 immunofluorescence (green) combined with DAPI staining (white). Images represent single optical sections. White boxes indicate areas shown at higher magnification in the insets. Dotted ellipses indicate examples of nuclei of PaprikaRFP‐positive cells. Note the presence of Tbr2 immunoreactivity in the gLacZ dCas9‐Ezh2 control and gEomes dCas9‐Ezh2* mutant condition and its reduction upon gEomes dCas9‐Ezh2 IUE. Scale bars, 50 μm and 10 μm (insets).
- Quantification of the percentage of dCas9‐positive cells that are Tbr2‐positive 48 h after gLacZ dCas9‐Ezh2 (white, n = 7 IUE experiments), gEomes dCas9‐Ezh2 (black, n = 5), or gEomes dCas9‐Ezh2* mutant (gray, n = 4) IUE. The average of all control samples was set to 100%. Data represent mean ± SD. **P < 0.005 (Mann–Whitney U‐test); ns, not significant.
- Analysis of PaprikaRFP fluorescence (magenta) and PH3 immunofluorescence (green) combined with DAPI staining (white) following IUE. Dotted ellipses indicate examples of apical, and arrows of basal, mitotic targeted cells. Images represent single optical sections. Scale bars, 20 μm.
- Quantification of apical and basal dCas9‐positive mitoses 48 h after gLacZ (white) and gEomes (black) dCas9‐Ezh2 IUE. Data represent mean ± SD (n = 9 IUE experiments). *P < 0.05 (Student's t‐test); ns, not significant.
- ChIP‐qPCR analysis of H3K27me3 levels around the TSS of Eomes and an unrelated gene (Actb) after IUE. Electroporated (PaprikaRFP+) neurogenic (Tis21‐GFP+) NPCs were isolated by FACS. Error bars represent SD of biological replicates (n = 4 IUE experiments). Fold changes are relative to respective control. Significance was calculated using a one‐sample t‐test on log‐transformed fold change values (see Appendix Fig S10F). *P < 0.05; **P < 0.01; ***P < 0.001; ns, not significant.
To achieve in vivo epigenome editing and thereby counteract the dynamic reduction in H3K27me3 in aRG‐N and bIP, the constructs were delivered into aRG by in utero electroporation (IUE) at E13.5 and the effects analyzed at E15.5 in the progeny of electroporated aRG (Fig 7B). Upon IUE of gEomes, the proportion of Tbr2‐positive cells among the targeted cells (revealed by PaprikaRFP) was significantly reduced in the VZ and SVZ, as compared to the gLacZ control (Fig 7C and D; Appendix Fig S10D and E). To exclude that the reduction in Tbr2 expression was due to steric hindrance caused by dCas9‐Ezh2 binding near the Eomes promoter rather than actual epigenome editing, we also electroporated a construct with two point mutations in the Ezh2 SET domain (dCas9‐Ezh2*), which render its histone methyltransferase domain inactive (Muller et al, 2002). IUE of dCas9‐Ezh2* did not result in a reduction in the proportion of Tbr2‐positive cells (Fig 7C and D; Appendix Fig S10D and E), suggesting that our system induces gene repression through deposition of repressive H3K27me3 marks.
Deletion of Eomes in the developing mouse neocortex has previously been shown to reduce the abundance of BPs (Arnold et al, 2008; Sessa et al, 2008). To assess whether BPs were also affected upon manipulation of epigenetic regulation of the Eomes locus, we analyzed basal mitoses using the mitotic marker phospho‐histone 3 (PH3). Indeed, 48 h after gEomes dCas9‐Ezh2 IUE, basal mitoses among the targeted cells were significantly reduced compared to gLacZ control, whereas apical mitoses were unaffected (Fig 7E and F). Thus, forced persistence of repressive histone methylation targeted to a major BP‐regulating locus recapitulated phenotypic outcomes previously observed upon genetic disruption of the same locus (Arnold et al, 2008; Sessa et al, 2008; Kalebic et al, 2016). Together with the highly dynamic histone methylation pattern observed at the Eomes locus (Fig 6), these data suggest that epigenetic modifications contribute to the regulation of this key lineage regulator in the developing neocortex.
To corroborate that H3K27me3 levels were indeed altered upon IUE of dCas9‐Ezh2, we performed ChIP‐qPCR in electroporated (PaprikaRFP+) neurogenic (Tis21‐GFP+) NPCs purified by FACS (25,000 cells per condition). H3K27me3 levels were found to be significantly increased around the Eomes TSS (Fig 7A) upon gEomes dCas9‐Ezh2 IUE compared to gLacZ dCas9‐Ezh2 control, but not upon gEomes dCas9‐Ezh2* IUE (Fig 7G). H3K27me3 levels were not increased at the non‐targeted Actb TSS. Thus, the CRISPR/Cas9‐based in vivo epigenome editing system established here achieves targeted deposition of H3K27me3 in NSCs of the embryonic neocortex, opening up avenues to unravel the role of histone methylation at selected loci in the developing brain.
Discussion
The present epigenome data provide insights into the dynamics of histone methylation in the developing mouse neocortex and constitute a resource for future epigenetics studies. Studies of cortical NPCs have long been hampered by the lack of specific markers for the isolation of NPC subpopulations. The recent development of a cell polarity‐based approach (Florio et al, 2015) and technological advances in ChIP‐seq methods from small samples have allowed us to resolve histone methylation differences between various cortical NPC subtypes.
We have used two chromatin features, namely activated ESC‐bivalent domains (Lien et al, 2011) and broad H3K4me3 domains (Benayoun et al, 2014) to identify potential novel regulators of cortical NPCs available for future exploration. It is interesting to note that several chromatin factors (including the PcG proteins Eed and Pcgf2/Bmi1 (Zencak et al, 2005), the H3K4 histone methyltransferase Kmt2d/Mll2, the chromatin remodelers Chd1 and Chd3, the high mobility group protein Hmga1 (Kishi et al, 2012), and the heterochromatin protein Cbx5/Hp1), are among the genes with the broadest H3K4me3 domains, denoting them as central players in neocortical NPC regulation. The importance of the regulation of the epigenome by enzymes modifying H3K27me3 (like EZH2) and H3K4me3 (like MLL2, UTX, and SETD1A) is also highlighted by mutations in the related genes in human patients with neurodevelopmental disorders (Mastrototaro et al, 2017).
Bivalent domains have received much attention as they mark lineage regulators in pluripotent ESCs (Voigt et al, 2013). Subsequent studies have shown that they are also present during development (Vastenhouw et al, 2010) and, at much lower prevalence, in differentiated cells and adult stem cells (Mikkelsen et al, 2007; Voigt et al, 2013). As ChIP‐seq is currently performed on cell populations rather than single cells, the existence of true bivalent domains at single alleles has been questioned. Using different strategies, the presence of bivalent domains has recently been confirmed at individual alleles of key regulatory genes in different cell types (Kinkley et al, 2016; Lorzadeh et al, 2016; Weiner et al, 2016). Although we cannot rule out the presence of H3K4me3 and H3K27me3 in different cells of the population, we have isolated different NPC subpopulations to minimize cellular heterogeneity. We find that a substantial number of genes is marked by bivalent modifications in cortical NPCs and, more strikingly, also in neurons of the developing neocortex. Analysis of neuronal transcriptomes revealed that many of the genes that are bivalent in embryonic neurons are expressed later during postnatal neuron maturation. Thus, our data suggest that the concept of bivalent gene poising in stem and progenitor cells extends to post‐mitotic neurons in the developing neocortex.
During neocortical development, we observed major H3K27me3 re‐arrangements marking two important transitions among NPC types: Firstly, from NECs to aRG, and secondly, from apical to basal RG. NECs and aRG share several cell biological properties: Both exhibit apical–basal polarity and are highly proliferative and their nuclei undergo interkinetic nuclear migration. However, with the transition from NECs to aRG, specific subcellular features change, glial hallmarks appear and progenitor fate becomes more restricted (Götz & Huttner, 2005; Taverna et al, 2014). With the switch to neurogenesis, several tight junction‐associated genes (e.g., several Claudins) acquire a more repressive chromatin configuration, whereas the genes encoding the glial‐specific glutamate transporter (Slc1a3/Glast) and the brain lipid‐binding protein (Fabp7/Blbp) convert to an active chromatin state. Moreover, bRG in mouse were previously shown to be more closely related to neurons than to aRG based on their gene expression profile (Florio et al, 2015), and here, we find that this is mirrored in their genomewide H3K27me3 pattern.
In addition to unidirectional loss and gain of H3K27me3, a number of genes, many of which are neural TFs, transiently decrease H3K27me3 levels among closely related neural cell populations. As these changes likely occur within one cell cycle, it is conceivable that the H3K27me3 mark is actively removed, rather than progressively lost with DNA replication. Notably, the H3K27me3‐specific histone demethylase Jmjd3 has been implicated in the activation of neuronal gene expression (Jepsen et al, 2007; Park et al, 2014).
Previously, it has been shown that ablation of PcG proteins during neurogenesis induces a shift of NPC fate from self‐renewal toward differentiation (Pereira et al, 2010), indicating that PcG proteins and associated marks are involved in directing cell fate decision in the neocortex. Since deletion of PcG proteins affects thousands of downstream target genes, the underlying mechanism has been difficult to elucidate. The dynamic histone methylation profiles at Neurog2 (Hirabayashi et al, 2009) and Eomes, and their role as important triggers of the neuron differentiation program render them excellent candidate genes that may contribute to the observed phenotype. Further support for this hypothesis comes from our epigenome editing experiment, which underscores that dynamic changes in H3K27me3 at the Eomes locus are required for normal neocortex development, and if overruled by forced persistence of H3K27me3 result in phenotypic outcomes observed upon genetic disruption of the locus.
To enable future functional studies of H3K27me3 at individual genes, we have established CRISPR/dCas9‐based epigenome editing in the developing neocortex, using Eomes as a model gene. Remarkably, editing of H3K27me3 at this single locus was found to be sufficient to reduce Tbr2 expression and basal progenitor abundance. On a more general note, the methodology for in vivo histone methylation editing established here can be applied to any genomic locus of interest and can be adapted to other histone marks, opening avenues for functional studies of epigenetics in the developing brain and other organs that are amenable to the delivery of DNA constructs. Importantly, in vivo epigenome editing uniquely allows us to investigate the role of regulatory regions in their native genomic context, and to move from epigenome profiling to understanding epigenome function (Stricker et al, 2017).
Materials and Methods
Mice
All experimental procedures were designed and conducted in agreement with the German Animal Welfare Legislation after approval by the Landesdirektion Sachsen. Animals used for this study were kept specific pathogen‐free at the Biomedical Services Facility (BMS) of the MPI‐CBG. All mice used, wild type, Tis21::GFP knock‐in (Haubensak et al, 2004), and Tubb3‐GFP transgenic (Attardo et al, 2008), were congenic and C57BL/6JOlaHsd. Embryonic day (E) 0.5 was set as noon on the day on which the vaginal plug was observed.
Isolation of defined neural cell populations
Isolation of aRG‐P, aRG‐N, bRG, bIP, and neurons has been previously described in detail (Florio et al, 2015). Briefly, the cerebral hemispheres of E14.5 mouse brains were dissected in cold Tyrode solution and the meninges removed. Each hemisphere was transferred to pre‐warmed (37°C) Tyrode solution and the basal surface of the dorsolateral cortex labeled with DiI (2 mM in DMSO, Molecular Probes). Hemispheres were cultured for 2 h in DMEM/F12 medium supplemented with N2 and B27 (Life Technologies) in a whole‐embryo culture incubator (HERO culture system; Schenk et al, 2009) at 37°C in an atmosphere of 60% O2, 5% CO2, 35% N2, with continuous slow rotation at 8 rpm. Following DiI labeling, the dorsolateral neocortex was dissected and a single cell suspension was produced using the MACS Neural Tissue Dissociation kit containing papain (Miltenyi Biotec). Cell surface staining of Prom1 was performed with rat anti‐13A4‐APC (1:300, eBioscience, #17‐1331‐81) in Tyrode solution for 30 min on ice. Rat IgG1‐APC (1:300, eBioscience, #17‐4301‐81) was used as isotype control. Cells were collected by centrifugation at 300 × g, resuspended in Tyrode solution, and immediately processed by FACS as described (Florio et al, 2015) on a 4‐laser FACS Aria III sorter (Becton Dickinson) and analyzed using the FACS Diva software (Becton Dickinson, v8.0).
NECs were isolated from E9.5 Tis21::GFP embryos. The dorsolateral telencephalon was dissected, a single cell suspension produced and Prom1 staining performed as described for E14.5. Tis21‐GFP‐negative, Prom1‐positive cells were isolated by FACS. At E12.5, aRG‐P and aRG‐N were isolated from Tis21::GFP embryos as described for E14.5, but omitting the DiI labeling procedure.
ChIP‐sequencing
For ChIP‐seq, up to 50,000 cells were sorted into microcentrifuge tubes, filled up to 500 μl with PBS, and fixed in 1% formaldehyde (Sigma) for 10 min while shaking with 700 rpm at room temperature (RT). The reaction was stopped by addition of 50 μl 2 M glycine and incubated for 5 min at RT. To facilitate pelleting of cells, 60 μl fetal bovine serum (FBS) was added (Adli & Bernstein, 2011), and cells were centrifuged at 1,600 × g for 5 min at 4 °C. Cells were washed twice with PBS containing 10% FBS, centrifuged for an additional 1 min to remove residual washing buffer, and resuspended in 30 μl lysis buffer containing 1% SDS, 50 mM Tris–HCl (pH 8.1), 100 mM NaCl, 5 mM EDTA, and protease inhibitors (Complete, Roche). Cells were incubated on ice for 5 min with intermittent brief vortexing. Following brief centrifugation, cell lysates were stored at −80°C until further processing. For ChIP, samples were thawed on ice, combined to yield 50,000 cells per sample, and filled up to 120 μl with lysis buffer. Chromatin was sonicated on a Covaris S2 in microTUBES with AFA Snap cap for 12 min with 2% duty cycle, intensity of 3, 200 cycles per burst using frequency sweeping as power mode and continuous degassing at 4°C. Sonicated chromatin was transferred to Low‐DNA‐binding tubes (Eppendorf). ChIP was performed using the LowCell ChIP kit (Diagenode) according to manufacturer's instructions. For each ChIP, 1 μl of the following antibodies was used: anti‐H3K4me3 (Cell Signaling, 9751S) and anti‐H3K27me3 (Cell Signaling, 9733S). Pooled input samples from all cell types were used as control (two replicates). For ChIP‐seq, DNA was purified using the IPure kit (Diagenode) according to manufacturer's instructions. DNA was subjected to NGS library preparation using the MicroPlex Template Preparation Kit from Diagenode. In brief, DNA was end‐repaired and universal adapters were ligated. Afterward, the libraries were indexed in the following PCR enrichment step. After bead‐based purification (1× XP Beads, Beckman Coulter), the libraries were size‐selected on a 2% E‐Gel (Invitrogen), again purified (MinElute Gel Purification Kit, Qiagen), and quantified by quantitative PCR (KAPA Biosystems). All libraries were equimolarly pooled and subjected to Illumina 75‐bp single end sequencing resulting in on average 37.2 Mio reads.
ChIP‐seq analysis
High‐quality ChIP‐seq reads were tested using fastqc and aligned to the mouse genome (mm9) with bowtie (Langmead et al, 2009). Only uniquely mapping best reads (‐best ‐m 1) were reported. Alignment duplicates were removed with picardtools markDuplicates. Peaks were called using MACS2 (Zhang et al, 2008) with “default” parameters for H3K4me3 and the “broad” peak option for H3K27me3 (see https://github.com/taoliu/MACS). Replicates were pooled before calling peaks (see https://github.com/taoliu/MACS). The cutoff to call significant regions was based on a q‐value of 0.05 for both modifications. q‐values were calculated from p‐values using the Benjamini–Hochberg procedure. Significant peaks were annotated (ChIPpeakAnno R/Bioconductor; Zhu et al, 2010) using Ensembl genes v67 as reference. Peaks overlapping ± 2 kb of the TSS (narrow, H3K4me3) or the gene body (broad, H3K27me3) were assigned to a gene. Enrichment of histone methylation around genes was plotted using ngs.plot (Shen et al, 2014). The ChIP‐seq tracks were visualized using the UCSC genome browser with a vertical viewing range of 0 (min) to 10 (max). For viewing purposes, samples were normalized using a scaling factor for generation of bigwig files calculated based on the average peak height (determined by ngs.plot) of all H3K4me3 or H3K27me3 peaks called in a sample, respectively. For comparative reasons, published whole‐brain E14.5 H3K4me3 (wgEncodeEM002493) and H3K27me3 (wgEncodeEM002725) data were downloaded from ENCODE/LICR using the UCSC genome browser.
The genes that were previously identified to be bivalent in mouse ESC (Mikkelsen et al, 2007; Mohn et al, 2008) were analyzed for the percentage of H3K4me3, H3K27me3, and bivalency in the defined neural cell populations. The given numbers represent cumulative percentages, taking only initial histone methylation changes into account. Functional annotation clustering of genes was performed using PANTHER version 11.1 (http://www.pantherdb.org/) by selecting the “Statistical over‐representation test” with default settings, which is based on “PANTHER GO‐slim” terms for “biological processes”. For the analysis of genes with dynamic H3K27me3 (n = 50 genes), “GO biological process complete” was used. The statistical analysis of GO enrichment included a Bonferroni correction for multiple testing.
For H3K4me3 breadth analysis, the peaks were sorted based on the peak width and the distribution of the peak width was then plotted. For functional enrichment of cell type‐specific genes lists, seven custom gene sets were compiled: “ESC regulators”, “NPC regulators”, “Neuron differentiation”, “Embryonic”, “Heart”, “Muscle” and “Spermatogenesis” (see Dataset EV6 for details). These gene sets were compared to the list of genes with broad H3K4me3 peaks binned into 5% quantiles to test for over‐representation using Fisher exact probabilities (Fleiss, 1981) calculated using R. Networks of genes with cell type‐specific broad H3K4me3 domains were analyzed using the GeneMANIA Cytospace plugin (Montojo et al, 2010). Transcriptional consistency was assessed as previously described (Benayoun et al, 2014), using RNA‐seq data sets with four or five replicates. To eliminate biases in the magnitude of variance due to differences in absolute expression levels, gene expression was scaled to mean expression levels.
Principal component analysis (PCA) was performed with the spearman correlation coefficients obtained from the bamcorrelate program (Ramirez et al, 2014) using stats::prcomp in R. To assess dynamic changes in H3K27me3 levels at E14.5, enrichment scores were calculated as follows: The number of raw reads mapping within ± 2 kb of the TSS (Ensembl genes v67) were counted (bedtools intersectbed) for all genes. The enrichment scores were calculated as the ratio of the fraction of reads mapping to a TSS region in the sample to the fraction of reads mapping in the input sample, expressed as log2 (Pataskar et al, 2016). For calculating the fraction of reads, the raw reads mapping in a TSS region were divided by the total number of reads mapping to all TSS in a sample. Genes with dynamic H3K27me3 decrease were filtered using the following criteria: significant MACS2 peak in aRG‐P and N, enrichment score of > 0.5 in aRG‐P and N, and a > 1.5‐fold decrease in the enrichment score from aRG‐P to aRG‐N. ChIP‐seq raw data, bigwig files, and bed files with peak locations have been deposited with the Gene Expression Omnibus under the accession code GSE90694.
ChIP‐qPCR
For ChIP‐qPCR, 50,000 cells (Fig 6) or 25,000 cells (Fig 7) were sorted into microcentrifuge tubes. ChIP was performed as described above. ChIP with IgG (Abcam, ab46540) was used as control. DNA was isolated by adding 1 μl proteinase K per 100 μl of DIB buffer (Diagenode), incubation at 55°C for 15 min followed by 15 min at 100°C, and centrifugation at 14,000 g for 5 min at 4°C. For analysis of histone methylation in neural subpopulations (Fig 6), qPCR was performed using the ABsolute qPCR SYBR Green mix (Thermo Scientific) on an Mx3000P qPCR system (Agilent Technologies). Error bars represent SD of three qPCR amplifications. Similar results were obtained in two independent experiments. For analysis of H3K27me3 levels following IUE, qPCR was performed using Light Cycler SYBR green Master mix (Roche) on a Light Cycler 96 (Roche). Error bars represent SD of four biological experiments. Primer sequences are provided in Dataset EV7.
Gene expression analysis by RNA‐sequencing
RNA‐sequencing of NECs has been performed as previously described (Florio et al, 2015). For each replicate (n = 5), 5,000 NECs were sorted into microcentrifuge tubes filled with 200 μl of RLT lysis buffer (Qiagen) containing 2 μl of beta‐mercaptoethanol (Sigma), and stored at −80°C until further processing. Total RNA was extracted using the RNeasy Mini kit (Qiagen) according to manufacturer's instructions. Complete cDNA was synthesized from half of the isolated mRNA with SmartScribe reverse transcriptase (Clontech) using a universally tailed poly‐dT primer and template switching oligos. This was followed by amplification of the purified cDNA with the Advantage 2 DNA Polymerase (12 cycles). After ultrasonic shearing of the amplified cDNA (Covaris S2), samples were subjected to standard Illumina fragment library preparation using the NEBnext chemistries (New England Biolabs). In brief, fragments were end‐repaired, A‐tailed, and ligated to indexed Illumina TruSeq adapters. Subsequently, the NGS libraries were finalized by a universally primed PCR amplification (15 cycles). Libraries were purified using XP beads (Beckman Coulter), quantified by qPCR (KAPA Biosystems), and subjected to Illumina 75‐bp single end sequencing on the Illumina HiSeq 2000 platform providing on average 35 Mio reads per sample.
RNA‐seq data analysis
RNA‐seq analysis has been previously described (Florio et al, 2015). Reads of the same sample on different sequencing lanes were combined and subjected to adapter trimming using cutadapt. The processed reads were aligned to the mouse reference genome (mm10) using TopHat (v2.0.11). Genes of the Ensembl release 61 were quantified using cufflinks v0.9.3, with the resulting RNA‐seq data being expressed as FPKM values. Differential expression analysis was performed using cuffdiff (v2.2.1) with FPKM values as data input, and using all protein‐coding genes as transcriptome reference. This analysis was performed for the sum of all transcripts present for any given gene, and it was not distinguished between different transcripts (splice variants). Expressed genes were defined using a cutoff of FPKM > 1. Differentially expressed genes were defined using a cutoff of p < 0.01. Functional annotation clustering of genes was performed using DAVID (http://david.abcc.ncifcrf.gov), with default settings. RNA‐seq data for NECs has been deposited with the Gene Expression Omnibus under accession code GSE90447.
Gene expression analysis by RT–qPCR
For RT–qPCR, 2,000–5,000 cells were sorted into microcentrifuge tubes filled with 200 μl of RLT lysis buffer (Qiagen) containing 2 μl of beta‐mercaptoethanol (Sigma), and stored at −80°C until further processing. Total RNA was isolated using the RNeasy Mini kit (Qiagen) according to the manufacturer's instructions. cDNA was synthesized using random hexamers and Superscript III Reverse Transcriptase (Life Technologies). qPCR was performed using the ABsolute qPCR SYBR Green mix (Thermo Scientific) on an Mx3000P qPCR system (Agilent Technologies). Gene expression data were normalized based on the housekeeping gene Gapdh, which was expressed at comparable levels in the isolated cell populations (Florio et al, 2015). Primer sequences are provided in Dataset EV7.
Constructs for epigenome editing
Previously published gRNA for LacZ (5′‐TGCGAATACGCCCACGCGATCGG; underlined nucleotides, PAM) was used as control (Platt et al, 2014; Kalebic et al, 2016). The genomic sequence of the two CpG islands flanking the mouse Eomes TSS was analyzed for CRISPR/Cas9 target sites by Geneious 8.1.6 software (Biomatters), and three gRNAs targeting each CpG island were selected (see Dataset EV7 for gRNA sequences). All six gRNAs were tested for their cleavage efficiency in vitro, and one gRNA each targeting the upstream and targeting the downstream CpG island selected for in vivo use. Custom‐made plasmids containing a single gRNA under the control of the human U6 promoter followed by dCas9‐Ezh2‐T2A‐PaprikaRFP under the CAG promoter were obtained commercially (DNA 2.0). The proteolytic self‐cleavage 2A peptide from Thosea asigna virus (T2A) released PaprikaRFP, which was used as a marker of Cas9 expression. Cas9 was flanked with two nuclear localization signals. The dCas9‐Ezh2*‐T2A‐PaprikaRFP constructs with a catalytically inactive SET domain were generated by mutagenesis from the dCas9‐Ezh2‐T2A‐PaprikaRFP constructs using KOD plus polymerase (Toyobo) followed by DpnI (NEB) digest (see Dataset EV7 for primer sequences).
In vitro testing of Eomes gRNA efficiency
Individual gRNAs were first tested in vitro for their efficiency to target the selected locus using recombinant Cas9 protein and a PCR product (see Dataset EV7 for primer sequences) with the ToolGen kit according to manufacturer's instructions, as previously described (Kalebic et al, 2016). Briefly, an in vitro reaction contained 12 ng/μl of the PCR product, 50 ng/μl of recombinant Cas9 protein and 35 ng/μl of the indicated in vitro‐transcribed gRNA, in a total volume of 10 μl. Reactions were carried out at 37°C for 1 h. Samples were then treated with 4 μg of RNase (Qiagen) for 15 min at 37°C, followed by addition of 2.5 μg of proteinase K (Merck) and further incubation for 10 min at 55°C. After 5 min at room temperature, samples received 1 μl of STOP solution (30% glycerol, 1.2% SDS, 250 mM EDTA pH 8.0; ToolGen) and were incubated for further 15 min at 37°C, followed by analysis on a 1% agarose gel.
In utero electroporations of dCas9‐Ezh2 constructs
IUEs were performed as previously described (Kalebic et al, 2016). Briefly, E13.5 mouse embryos were anesthetized with isoflurane and subsequently injected subcutaneously with an analgesic. The peritoneal cavity was then surgically opened and the uterus exposed. Embryos were injected intraventricularly with a solution containing 0.1% Fast Green (Sigma) in sterile PBS, containing 2.5 μg/μl of the gLacZ or 2.5 μg/μl of the two gEomes dCas9‐Ezh2‐T2A‐PaprikaRFP or dCas9‐Ezh2*‐T2A‐PaprikaRFP mutant plasmids. Electroporations were performed with six 50‐ms pulses of 28–33 V at 1‐s intervals. Embryos were harvested 48 h post‐electroporation, and PFA‐fixed for IHC analysis, or dissected for cell isolation followed by FAC‐sorting and ChIP analysis. For IUE, an independent experiment was considered to be a separate litter. For all IHC analyses, at least one embryo per condition was analyzed from each litter. For each condition, data from one experiment were pooled and the mean of the indicated number of experiments was calculated.
Immunohistochemistry
Immunohistochemistry was performed on 25‐μm cryosections as previously described (Florio et al, 2015; Kalebic et al, 2016). Antibodies used were rabbit pAb anti‐Tbr2 (Abcam, ab23345), rat pAb anti‐phospho‐histone (Abcam, ab10543), and chicken pAb anti‐Tbr2 (Millipore, AB15894). The secondary antibodies used were coupled to Alexa Fluor 488, 555, or 647 and were from donkey (Invitrogen). DNA staining was performed with DAPI (Sigma). PaprikaRFP direct fluorescence was detected without antibody staining. All images were acquired using a Zeiss LSM 880 Airy upright laser scanning confocal microscope. Images were analyzed and processed with ImageJ (http://imagej.nih.gov/ij/). All cell counts were performed in standardized microscopic fields (150 × 200 μm for Fig 7D, and 150 × 250 μm for Fig 7F), processed using Excel (Microsoft), and plotted using Prism (GraphPad software).
Author contributions
MA conceptualized the study, performed most experiments, and analyzed data. NK performed IUE and analyzed IHC data. MF provided advice on cell isolation and analyzed transcriptome data. NL, HB, and IH analyzed transcriptome and ChIP‐seq data. CH performed IHC and RT–qPCR. MA and WBH wrote the manuscript with input from NK and MF, and WBH supervised the project.
Conflict of interest
The authors declare that they have no conflict of interest.
Supporting information
Appendix
Dataset EV1
Dataset EV2
Dataset EV3
Dataset EV4
Dataset EV5
Dataset EV6
Dataset EV7
Review Process File
Acknowledgements
We are grateful to the Services and Facilities of the MPI‐CBG for the outstanding support provided, notably J. Helppi and his team of the Biomedical Services Facility, M. Sarov and D. Olbert of the Genome Engineering Facility, J. Peychl and his team of the Light Microscopy Facility, and I. Nuesslein, J. Jarrells, E. Guhr, and A. Eugster Oegema for support with FACS. NGS work was performed by the Deep Sequencing Group of the SFB 655 at the Biotechnology Center of the Technische Universität Dresden. We thank all members of the Huttner laboratory for help and discussion, and K. Long, M. Krause, and N.L. Vastenhouw for critical reading of the manuscript. M.A. acknowledges support from the Christiane Nüsslein‐Volhard Foundation. N.K. was supported by an EMBO longterm fellowship (ALTF 861‐2013). W.B.H. was supported by grants from the DFG (SFB 655, A2) and the ERC (250197), by the DFG‐funded Center for Regenerative Therapies Dresden, and by the Fonds der Chemischen Industrie.
The EMBO Journal (2017) 36: 2642–2658
Contributor Information
Mareike Albert, Email: albert@mpi-cbg.de.
Wieland B Huttner, Email: huttner@mpi-cbg.de.
References
- Adli M, Bernstein BE (2011) Whole‐genome chromatin profiling from limited numbers of cells using nano‐ChIP‐seq. Nat Protoc 6: 1656–1668 [DOI] [PMC free article] [PubMed] [Google Scholar]
- Aprea J, Prenninger S, Dori M, Ghosh T, Monasor LS, Wessendorf E, Zocher S, Massalini S, Alexopoulou D, Lesche M, Dahl A, Groszer M, Hiller M, Calegari F (2013) Transcriptome sequencing during mouse brain development identifies long non‐coding RNAs functionally involved in neurogenic commitment. EMBO J 32: 3145–3160 [DOI] [PMC free article] [PubMed] [Google Scholar]
- Arcila ML, Betizeau M, Cambronne XA, Guzman E, Doerflinger N, Bouhallier F, Zhou H, Wu B, Rani N, Bassett DS, Borello U, Huissoud C, Goodman RH, Dehay C, Kosik KS (2014) Novel primate miRNAs coevolved with ancient target genes in germinal zone‐specific expression patterns. Neuron 81: 1255–1262 [DOI] [PMC free article] [PubMed] [Google Scholar]
- Arnold SJ, Huang GJ, Cheung AF, Era T, Nishikawa S, Bikoff EK, Molnar Z, Robertson EJ, Groszer M (2008) The T‐box transcription factor Eomes/Tbr2 regulates neurogenesis in the cortical subventricular zone. Genes Dev 22: 2479–2484 [DOI] [PMC free article] [PubMed] [Google Scholar]
- Attardo A, Calegari F, Haubensak W, Wilsch‐Bräuninger M, Huttner WB (2008) Live imaging at the onset of cortical neurogenesis reveals differential appearance of the neuronal phenotype in apical versus basal progenitor progeny. PLoS ONE 3: e2388 [DOI] [PMC free article] [PubMed] [Google Scholar]
- Benayoun BA, Pollina EA, Ucar D, Mahmoudi S, Karra K, Wong ED, Devarajan K, Daugherty AC, Kundaje AB, Mancini E, Hitz BC, Gupta R, Rando TA, Baker JC, Snyder MP, Cherry JM, Brunet A (2014) H3K4me3 breadth is linked to cell identity and transcriptional consistency. Cell 158: 673–688 [DOI] [PMC free article] [PubMed] [Google Scholar]
- Bernstein BE, Mikkelsen TS, Xie X, Kamal M, Huebert DJ, Cuff J, Fry B, Meissner A, Wernig M, Plath K, Jaenisch R, Wagschal A, Feil R, Schreiber SL, Lander ES (2006) A bivalent chromatin structure marks key developmental genes in embryonic stem cells. Cell 125: 315–326 [DOI] [PubMed] [Google Scholar]
- Borrell V, Reillo I (2012) Emerging roles of neural stem cells in cerebral cortex development and evolution. Dev Neurobiol 72: 955–971 [DOI] [PubMed] [Google Scholar]
- Burney MJ, Johnston C, Wong KY, Teng SW, Beglopoulos V, Stanton LW, Williams BP, Bithell A, Buckley NJ (2013) An epigenetic signature of developmental potential in neural stem cells and early neurons. Stem Cells 31: 1868–1880 [DOI] [PubMed] [Google Scholar]
- Comet I, Riising EM, Leblanc B, Helin K (2016) Maintaining cell identity: PRC2‐mediated regulation of transcription and cancer. Nat Rev Cancer 16: 803–810 [DOI] [PubMed] [Google Scholar]
- Egan CM, Nyman U, Skotte J, Streubel G, Turner S, O'Connell DJ, Rraklli V, Dolan MJ, Chadderton N, Hansen K, Farrar GJ, Helin K, Holmberg J, Bracken AP (2013) CHD5 is required for neurogenesis and has a dual role in facilitating gene expression and polycomb gene repression. Dev Cell 26: 223–236 [DOI] [PubMed] [Google Scholar]
- Fan G, Martinowich K, Chin MH, He F, Fouse SD, Hutnick L, Hattori D, Ge W, Shen Y, Wu H, ten Hoeve J, Shuai K, Sun YE (2005) DNA methylation controls the timing of astrogliogenesis through regulation of JAK‐STAT signaling. Development 132: 3345–3356 [DOI] [PubMed] [Google Scholar]
- Fleiss JL (1981) Statistical methods for rates and proportions. New York: John Wiley; [Google Scholar]
- Florio M, Huttner WB (2014) Neural progenitors, neurogenesis and the evolution of the neocortex. Development 141: 2182–2194 [DOI] [PubMed] [Google Scholar]
- Florio M, Albert M, Taverna E, Namba T, Brandl H, Lewitus E, Haffner C, Sykes A, Wong FK, Peters J, Guhr E, Klemroth S, Prufer K, Kelso J, Naumann R, Nusslein I, Dahl A, Lachmann R, Paabo S, Huttner WB (2015) Human‐specific gene ARHGAP11B promotes basal progenitor amplification and neocortex expansion. Science 347: 1465–1470 [DOI] [PubMed] [Google Scholar]
- Florio M, Borrell V, Huttner WB (2016) Human‐specific genomic signatures of neocortical expansion. Curr Opin Neurobiol 42: 33–44 [DOI] [PubMed] [Google Scholar]
- Götz M, Huttner WB (2005) The cell biology of neurogenesis. Nat Rev Mol Cell Biol 6: 777–788 [DOI] [PubMed] [Google Scholar]
- Hatada I, Namihira M, Morita S, Kimura M, Horii T, Nakashima K (2008) Astrocyte‐specific genes are generally demethylated in neural precursor cells prior to astrocytic differentiation. PLoS ONE 3: e3189 [DOI] [PMC free article] [PubMed] [Google Scholar]
- Haubensak W, Attardo A, Denk W, Huttner WB (2004) Neurons arise in the basal neuroepithelium of the early mammalian telencephalon: a major site of neurogenesis. Proc Natl Acad Sci USA 101: 3196–3201 [DOI] [PMC free article] [PubMed] [Google Scholar]
- Hirabayashi Y, Suzki N, Tsuboi M, Endo TA, Toyoda T, Shinga J, Koseki H, Vidal M, Gotoh Y (2009) Polycomb limits the neurogenic competence of neural precursor cells to promote astrogenic fate transition. Neuron 63: 600–613 [DOI] [PubMed] [Google Scholar]
- Jepsen K, Solum D, Zhou T, McEvilly RJ, Kim HJ, Glass CK, Hermanson O, Rosenfeld MG (2007) SMRT‐mediated repression of an H3K27 demethylase in progression from neural stem cell to neuron. Nature 450: 415–419 [DOI] [PubMed] [Google Scholar]
- Kalebic N, Taverna E, Tavano S, Wong FK, Suchold D, Winkler S, Huttner WB, Sarov M (2016) CRISPR/Cas9‐induced disruption of gene expression in mouse embryonic brain and single neural stem cells in vivo . EMBO Rep 17: 338–348 [DOI] [PMC free article] [PubMed] [Google Scholar]
- Kearns NA, Pham H, Tabak B, Genga RM, Silverstein NJ, Garber M, Maehr R (2015) Functional annotation of native enhancers with a Cas9‐histone demethylase fusion. Nat Methods 12: 401–403 [DOI] [PMC free article] [PubMed] [Google Scholar]
- Kinkley S, Helmuth J, Polansky JK, Dunkel I, Gasparoni G, Frohler S, Chen W, Walter J, Hamann A, Chung HR (2016) reChIP‐seq reveals widespread bivalency of H3K4me3 and H3K27me3 in CD4(+) memory T cells. Nat Commun 7: 12514 [DOI] [PMC free article] [PubMed] [Google Scholar]
- Kishi Y, Fujii Y, Hirabayashi Y, Gotoh Y (2012) HMGA regulates the global chromatin state and neurogenic potential in neocortical precursor cells. Nat Neurosci 15: 1127–1133 [DOI] [PubMed] [Google Scholar]
- Langmead B, Trapnell C, Pop M, Salzberg SL (2009) Ultrafast and memory‐efficient alignment of short DNA sequences to the human genome. Genome Biol 10: R25 [DOI] [PMC free article] [PubMed] [Google Scholar]
- Lien WH, Guo X, Polak L, Lawton LN, Young RA, Zheng D, Fuchs E (2011) Genome‐wide maps of histone modifications unwind in vivo chromatin states of the hair follicle lineage. Cell Stem Cell 9: 219–232 [DOI] [PMC free article] [PubMed] [Google Scholar]
- Liu XS, Wu H, Ji X, Stelzer Y, Wu X, Czauderna S, Shu J, Dadon D, Young RA, Jaenisch R (2016) Editing DNA methylation in the mammalian genome. Cell 167: 233–247 [DOI] [PMC free article] [PubMed] [Google Scholar]
- Lorzadeh A, Bilenky M, Hammond C, Knapp DJ, Li L, Miller PH, Carles A, Heravi‐Moussavi A, Gakkhar S, Moksa M, Eaves CJ, Hirst M (2016) Nucleosome density ChIP‐seq identifies distinct chromatin modification signatures associated with MNase accessibility. Cell Rep 17: 2112–2124 [DOI] [PubMed] [Google Scholar]
- Lui JH, Hansen DV, Kriegstein AR (2011) Development and evolution of the human neocortex. Cell 146: 18–36 [DOI] [PMC free article] [PubMed] [Google Scholar]
- Mastrototaro G, Zaghi M, Sessa A (2017) Epigenetic mistakes in neurodevelopmental disorders. J Mol Neurosci 61: 590–602 [DOI] [PubMed] [Google Scholar]
- Mendenhall EM, Koche RP, Truong T, Zhou VW, Issac B, Chi AS, Ku M, Bernstein BE (2010) GC‐rich sequence elements recruit PRC2 in mammalian ES cells. PLoS Genet 6: e1001244 [DOI] [PMC free article] [PubMed] [Google Scholar]
- Mikkelsen TS, Ku M, Jaffe DB, Issac B, Lieberman E, Giannoukos G, Alvarez P, Brockman W, Kim TK, Koche RP, Lee W, Mendenhall E, O'Donovan A, Presser A, Russ C, Xie X, Meissner A, Wernig M, Jaenisch R, Nusbaum C et al (2007) Genome‐wide maps of chromatin state in pluripotent and lineage‐committed cells. Nature 448: 553–560 [DOI] [PMC free article] [PubMed] [Google Scholar]
- Mohn F, Weber M, Rebhan M, Roloff TC, Richter J, Stadler MB, Bibel M, Schubeler D (2008) Lineage‐specific polycomb targets and de novo DNA methylation define restriction and potential of neuronal progenitors. Mol Cell 30: 755–766 [DOI] [PubMed] [Google Scholar]
- Molyneaux BJ, Goff LA, Brettler AC, Chen HH, Brown JR, Hrvatin S, Rinn JL, Arlotta P (2015) DeCoN: genome‐wide analysis of in vivo transcriptional dynamics during pyramidal neuron fate selection in neocortex. Neuron 85: 275–288 [DOI] [PMC free article] [PubMed] [Google Scholar]
- Montojo J, Zuberi K, Rodriguez H, Kazi F, Wright G, Donaldson SL, Morris Q, Bader GD (2010) GeneMANIA cytoscape plugin: fast gene function predictions on the desktop. Bioinformatics 26: 2927–2928 [DOI] [PMC free article] [PubMed] [Google Scholar]
- Morimoto‐Suzki N, Hirabayashi Y, Tyssowski K, Shinga J, Vidal M, Koseki H, Gotoh Y (2014) The polycomb component Ring1B regulates the timed termination of subcerebral projection neuron production during mouse neocortical development. Development 141: 4343–4353 [DOI] [PubMed] [Google Scholar]
- Morita S, Noguchi H, Horii T, Nakabayashi K, Kimura M, Okamura K, Sakai A, Nakashima H, Hata K, Nakashima K, Hatada I (2016) Targeted DNA demethylation in vivo using dCas9‐peptide repeat and scFv‐TET1 catalytic domain fusions. Nat Biotechnol 34: 1060–1065 [DOI] [PubMed] [Google Scholar]
- Muller J, Hart CM, Francis NJ, Vargas ML, Sengupta A, Wild B, Miller EL, O'Connor MB, Kingston RE, Simon JA (2002) Histone methyltransferase activity of a Drosophila Polycomb group repressor complex. Cell 111: 197–208 [DOI] [PubMed] [Google Scholar]
- Park DH, Hong SJ, Salinas RD, Liu SJ, Sun SW, Sgualdino J, Testa G, Matzuk MM, Iwamori N, Lim DA (2014) Activation of neuronal gene expression by the JMJD3 demethylase is required for postnatal and adult brain neurogenesis. Cell Rep 8: 1290–1299 [DOI] [PMC free article] [PubMed] [Google Scholar]
- Pataskar A, Jung J, Smialowski P, Noack F, Calegari F, Straub T, Tiwari VK (2016) NeuroD1 reprograms chromatin and transcription factor landscapes to induce the neuronal program. EMBO J 35: 24–45 [DOI] [PMC free article] [PubMed] [Google Scholar]
- Pereira JD, Sansom SN, Smith J, Dobenecker MW, Tarakhovsky A, Livesey FJ (2010) Ezh2, the histone methyltransferase of PRC2, regulates the balance between self‐renewal and differentiation in the cerebral cortex. Proc Natl Acad Sci USA 107: 15957–15962 [DOI] [PMC free article] [PubMed] [Google Scholar]
- Platt RJ, Chen S, Zhou Y, Yim MJ, Swiech L, Kempton HR, Dahlman JE, Parnas O, Eisenhaure TM, Jovanovic M, Graham DB, Jhunjhunwala S, Heidenreich M, Xavier RJ, Langer R, Anderson DG, Hacohen N, Regev A, Feng G, Sharp PA et al (2014) CRISPR‐Cas9 knockin mice for genome editing and cancer modeling. Cell 159: 440–455 [DOI] [PMC free article] [PubMed] [Google Scholar]
- Qi LS, Larson MH, Gilbert LA, Doudna JA, Weissman JS, Arkin AP, Lim WA (2013) Repurposing CRISPR as an RNA‐guided platform for sequence‐specific control of gene expression. Cell 152: 1173–1183 [DOI] [PMC free article] [PubMed] [Google Scholar]
- Ramirez F, Dundar F, Diehl S, Gruning BA, Manke T (2014) DeepTools: a flexible platform for exploring deep‐sequencing data. Nucleic Acids Res 42: W187–W191 [DOI] [PMC free article] [PubMed] [Google Scholar]
- Riising EM, Comet I, Leblanc B, Wu X, Johansen JV, Helin K (2014) Gene silencing triggers polycomb repressive complex 2 recruitment to CpG islands genome wide. Mol Cell 55: 347–360 [DOI] [PubMed] [Google Scholar]
- Schenk J, Wilsch‐Bräuninger M, Calegari F, Huttner WB (2009) Myosin II is required for interkinetic nuclear migration of neural progenitors. Proc Natl Acad Sci USA 106: 16487–16492 [DOI] [PMC free article] [PubMed] [Google Scholar]
- Schubeler D, MacAlpine DM, Scalzo D, Wirbelauer C, Kooperberg C, van Leeuwen F, Gottschling DE, O'Neill LP, Turner BM, Delrow J, Bell SP, Groudine M (2004) The histone modification pattern of active genes revealed through genome‐wide chromatin analysis of a higher eukaryote. Genes Dev 18: 1263–1271 [DOI] [PMC free article] [PubMed] [Google Scholar]
- Sessa A, Mao CA, Hadjantonakis AK, Klein WH, Broccoli V (2008) Tbr2 directs conversion of radial glia into basal precursors and guides neuronal amplification by indirect neurogenesis in the developing neocortex. Neuron 60: 56–69 [DOI] [PMC free article] [PubMed] [Google Scholar]
- Shen L, Shao N, Liu X, Nestler E (2014) ngs.plot: quick mining and visualization of next‐generation sequencing data by integrating genomic databases. BMC Genom 15: 284 [DOI] [PMC free article] [PubMed] [Google Scholar]
- Silver DL (2016) Genomic divergence and brain evolution: how regulatory DNA influences development of the cerebral cortex. BioEssays 38: 162–171 [DOI] [PMC free article] [PubMed] [Google Scholar]
- Sparmann A, Xie Y, Verhoeven E, Vermeulen M, Lancini C, Gargiulo G, Hulsman D, Mann M, Knoblich JA, van Lohuizen M (2013) The chromodomain helicase Chd4 is required for Polycomb‐mediated inhibition of astroglial differentiation. EMBO J 32: 1598–1612 [DOI] [PMC free article] [PubMed] [Google Scholar]
- Stricker SH, Koferle A, Beck S (2017) From profiles to function in epigenomics. Nat Rev Genet 18: 51–66 [DOI] [PubMed] [Google Scholar]
- Taverna E, Götz M, Huttner WB (2014) The cell biology of neurogenesis: toward an understanding of the development and evolution of the neocortex. Annu Rev Cell Dev Biol 30: 465–502 [DOI] [PubMed] [Google Scholar]
- Thakore PI, Black JB, Hilton IB, Gersbach CA (2016) Editing the epigenome: technologies for programmable transcription and epigenetic modulation. Nat Methods 13: 127–137 [DOI] [PMC free article] [PubMed] [Google Scholar]
- Vastenhouw NL, Zhang Y, Woods IG, Imam F, Regev A, Liu XS, Rinn J, Schier AF (2010) Chromatin signature of embryonic pluripotency is established during genome activation. Nature 464: 922–926 [DOI] [PMC free article] [PubMed] [Google Scholar]
- Voigt P, Tee WW, Reinberg D (2013) A double take on bivalent promoters. Genes Dev 27: 1318–1338 [DOI] [PMC free article] [PubMed] [Google Scholar]
- Weiner A, Lara‐Astiaso D, Krupalnik V, Gafni O, David E, Winter DR, Hanna JH, Amit I (2016) Co‐ChIP enables genome‐wide mapping of histone mark co‐occurrence at single‐molecule resolution. Nat Biotechnol 34: 953–961 [DOI] [PubMed] [Google Scholar]
- Zencak D, Lingbeek M, Kostic C, Tekaya M, Tanger E, Hornfeld D, Jaquet M, Munier FL, Schorderet DF, van Lohuizen M, Arsenijevic Y (2005) Bmi1 loss produces an increase in astroglial cells and a decrease in neural stem cell population and proliferation. J Neurosci 25: 5774–5783 [DOI] [PMC free article] [PubMed] [Google Scholar]
- Zhang Y, Liu T, Meyer CA, Eeckhoute J, Johnson DS, Bernstein BE, Nusbaum C, Myers RM, Brown M, Li W, Liu XS (2008) Model‐based analysis of ChIP‐Seq (MACS). Genome Biol 9: R137 [DOI] [PMC free article] [PubMed] [Google Scholar]
- Zhu LJ, Gazin C, Lawson ND, Pages H, Lin SM, Lapointe DS, Green MR (2010) ChIPpeakAnno: a bioconductor package to annotate ChIP‐seq and ChIP‐chip data. BMC Bioinformatics 11: 237 [DOI] [PMC free article] [PubMed] [Google Scholar]
Associated Data
This section collects any data citations, data availability statements, or supplementary materials included in this article.
Supplementary Materials
Appendix
Dataset EV1
Dataset EV2
Dataset EV3
Dataset EV4
Dataset EV5
Dataset EV6
Dataset EV7
Review Process File