

Abstract
Little is known about the extent to which pathogenic factors drive the development of Alzheimer's disease (AD) at different stages of the long preclinical and clinical phases. Given that the aggregation of the β‐amyloid peptide (Aβ) is an important factor in AD pathogenesis, we asked whether Aβ seeds from brain extracts of mice at different stages of amyloid deposition differ in their biological activity. Specifically, we assessed the effect of age on Aβ seeding activity in two mouse models of cerebral Aβ amyloidosis (APPPS1 and APP23) with different ages of onset and rates of progression of Aβ deposition. Brain extracts from these mice were serially diluted and inoculated into host mice. Strikingly, the seeding activity (seeding dose SD 50) in extracts from donor mice of both models reached a plateau relatively early in the amyloidogenic process. When normalized to total brain Aβ, the resulting specific seeding activity sharply peaked at the initial phase of Aβ deposition, which in turn is characterized by a temporary several‐fold increase in the Aβ42/Aβ40 ratio. At all stages, the specific seeding activity of the APPPS1 extract was higher compared to that of APP23 brain extract, consistent with a more important contribution of Aβ42 than Aβ40 to seed activity. Our findings indicate that the Aβ seeding potency is greatest early in the pathogenic cascade and diminishes as Aβ increasingly accumulates in brain. The present results provide experimental support for directing anti‐Aβ therapeutics to the earliest stage of the pathogenic cascade, preferably before the onset of amyloid deposition.
Keywords: Alzheimer, amyloid, Aβ, bioassay, seeding
Subject Categories: Molecular Biology of Disease, Neuroscience
Introduction
The accumulation of amyloid in the brain parenchyma and vasculature is a defining histopathological feature of Alzheimer's disease (AD) that begins at least a decade before clinical symptoms appear 1, 2, 3. In the AD brain, amyloid consists mainly of β‐sheet‐rich amyloid‐β peptide (Aβ), a cleavage product of the Aβ precursor protein (APP). Aβ is generated in various lengths, with the majority ending at amino acid 40 or 42 (Aβ40 and Aβ42, respectively), and the ratio of these two isoforms influences their pathobiology 4 as well as the disease phenotype 5, 6, 7.
The misfolding and aggregation of Aβ is thought to follow a prion‐like seeding mechanism 8. In vitro, Aβ self‐assembles into small nuclei (slow nucleation phase), which in turn act as corruptive templates (seeds) to incite a chain reaction of protein misfolding and multimerization. The subsequent aggregation then yields polymeric fibrils (rapid growth phase) that are typical of amyloid 8, 9. In vivo studies suggest that a similar seeding mechanism drives cerebral β‐amyloidosis 10. Injection of Aβ‐rich brain extracts or synthetic, pre‐aggregated Aβ initiates and accelerates Aβ plaque deposition in APP transgenic (tg) mice 11, 12, 13, 14.
Given the importance of Aβ seeds in the initiation and progression of the amyloid cascade, we asked whether Aβ from brain extracts of mice at different stages of the disease process differs in its seeding activity. Surprisingly, in two mouse models of cerebral β‐amyloidosis, we found that the seeding potency per Aβ molecule (specific seeding activity) is greatest early in the pathogenic cascade and declines with the deposition of Aβ in brain. This observation provides experimental support for the view that treatments for AD are likely to be most effective at the very beginning of the long preclinical phase that precedes the emergence of symptoms 15.
Results and Discussion
The trajectory of cerebral Aβ aggregation differs in aging APP23 and APPPS1 mice
Two well‐described mouse models of cerebral β‐amyloidosis were used, APP23 16 and APPPS1 17. To determine the approximate average lifespan of each model, 15‐month‐old male animals of each mouse strain were closely monitored and further aged until fulfilling the euthanasia criteria (“end stage”; see Materials and Methods). Results revealed a median lifespan of 28.6 months for male APP23 mice and 22.1 months for male APPPS1 mice (Fig 1A). Based on this observation, age groups were determined a priori, and brains were collected from 2‐, 6‐, 12‐, 18‐, 25‐month‐old and end‐stage mice for the APP23 line, and from 1.2‐, 3‐, 6‐, 12‐, 18‐month‐old and end‐stage mice for the APPPS1 line.
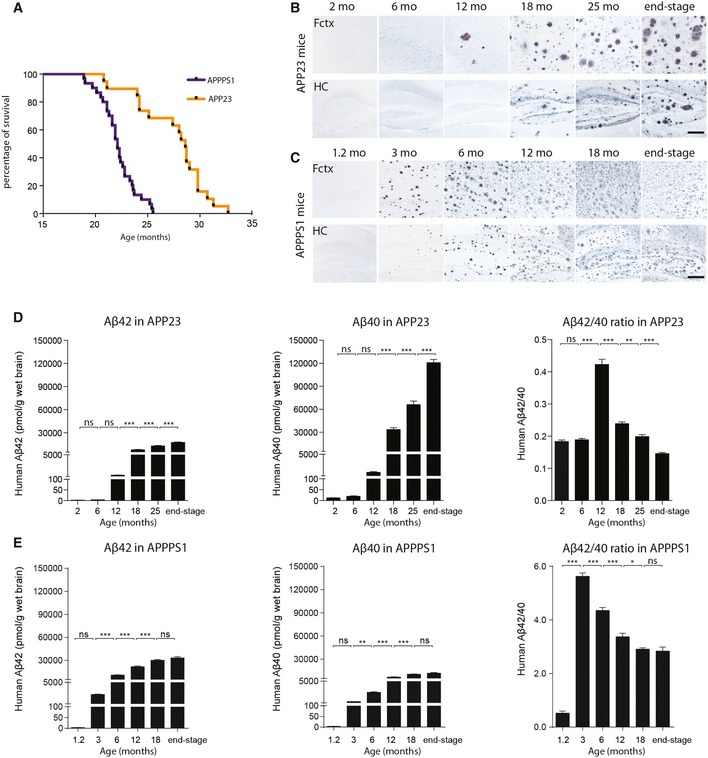
Figure 1. Age‐related changes in cerebral Aβ load in APP23 and APPPS1 tg mice.
-
ASurvival curves of APP23 (n = 19; males) and APPPS1 (n = 29; males) mice were generated by following cohorts of both strains from 15 months of age until the mice were sacrificed due to deteriorating health. Median survival time for APP23 mice was 28.6 months, and for APPPS1 mice 22.1 months (Chi square = 29.63, df = 1; P < 0.001).
-
B, CAβ immunostaining (black) combined with Congo red staining (red) shows Aβ deposits in the neocortex (upper row) and hippocampus (lower row) of male APP23 mice (B) and male APPPS1 mice (C) at different ages. End stage was defined as the point at which mice had to be terminated due to poor health (n = 5–9 male mice/group; representative images from each time point are shown). Scale bars: 200 μm.
-
D, EAβ40, Aβ42, and Aβ42/Aβ40 ratio in total brain homogenates of separate animal cohorts (n = 7–11 male mice per group) for APP23 mice (F 5,56 = 339.7, F 5,56 = 332.8, F 5,56 = 145.5, respectively) (D) and APPPS1 mice (F 5,41 = 168.4, F 5,41 = 257.2, F 5,41 = 182.4, respectively) (E) measured by immunoassays (mean ± SEM); ANOVA followed by post hoc Bonferroni test: *P < 0.05, **P < 0.01, ***P < 0.001, ns = not significant.
Immunohistochemical staining revealed a progressive increase of Aβ deposition for both mouse lines with advancing age. In APP23 mice, Aβ deposition was rarely seen at 6 months of age, but was conspicuous at 12 months, particularly in the frontal cortex (Fig 1B). At 18 months of age and beyond, parenchymal Aβ deposits occurred in most forebrain regions, and cerebral β‐amyloid angiopathy (CAA) also was present. In APPPS1 mice, the onset of Aβ deposition was much earlier than in APP23 mice (Fig 1C). While 1.2‐month‐old APPPS1 mice did not show Aβ deposition, robust deposition was present in most brain regions at 3 months of age, with the frontal region again being most affected. The number of Aβ plaques continued to increase thereafter (Fig 1C). CAA was not a prominent feature in the APPPS1 mouse model.
Consistent with the immunohistochemical appearance of the Aβ lesions, human sequence Aβ40 and Aβ42 in brain homogenates from APP23 and APPPS1 mice increased with advancing age (Fig 1D and E). While the increases at early stages appeared to be exponential, at later stages, the increase was 1.5‐ to twofold in APP23 mice (from 18 to 25 months to end stage) and 1.1‐ to 1.4‐fold in APPPS1 mice (from 12 to 18 months to end stage). At end stage, Aβ42 levels were 1.8‐fold higher in the APPPS1 mice compared to APPP23 mice (33,000 vs. 18,000 pmol/g wet brain weight); in contrast, Aβ40 levels at end stage were 10‐fold higher in APP23 mice compared to APPPS1 mice (120,000 vs. 12,000 pmol/g wet brain weight).
Of note, the Aβ42/Aβ40 ratio in both models sharply increased around the onset of Aβ deposition (12 months in APP23 mice and 3 months in APPPS1 mice) and declined thereafter (Fig 1D and E). Overall, the Aβ42/Aβ40 ratios were higher in the APPPS1 model, consistent with the expression of L166P‐mutated human PS1, which is known to favor cleavage at the Aβ42 site 17.
The β‐amyloid‐inducing activity in brain extracts reaches a plateau with aging
We have previously found that both membrane‐bound pellet and soluble fractions of β‐amyloid‐laden brains are seeding active 18, 19. In particular, the PBS‐soluble 100,000 g fraction was highly active but represented only a small fraction of the entire seeding activity 18. Therefore, in this study, the 3,000 g supernatant (total without large debris) has been used to compare the (total) β‐amyloid‐inducing activity of brain extracts among the mouse lines and age groups.
To this end, an endpoint titration bioassay was applied (see Materials and Methods). Extracts from APP23 and APPPS1 mice were serially diluted up to 10−4 in PBS, and each dilution was stereotactically injected into the hippocampus of 3‐ to 4‐month‐old APP23 mice. Host mice were analyzed 6 months later by Aβ immunohistochemistry, and the number of positively seeded mice was assessed for each dilution, age group, and mouse line (Fig 2A–C).
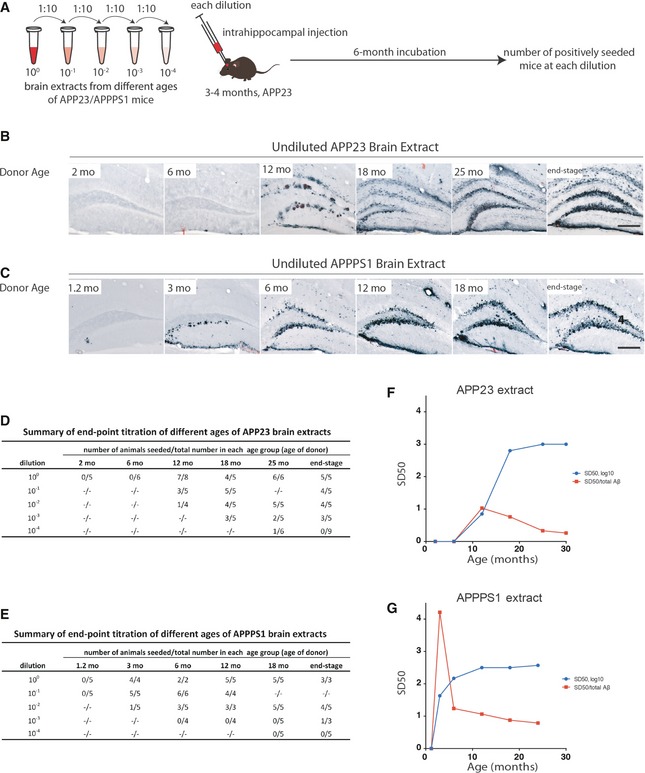
Figure 2. Seeding activity of brain extracts from APP23 and APPPS1 tg mice increases with donor age and plateaus in late stages.
-
A–CBrain extracts from APP23 (B) and APPPS1 (C) mice at different ages were injected into the hippocampus of young, pre‐depositing 3‐ to 4‐month‐old male APP23 host mice. Brains were immunohistochemically analyzed for Aβ deposition 6 months later. Aβ immunostaining combined with Congo red staining is shown. Note the more diffuse and filamentous Aβ deposition induced with the APP23 extracts in contrast to the punctate and compact Aβ deposition induced with the APPPS1 extracts. Scale bars: 200 μm.
-
D, ENumber of mice with induced Aβ deposition at each dilution from the different age groups (n = mainly 3–6/group) of APP23 (D) and APPPS1 (E) brain extracts.
-
F, GSD50 of APP23 (F) and APPPS1 (G) brain extracts (blue line; Reed‐Muench method, see Table 1 for statistical analysis). SD50 (half‐maximal seeding dose) was defined as the log10 of the brain extract dilution at which 50% of the host mice showed induced Aβ deposition (see Materials and Methods). The specific seeding activity (SD50/total Aβ; red line) for each extract indicates a peak at early ages in brain extracts from both mouse lines (see Table 2).
Brain extracts (undiluted) from 2‐ and 6‐month‐old male APP23 donor mice, which lacked immunohistochemically detectable Aβ deposition (see Fig 1), failed to induce Aβ deposition in host mice during the 6‐month incubation period employed in this assay. In contrast, brain extracts prepared from APP23 mice at 12 months or older efficiently induced cerebral β‐amyloidosis in the host mice (Fig 2B). Similarly, brain extracts (undiluted) from 1.2‐month‐old APPPS1 mice failed to induce Aβ deposition, while extracts from APPPS1 mice at 3 months and older were robustly seeding active (Fig 2C). Notably, the Aβ deposition induced with the APP23 extracts was morphologically different from the Aβ deposition induced with the APPPS1 extracts, and this was independent of the age of the donors (Fig 2B and C). This observation is reminiscent of the previously reported strain‐like transmission of Aβ morphotypes 20.
To determine the seeding activity of the various brain extracts quantitatively, the number of host mice with induced Aβ deposition in the hippocampus was assessed for each extract and dilution (Fig 2D and E). Subsequently, the seeding dilution (SD50) at which half of the inoculated animals showed seeded hippocampal Aβ deposition was calculated using the Reed and Muench method 21. The SD50 increased from 100.85 at 12 months to 103 at the end stage in the APP23 line (Fig 2F and G). For the APPPS1 line, the titers were similar, but were reached at a younger age, that is, the SD50 increased from 101.63 at 3 months of age to 102.57 at the end stage (Fig 2F and G). Surprisingly, from 18 months of age in APP23 mice and from 6 months of age in APPPS1 mice, the SD50 reached a plateau and did not increase further. To validate the Reed and Muench method, the Spearman–Kärber method 22, 23 was alternatively applied, and this yielded similar results (Table 1). Finally, logarithmic curve‐fitting using a built‐in method of Prism™ (Equation Log agonist vs. response with or without Hill Slope correction) was used to calculate statistical differences (Table 1).
Table 1.
Comparison of SD50 values (log10) calculated with different methods for all age groups of APP23 and APPPS1 brain extracts
| APP23 | APPPS1 | |||||||||||
|---|---|---|---|---|---|---|---|---|---|---|---|---|
| 2 months | 6 months | 12 months | 18 months | 25 months | End‐stage | 1.2 months | 3 months | 6 months | 12 months | 18 months | End‐stage | |
| Reed‐Muench | 0.00 | 0.00 | 0.85 | 2.80 | 3.00 | 3.00 | 0.00 | 1.63 | 2.17 | 2.50 | 2.50 | 2.57 |
| Spearman‐Kärber | 0.00 | 0.00 | 1.23 | 2.90 | 3.07 | 2.81 | 0.00 | 1.70 | 2.10 | 2.50 | 2.50 | 2.63 |
| Curve‐fitting | 0.00 | 0.00 | 1.12 ± 0.00 | 3.08 ± 0.06 | 2.99 ± 0.18 | 2.95 ± 0.16 | 0.00 | 1.61 ± 0.38 | 2.15 ± 0.14 | 2.55 ± 0.14 | 2.54 ± 0.43 | 2.63 ± 0.08 |
Curve‐fitting based on the Reed‐Muench method was used for statistical analysis. The SEM is indicated. Two‐way ANOVA revealed a significant effect for age group (F 5,184 = 25.88; P < 0.001) but not for genotype (F 1,184 = 1.35; P = 0.25). There was a significant interaction of genotype x age group (F 5,184 = 3.537; P < 0.01). N was 5–29 and results from the summed numbers of mice examined in Fig 2D and E. Subsequent post hoc Bonferroni tests revealed that seed titers plateaued starting at 18 months for APP23, and at 6 months for APPPS1, group comparisons P > 0.05.
The specific β‐amyloid‐inducing activity peaks during the earliest stages of Aβ deposition
The β‐amyloid‐inducing activity of brain extracts is dependent on the presence of Aβ 11, 24. Thus, the specific SD50 was calculated (Fig 2F and G; Table 2), that is, SD50 normalized to the Aβ concentration (monomeric Aβ equivalent). Remarkably, in both mouse models, the highest specific SD50 occurred at the onset of Aβ plaque deposition, independent of whether it is normalized to the concentration of Aβ40 or Aβ42 (not shown), or total Aβ (i.e., Aβ40 + Aβ42; Fig 2F and G; Table 2). Notably, this time point also coincides with a temporary increase in the brain Aβ42/Aβ40 ratio in both models (Fig 1D and E). Except for the extracts from young donor mice that failed to induce seeding in our assay, the specific SD50 was higher in APPPS1 mouse brains than in APP23 mouse brains (Fig 2F and G). Moreover, the specific SD50 in APPPS1 mice differed by roughly 3 log10 between early and late time points (Fig 2G; Table 2).
Table 2.
Specific seeding activity (SD50 per total Aβ) contained in injected material from donor mice of different ages
| APP23 | APPPS1 | |||||||||||
|---|---|---|---|---|---|---|---|---|---|---|---|---|
| 2 months | 6 months | 12 months | 18 months | 25 months | End‐stage | 1.2 months | 3 months | 6 months | 12 months | 18 months | End‐stage | |
| Total Aβ (fmol) | 1.67 | 1.52 | 6.91 | 824.87 | 3075.50 | 3830.74 | 3.78 | 10.11 | 118.53 | 296.76 | 360.38 | 473.08 |
| SD50/total Aβ | (0.00) | (0.00) | 1.03 | 0.76 | 0.33 | 0.26 | (0.00) | 4.21 | 1.24 | 1.07 | 0.88 | 0.78 |
Rationale for directing anti‐Aβ therapeutics to the earliest stage of the pathogenic cascade
Despite the importance of Aβ aggregation as a trigger of AD pathogenesis, there is little information on whether the biological activity of the aggregated peptide changes as the disease evolves. In this series of studies, we determined the potency of Aβ seeds using the in vivo induction of Aβ aggregation as a readout. For this purpose, we used two distinct APP‐tg mouse models with differing rates of deposition. Although the age at which Aβ deposits first appear in these models is quite different, the emergence of Aβ seeds that are able to induce detectable deposition within the time‐frame of our assay coincides with the earliest ages of deposition in the donor mouse (note that the exact age of onset is 8–9 months and 1.5 months in male APP23 and APPPS1 mice, respectively, but these ages were not tested in the current study). Remarkably, at later stages of life in both models, the correlation of seeding activity with the Aβ load diminishes, as seeding activity reaches a plateau even though Aβ deposition continues to increase as the mice age. Consequently, the highest seeding activity relative to total Aβ (the specific seeding activity) occurs at the inception of Aβ deposition, and this coincides with a peak of the Aβ42/Aβ40 ratio.
We first followed Aβ deposition across the average lifespan of APP23 and APPPS1 mouse models. Consistent with previous reports 25, 26, 27, 28, we observed a steep increase of both Aβ40 and Aβ42 levels beginning at the age of onset of plaque deposition in both mouse lines. At end stage, total Aβ levels (Aβ40 + Aβ42) were threefold higher in APP23 mice compared to APPPS1 mice, and this was due to a massive increase of Aβ40 in aged APP23 mice. This was not only due to insoluble aggregates as post hoc analysis of the 100,000 g soluble fractions from a different study also showed an age‐related increase in both models (not further analyzed here). Nonetheless, longevity is shorter in APPPS1 mice than in APP23 mice, possibly indicating a minor contribution or protective effect of Aβ40. The shorter lifespan of APPPS1 mice could also be a consequence of the PS1 transgene overexpression.
Although Aβ seeds are known to induce cerebral Aβ aggregation in a concentration‐dependent manner 29, 30, the potency of Aβ seeds, that is, the amount of Aβ‐containing species needed to induce Aβ deposition, has been difficult to quantify. The latter, however, is important for current efforts to purify Aβ seeding activity. In the present study, we therefore developed an endpoint titration bioassay similar to those used to measure prion infectivity 31, 32 and more recently for Aβ 33. We were thus able to establish the dose of Aβ seeds that induces deposition in 50% of the animals (the seeding dilution or dose 50, or SD50) as a reliable measure of the activity of Aβ seeds. Using this assay, we found that the seeding activity of PBS‐soluble brain extracts initially increases exponentially with age, but then reaches a plateau in both mouse models. At the plateau stage, a single APP23 mouse brain contains approximately 1,600,000 seeding units, while an APPPS1 brain contains roughly 600,000 units (based on the assumption of a mouse brain weighing 400 mg). Interestingly, in prion disease, infectious prions in the brain first increase exponentially, followed by a plateau in prion titers that governs the onset of clinical disease, suggesting a transition to the generation of toxic assemblies of the prion protein that differ from the infectious prion seeds 32. Whether similarly distinct species of Aβ exist over the course of AD pathogenesis and whether the earlier plateauing of seeding potency in the APPPS1 line is responsible for the early death of these mice is not known.
Strikingly, the seeding potency of Aβ (specific SD50) in both mouse models peaks during the earliest stages of Aβ deposition. Moreover, this spike in seeding potency coincides with a transient increase in the Aβ42/Aβ40 ratio, which occurs shortly after the onset of Aβ deposition and then decreases as plaques and CAA proliferate in the brain 27, 28. Therefore, Aβ seed potency, the Aβ42/Aβ40 ratio, and deposition stage are closely linked, and this is true in both APP23 and APPPS1 mouse models. The greater potency of Aβ seeds during all stages of deposition in APPPS1 mice corresponds to the higher Aβ42/Aβ40 ratio (Fig 1) and relatively more aggregated Aβ species (Fig EV1) in APPPS1 mice compared to APP23 mice. Our results thus support the hypothesis that Aβ42‐containing aggregates are particularly effective components of bioactive Aβ seeds.
Figure EV1. Age‐dependent increase of fibrillar Aβ species in seeding extracts for both transgenic mouse models.
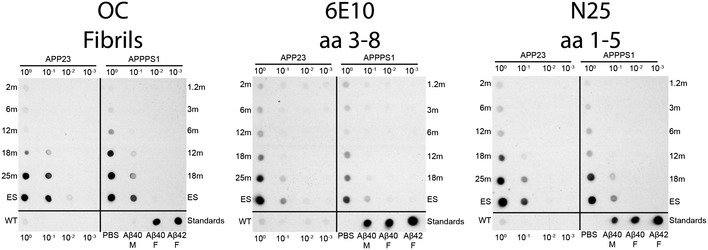
Pooled seeding extracts used for in vivo inoculations were spotted on nitrocellulose membranes and probed with antibodies against fibrillar Aβ epitopes (OC) or monomeric Aβ epitopes at amino acids (aa) 3–8 (6E10) or aa 1–5 (N25). An aged wild‐type (WT) control brain extract was used at the same total protein concentration as the transgenic samples (i.e., 3 μg total protein in 100) in addition to 5 ng of each monomeric Aβ1–40, fibrillar Aβ1–40, and fibrillar Aβ1–42. Presented is a representative blot performed in duplicate. M = monomer, F = fibril, ES = end stage.
The peak in specific seeding activity of Aβ early during deposition may be due to the predominance of relatively small aggregates at this time, which results in a large number of molecular seeding surfaces relative to the number of total Aβ molecules present. With increasing aggregation (and increasing total Aβ), an increasing fraction of molecular seeding surfaces may be buried within the aggregates and unable to template other Aβ molecules. However, it is also possible that the evolving potency of Aβ seeds results from features of the assemblies that change as the disease process advances in the brain, a possibility also in line with the coincident spikes in seeding potency and the Aβ42/Aβ40 ratio. Although the preparation of our injectable material (3,000 g) was relatively gentle, we cannot exclude effects on the aggregation state of the seeds or their interaction with other proteins that might modulate the seeding activity.
Implications
Our findings in transgenic mouse models indicate that Aβ seeds are most potent in the early stages of Aβ deposition and that this spike in specific seeding activity is associated with a transient increase in the Aβ42/Aβ40 ratio. Thereafter, both Aβ levels and the total seeding activity increase rapidly, followed by a leveling‐off of the seeding activity even as total Aβ levels continue to climb. Our results demonstrate that the pathobiology of Aβ changes as the disease process evolves, at least with respect to the seeding capacity of aberrant Aβ. The particular potency of Aβ seeds in the initial stages underscores the importance of therapeutically targeting Aβ deposition in the brain before it becomes detectable by PET imaging or CSF biomarker analysis. In this light, more sensitive biomarkers are needed that will enable earlier or even predictive identification of the AD pathogenic process. Therapeutically, compounds that prevent the formation or activity of Aβ seeds hold particular promise for the prevention and treatment of AD.
Materials and Methods
Mice
All animal experiments were conducted in compliance with protocols approved by the local Animal Care and Use Committee. APP23 mice overexpress KM670/671NL‐mutated human APP under the control of a neuronal Thy1 promoter. The mice were generated on a B6D2 background 16, but they have been backcrossed to C57BL/6J for more than 25 generations. APPPS1 mice express the same mutant form of APP together with L166P‐mutated presenilin‐1, again under the control of the neuron‐specific Thy1 promoter element, and were generated and maintained on a C57BL/6J genetic background 17. Male and female APP23 mice differ in the age at which endogenous amyloid deposition begins 27. Therefore, to reduce variation in age‐related deposition, male APP23 and, consistently, male APPPS1 mice were used. All donor mice were group‐housed under specific pathogen‐free conditions (APP23 in Basel, Novartis; APPPS1 in Tübingen, Hertie Institute for Clinical Brain Research). Mice were inspected regularly for health issues. Mice were euthanized when they reached a pre‐specified age or in the event that they were deemed to be in intractable distress based on an independent assessment by the animal caretaker according to AVMA Guidelines (https://www.avma.org/KB/Policies/Documents/euthanasia.pdf). The latter criterion was used to determine the end‐stage time point that defined the median lifespan of each of the mouse lines. Mice were sacrificed by cervical dislocation under isoflurane anesthesia. Brains were removed from sacrificed mice, immediately frozen using dry ice, and stored at −80°C until use for either histological staining or brain tissue homogenate preparation. All experimental procedures with the mice were carried out in accordance with the veterinary office regulations of Baden‐Wuerttemberg (Germany) and approved by the local Animal Care and Use Committees.
Aβ immunohistochemical analysis of APP23 and APPPS1 mice
Brains (hemispheres) were cut sagittally (15 μm thickness) with a cryostat, and a representative set of sections (every 20th section) was stained immunohistochemically with an in‐house polyclonal antibody directed against Aβ and the Vectastain Elite ABC kit (Vector Laboratories, Burlingame, CA) as previously described 12. Sections were then co‐stained with Congo red according to standard protocols. Representative images are shown in Fig 1 for each time point and genotype (n = 5–9 male mice were used per age group).
Preparation of brain tissue homogenates
Brains from a separate cohort of male mice (n = 7–11 per age group) were homogenized in sterile PBS (10%, w/v) at 4°C (2 × 10 s at 5,500 rpm, each round separated by a 10 s pause) using a Precellys 24 Dual homogenizer (Bertin, Montigny‐le‐Bretonneux, France; 7 ml lysing tubes with 2.8 mm ceramic beads). Samples were stored at −80°C. Brain homogenates were either kept for further quantitative Aβ analysis or used for intracerebral injections.
Quantification of Aβ by electrochemiluminescence‐linked immunoassay
Aβ peptides (Aβ40 and Aβ42) in brain homogenates were quantified with an electrochemiluminescence‐linked immunoassay using the MSD® 96‐well Human (6E10) Aβ Triplex Assay (MesoScale Discovery); 96‐well plates that had been pre‐spotted with capture antibodies against Aβ40 and Aβ42 were blocked for 1 h with 1% bovine serum albumin in Tris buffer and washed three times with 1× Tris buffer. Samples were treated with formic acid (final concentration: 70%) (Sigma), sonicated for 30 s on ice, and centrifuged at 25,000 × g for 1 h at 4°C. Supernatants were equilibrated in neutralization buffer (1 M Tris base, 0.5 M Na2HPO4, 0.05% NaN3) and diluted up to 1:1,000 (depending on Aβ load, to stay within the linear range of the assay) in 1% BSA. Samples were then co‐incubated with the SULFO‐TAG 6E10 detection antibody solution on the plate for 2 h. After washing, MSD Read Buffer T was added and the plate was read immediately on a Sector Imager 6000. Data analysis used MSD DISCOVERY WORKBENCH software 2.0.
Intracerebral injections and serial dilution of brain extracts
For intracerebral injections, brain homogenates were centrifuged at 3,000 × g for 5 min at 4°C and the supernatant collected (hereafter referred as “brain extract”). In order to reduce individual mouse variability, for each age group, brain extracts from all the mice within an age group were pooled (n = 8–10 per group; see above) and then serially diluted up to 10−4 fold in sterile PBS. Host mice were 3‐ to 4‐month‐old male APP23 mice (n = mainly 3–6 per group). The mice were anaesthetized with a mixture of ketamine (110 mg/kg body weight) and xylazine (20 mg/kg body weight) in saline; 2.5 μl of each brain extract or dilution thereof were bilaterally delivered to the hippocampus (AP: −2.5 mm, L: +/− 2.0 mm, DV: −1.8 mm) with a Hamilton syringe. Injections were performed at 1.25 μl/min, and the needle was kept in place for an additional 2.5 min before being slowly withdrawn. The surgical area was cleaned with sterile saline, the incision was sutured, and the mice were monitored until recovery from anesthesia.
Endpoint titration assay to estimate SD50
After 6 months of incubation, mice inoculated with brain extracts were deeply anaesthetized with ketamine (250 mg/kg)/xylazine (25 mg/kg) and sacrificed by transcardial perfusion with ice‐cold PBS. Brains were immersion‐fixed for 48 h in 4% paraformaldehyde in PBS and then cryoprotected in 30% sucrose in PBS for an additional 48 h. Fixed brains were serially cut into 25‐μm‐thick coronal sections on a freezing‐sliding microtome (Microm, Thermo Scientific) and collected in a 12‐well plate containing cryoprotectant (35% ethylene glycol, 25% glycerol in PBS) for storage at −20°C. Sections from a single well (containing every 12th section) were then stained immunohistochemically with a polyclonal antibody directed against Aβ and co‐stained with Congo red according to standard protocols (see Aβ immunohistochemical analysis above).
To quantify the seeding activity of extracts from donors at different ages, we calculated the half‐maximal Aβ seeding titers (SD50) using titration assays similar to those used in prion infectivity titer measurements. The classic methods for measuring scrapie prion infectivity in vivo are the endpoint titration bioassay and the incubation time interval assay 34, 35, 36. Although the latter is less costly and time‐consuming 36, the absence of reliable and obvious clinical symptoms in APP transgenic mouse models limited its feasibility for these models. Therefore, we chose the endpoint titration bioassay and killed animals after a fixed incubation time.
Positive or negative induction of Aβ deposition was rated on the Aβ‐immunostained sections throughout the hippocampus for each animal. Note that endogenous Aβ plaques in the hippocampus of male 9‐ to 10‐month‐old APP23 mice are absent 11 or limited to no more than one plaque per section. Moreover, rare endogenous Aβ plaques can be distinguished from induced Aβ deposition, which reveals the typical induction pattern along the layers in the dentate gyrus (see Fig 2B and C). Two independent raters performed the quantification blinded, and their assessments were 100% congruent.
The number of animals that showed induced Aβ deposition at each dilution was determined in order to calculate the Aβ seeding titer. Titers (SD50) were calculated by counting positively seeded animals vs total animals according to Reed and Muench 21 or the Spearman–Kärber method 22, 23. Calculation with logarithmic curve‐fitting was based on the numbers of positive vs total animals as determined with the Reed and Muench method 21 using Equation Log agonist vs. response with or without Hill Slope correction, as provided by GraphPad Prism™ version 5.
Dot blot assay
For further characterization, “brain extracts” of a given age group were pooled, IgG‐depleted using Sheep Anti‐Mouse Dynabeads (Life Technologies, 11201D) and total protein determined by BCA assay (Thermo). Samples were serially diluted in PBS containing protease‐ and phosphatase‐inhibitors (Thermo) at the following dilutions: 10−1, 10−2 and 10−3. Samples were spotted on nitrocellulose membranes so that 3 μg total protein was contained in the undiluted (100) area. An aged non‐transgenic mouse (29 months old; wild type) seeding extract was included in addition to synthetic Aβ samples. Synthetic Aβ1–40 and Aβ1–42 (Bachem, H‐1194 and H‐8146, respectively) were fibrillized at 37°C (100 μM Aβ, 10 mM HCl, 150 mM NaCl) for 5 days without shaking and 5 ng of each was spotted on membranes, in addition to a monomeric Aβ1–40 control (5 ng). Blotting and probing with OC (Millipore, AB2286) were performed as previously described 37. Briefly, membranes were rehydrated in Tris–glycine (25–192 mM) buffer containing 20% MetOH, then incubated in hydrogen peroxide (0.3% in PBS) for 15 min. After washing, membranes were blocked in skim milk (10% in PBS‐0.05% Tween ‐> PBS‐T) for 60 min and probed with OC overnight at 4°C (1:10,000, PBS‐T with 5% BSA). Membranes were washed with PBS‐T and incubated in donkey anti‐rabbit‐HRP secondary (1:30,000; Jackson ImmunoResearch Laboratories, 711‐035‐152) for 60 min, then washed (PBS‐T) prior to developing with SuperSignal™ West Dura Extended Duration Substrate (Thermo) and exposed on Hyperfilm (Amersham). Staining with 6E10 (BioLegend, 803017) and N25 (gift of M. Mercken) 38 was done in parallel, with membranes being heated in PBS after rehydration (95°C for 5 min) and blocked in skim milk (5% in PBS‐T) for 60 min. Membranes were incubated in 6E10 (1:5,000 in PBS‐T) or N25 (1:5,000 in PBS‐T) overnight at 4°C before being washed (PBS‐T) and incubated in goat anti‐mouse (1:30,000; Jackson ImmunoResearch Laboratories, 115‐035‐068) for 60 min. Membranes were developed in the same way as for OC. Control blots without addition of primary antibodies were also done in parallel with both anti‐rabbit and anti‐mouse secondaries.
Statistical analysis
GraphPad Prism™ version 5 was used for all statistical analyses.
Author contributions
LY, JR, SAK, A‐MM, UO, JM, JS, JO, CK, and SKF performed the experimental work. LY, JR, A‐MM, and FB carried out the statistical analysis. FB and MJ designed the study, and LCW and MS helped with the interpretation of the data. LY, JR, LCW, MS, and MJ prepared the manuscript with the help of all other authors.
Conflict of interest
The authors declare that they have no conflict of interest.
Supporting information
Expanded View Figures PDF
Review Process File
Acknowledgements
We would like to thank our laboratory members for experimental help and Peter Nilsson and Per Hammarstrom (Linköping) for advice. We are grateful to M. Mercken (Johnson & Johnson Pharmaceutical Research & Development) for providing the N25 Aβ antibody. This work was supported by a grant from the Competence Network on Degenerative Dementias (BMBF‐01GI0705). L.Y. was financially supported by the Chinese Scholarship Council, and L.C.W. was supported by an award from the Alexander von Humboldt Foundation.
EMBO Reports (2017) 18: 1536–1544
References
- 1. Bateman RJ, Xiong C, Benzinger TL, Fagan AM, Goate A, Fox NC, Marcus DS, Cairns NJ, Xie X, Blazey TM et al (2012) Clinical and biomarker changes in dominantly inherited Alzheimer's disease. N Engl J Med 367: 795–804 [DOI] [PMC free article] [PubMed] [Google Scholar]
- 2. Jack CR Jr, Holtzman DM (2013) Biomarker modeling of Alzheimer's disease. Neuron 80: 1347–1358 [DOI] [PMC free article] [PubMed] [Google Scholar]
- 3. Dubois B, Hampel H, Feldman HH, Scheltens P, Aisen P, Andrieu S, Bakardjian H, Benali H, Bertram L, Blennow K et al (2016) Preclinical Alzheimer's disease: definition, natural history, and diagnostic criteria. Alzheimers Dement 12: 292–323 [DOI] [PMC free article] [PubMed] [Google Scholar]
- 4. De Strooper B (2010) Proteases and proteolysis in Alzheimer disease: a multifactorial view on the disease process. Physiol Rev 90: 465–494 [DOI] [PubMed] [Google Scholar]
- 5. Duering M, Grimm MO, Grimm HS, Schroder J, Hartmann T (2005) Mean age of onset in familial Alzheimer's disease is determined by amyloid beta 42. Neurobiol Aging 26: 785–788 [DOI] [PubMed] [Google Scholar]
- 6. Kumar‐Singh S, Theuns J, Van Broeck B, Pirici D, Vennekens K, Corsmit E, Cruts M, Dermaut B, Wang R, Van Broeckhoven C (2006) Mean age‐of‐onset of familial alzheimer disease caused by presenilin mutations correlates with both increased Abeta42 and decreased Abeta40. Hum Mutat 27: 686–695 [DOI] [PubMed] [Google Scholar]
- 7. Szaruga M, Veugelen S, Benurwar M, Lismont S, Sepulveda‐Falla D, Lleo A, Ryan NS, Lashley T, Fox NC, Murayama S et al (2015) Qualitative changes in human gamma‐secretase underlie familial Alzheimer's disease. J Exp Med 212: 2003–2013 [DOI] [PMC free article] [PubMed] [Google Scholar]
- 8. Jucker M, Walker LC (2013) Self‐propagation of pathogenic protein aggregates in neurodegenerative diseases. Nature 501: 45–51 [DOI] [PMC free article] [PubMed] [Google Scholar]
- 9. Harper JD, Lansbury PT Jr (1997) Models of amyloid seeding in Alzheimer's disease and scrapie: mechanistic truths and physiological consequences of the time‐dependent solubility of amyloid proteins. Annu Rev Biochem 66: 385–407 [DOI] [PubMed] [Google Scholar]
- 10. Walker LC, Jucker M (2015) Neurodegenerative diseases: expanding the prion concept. Annu Rev Neurosci 38: 87–103 [DOI] [PMC free article] [PubMed] [Google Scholar]
- 11. Meyer‐Luehmann M, Coomaraswamy J, Bolmont T, Kaeser S, Schaefer C, Kilger E, Neuenschwander A, Abramowski D, Frey P, Jaton AL et al (2006) Exogenous induction of cerebral beta‐amyloidogenesis is governed by agent and host. Science 313: 1781–1784 [DOI] [PubMed] [Google Scholar]
- 12. Eisele YS, Obermuller U, Heilbronner G, Baumann F, Kaeser SA, Wolburg H, Walker LC, Staufenbiel M, Heikenwalder M, Jucker M (2010) Peripherally applied Abeta‐containing inoculates induce cerebral beta‐amyloidosis. Science 330: 980–982 [DOI] [PMC free article] [PubMed] [Google Scholar]
- 13. Stöhr J, Condello C, Watts JC, Bloch L, Oehler A, Nick M, DeArmond SJ, Giles K, DeGrado WF, Prusiner SB (2014) Distinct synthetic Abeta prion strains producing different amyloid deposits in bigenic mice. Proc Natl Acad Sci USA 111: 10329–10334 [DOI] [PMC free article] [PubMed] [Google Scholar]
- 14. Morales R, Duran‐Aniotz C, Castilla J, Estrada LD, Soto C (2012) De novo induction of amyloid‐beta deposition in vivo . Mol Psychiatry 17: 1347–1353 [DOI] [PubMed] [Google Scholar]
- 15. Sperling R, Mormino E, Johnson K (2014) The evolution of preclinical Alzheimer's disease: implications for prevention trials. Neuron 84: 608–622 [DOI] [PMC free article] [PubMed] [Google Scholar]
- 16. Stürchler‐Pierrat C, Abramowski D, Duke M, Wiederhold KH, Mistl C, Rothacher S, Ledermann B, Burki K, Frey P, Paganetti PA et al (1997) Two amyloid precursor protein transgenic mouse models with Alzheimer disease‐like pathology. Proc Natl Acad Sci USA 94: 13287–13292 [DOI] [PMC free article] [PubMed] [Google Scholar]
- 17. Radde R, Bolmont T, Kaeser SA, Coomaraswamy J, Lindau D, Stoltze L, Calhoun ME, Jaggi F, Wolburg H, Gengler S et al (2006) Abeta42‐driven cerebral amyloidosis in transgenic mice reveals early and robust pathology. EMBO Rep 7: 940–946 [DOI] [PMC free article] [PubMed] [Google Scholar]
- 18. Langer F, Eisele YS, Fritschi SK, Staufenbiel M, Walker LC, Jucker M (2011) Soluble Abeta seeds are potent inducers of cerebral beta‐amyloid deposition. J Neurosci 31: 14488–14495 [DOI] [PMC free article] [PubMed] [Google Scholar]
- 19. Marzesco AM, Flotenmeyer M, Buhler A, Obermuller U, Staufenbiel M, Jucker M, Baumann F (2016) Highly potent intracellular membrane‐associated Abeta seeds. Sci Rep 6: 28125 [DOI] [PMC free article] [PubMed] [Google Scholar]
- 20. Heilbronner G, Eisele YS, Langer F, Kaeser SA, Novotny R, Nagarathinam A, Aslund A, Hammarstrom P, Nilsson KP, Jucker M (2013) Seeded strain‐like transmission of beta‐amyloid morphotypes in APP transgenic mice. EMBO Rep 14: 1017–1022 [DOI] [PMC free article] [PubMed] [Google Scholar]
- 21. Reed LJ, Muench H (1938) A simple method of estimating fifty per cent endpoints. Am J Epidemiol 27: 493–497 [Google Scholar]
- 22. Armitage P, Allen I (1950) Methods of estimating the LD 50 in quantal response data. J Hyg (Lond) 48: 298–322 [DOI] [PMC free article] [PubMed] [Google Scholar]
- 23. Kärber G (1931) Beitrag zur kollektiven Behandlung pharmakologischer Reihenversuche. Arch Exp Pathol Pharmakol 162: 480–483 [Google Scholar]
- 24. Duran‐Aniotz C, Morales R, Moreno‐Gonzalez I, Hu PP, Fedynyshyn J, Soto C (2014) Aggregate‐depleted brain fails to induce Abeta deposition in a mouse model of Alzheimer's disease. PLoS One 9: e89014 [DOI] [PMC free article] [PubMed] [Google Scholar]
- 25. Kawarabayashi T, Younkin LH, Saido TC, Shoji M, Ashe KH, Younkin SG (2001) Age‐dependent changes in brain, CSF, and plasma amyloid‐beta protein in the Tg2576 transgenic mouse model of Alzheimer's disease. J Neurosci 21: 372–381 [DOI] [PMC free article] [PubMed] [Google Scholar]
- 26. Lesne S, Kotilinek L, Ashe KH (2008) Plaque‐bearing mice with reduced levels of oligomeric amyloid‐beta assemblies have intact memory function. Neuroscience 151: 745–749 [DOI] [PMC free article] [PubMed] [Google Scholar]
- 27. Maia LF, Kaeser SA, Reichwald J, Hruscha M, Martus P, Staufenbiel M, Jucker M (2013) Changes in amyloid‐beta and Tau in the cerebrospinal fluid of transgenic mice overexpressing amyloid precursor protein. Sci Transl Med 5: 194re192 [DOI] [PubMed] [Google Scholar]
- 28. Maia LF, Kaeser SA, Reichwald J, Lambert M, Obermuller U, Schelle J, Odenthal J, Martus P, Staufenbiel M, Jucker M (2015) Increased CSF Abeta during the very early phase of cerebral Abeta deposition in mouse models. EMBO Mol Med 7: 895–903 [DOI] [PMC free article] [PubMed] [Google Scholar]
- 29. Eisele YS, Fritschi SK, Hamaguchi T, Obermuller U, Fuger P, Skodras A, Schafer C, Odenthal J, Heikenwalder M, Staufenbiel M et al (2014) Multiple factors contribute to the peripheral induction of cerebral beta‐Amyloidosis. J Neurosci 34: 10264–10273 [DOI] [PMC free article] [PubMed] [Google Scholar]
- 30. Fritschi SK, Langer F, Kaeser SA, Maia LF, Portelius E, Pinotsi D, Kaminski CF, Winkler DT, Maetzler W, Keyvani K et al (2014) Highly potent soluble amyloid‐beta seeds in human Alzheimer brain but not cerebrospinal fluid. Brain 137: 2909–2915 [DOI] [PMC free article] [PubMed] [Google Scholar]
- 31. Flechsig E, Shmerling D, Hegyi I, Raeber AJ, Fischer M, Cozzio A, von Mering C, Aguzzi A, Weissmann C (2000) Prion protein devoid of the octapeptide repeat region restores susceptibility to scrapie in PrP knockout mice. Neuron 27: 399–408 [DOI] [PubMed] [Google Scholar]
- 32. Sandberg MK, Al‐Doujaily H, Sharps B, Clarke AR, Collinge J (2011) Prion propagation and toxicity in vivo occur in two distinct mechanistic phases. Nature 470: 540–542 [DOI] [PubMed] [Google Scholar]
- 33. Morales R, Bravo‐Alegria J, Duran‐Aniotz C, Soto C (2015) Titration of biologically active amyloid‐beta seeds in a transgenic mouse model of Alzheimer's disease. Sci Rep 5: 9349 [DOI] [PMC free article] [PubMed] [Google Scholar]
- 34. Makarava N, Savtchenko R, Alexeeva I, Rohwer RG, Baskakov IV (2012) Fast and ultrasensitive method for quantitating prion infectivity titre. Nat Commun 3: 741 [DOI] [PMC free article] [PubMed] [Google Scholar]
- 35. Maramorosch K, McKelvey JJJ (1985) Subviral pathogens of plants and animals: Viroids and Prions. Orlando, FL: Academic Press; [Google Scholar]
- 36. Prusiner SB, Cochran SP, Groth DF, Downey DE, Bowman KA, Martinez HM (1982) Measurement of the scrapie agent using an incubation time interval assay. Ann Neurol 11: 353–358 [DOI] [PubMed] [Google Scholar]
- 37. Liu P, Reed MN, Kotilinek LA, Grant MK, Forster CL, Qiang W, Shapiro SL, Reichl JH, Chiang AC, Jankowsky JL et al (2015) Quaternary structure defines a large class of Amyloid‐beta oligomers neutralized by sequestration. Cell Rep 11: 1760–1771 [DOI] [PMC free article] [PubMed] [Google Scholar]
- 38. Vandermeeren M, Geraerts M, Pype S, Dillen L, Van Hove C, Mercken M (2001) The functional gamma‐secretase inhibitor prevents production of amyloid beta 1‐34 in human and murine cell lines. Neurosci Lett 315: 145–148 [DOI] [PubMed] [Google Scholar]
Associated Data
This section collects any data citations, data availability statements, or supplementary materials included in this article.
Supplementary Materials
Expanded View Figures PDF
Review Process File