Figure 5.
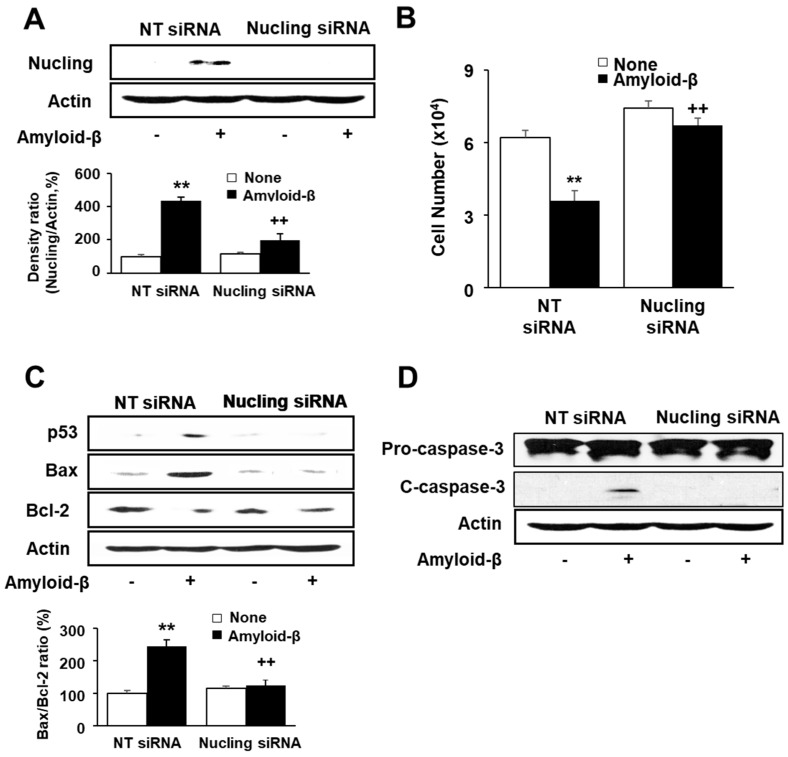
Cell viability and apoptotic indices in NT siRNA-transfected cells and Nucling siRNA-transfected cells with or without amyloid-β stimulation. The transfected cells were pre-treated with lycopene for 1 h and, then, stimulated with amyloid-β (20 μM) for another 24 h. (A) Levels of Nucling were determined by western blot analysis. Protein levels of Nucling were compared with that of the loading control actin and expressed as percentage ratios of the band densities; (B) Viable cell number was determined by the Trypan Blue exclusion test. The value for NT siRNA-transfected cells without amyloid-β stimulation was set as 100%; (C) Levels of p53, Bax and Bcl-2 were determined by western blot analysis. The ratio of Bax/Bcl-2 was determined by protein band densities of Bax and Bcl-2; (D) The levels of pro- and cleaved-caspase-3 were determined by western blot analysis. Actin served as a loading control. Values are expressed as the mean ± S.E. of three independent experiments. ** p < 0.01 vs. NT siRNA-transfected cells without amyloid-β stimulation; ++ p < 0.01 vs. NT siRNA-transfected cells with amyloid-β stimulation. NT siRNA, non-targeting control siRNA; c-caspase-3, cleaved caspase-3.

