

Abstract
The Cancer Genome Atlas (TCGA) sequencing analysis of head and neck squamous cell carcinoma (HNSCC) recently reported on gene fusions, however, few human papillomavirus (HPV) positive samples were included, and the functional relevance of identified fusions was not explored. We therefore performed an independent analysis of gene fusions in HPV-positive oropharyngeal SCC (OPSCC). RNA sequencing was performed on 47 HPV-positive OPSCC primary tumors and 25 normal mucosal samples from cancer unaffected controls on an Illumina TruSeq platform. MapSplice2 was used for alignment and identification of fusion candidates. Putative fusions with less than five spanning reads, detected in normal tissues, or that mapped to the same gene were filtered out. Selected fusions were validated by RT-PCR and Sanger sequencing. Within 47 HPV-positive OPSCC tumors, 282 gene fusions were identified. Most fusions (85.1%) occurred in a single tumor, and the remaining fusions recurred in 2–16 tumors. Gene fusions were associated with significant up regulation of 16 genes (including EGFR and ERBB4) and down regulation of four genes (PTPRT, ZNF750, DLG2, SLCO5A1). Expression of these genes followed similar patterns of up regulation and down regulation in tumors without these fusions compared to normal tissue. Five of six gene fusions selected for validation were confirmed through RT-PCR and sequencing. This integrative analysis provides a method of prioritizing functionally relevant gene fusions that may be expanded to other tumor types. These results demonstrate that gene fusions may be one mechanism by which functionally relevant genes are altered in HPV-positive OPSCC.
Keywords: head and neck/oral cancers, mechanisms of genomic alterations, functional genomics, gene fusion, human papillomavirus
Head and neck squamous cell carcinoma (HNSCC) affects nearly 60,000 individuals in the United States annually, and >400,000 individuals worldwide.1,2 Within this subset, human papillomavirus (HPV) related oropharyngeal cancer has been increasing in incidence in recent years.3,4 Since the discovery of HPV as an etiologic driver and significant biomarker in oropharyngeal squamous cell carcinoma (OPSCC), it has become increasingly clear that these tumors represent a biologically distinct entity. HPV-positive OPSCC occurs in a specific demographic of younger, non-smoking, white males,5 and it is associated with improved response to treatment6 and longer overall survival.5 In spite of improved prognosis, patients with HPV-positive OPSCC still undergo intensive treatment, which could be potentially de-escalated with a better understanding of tumor biology.7
Recent genome wide sequencing efforts performed to better understand the underlying biology of these tumors have highlighted the differences between HPV-positive and HPV-negative HNSCC. HPV-positive tumors harbor significantly fewer mutations per tumor than HPV-negative tumors8 and have a genetic profile distinct from tobacco exposure related tumors.9 While the Cancer Genome Atlas (TCGA) did not report significantly fewer mutations in HPV-related tumors, their results still showed a striking paucity of genetic alterations within targetable oncogenic pathways.10 The results of recent sequencing efforts highlight our inability to fully characterize the molecular drivers of HPV-related disease through mutational analysis alone.
Structural genetic changes, such as gene fusions, can alter the function of molecular drivers. These have not yet been thoroughly studied in HPV-positive OPSCC. While gene fusions have traditionally been associated with hematologic malignancies, their role is starting to be recognized in solid tumors. In particular, the advancement of sequencing technologies has improved our ability to identify gene fusions in heterogeneous solid tumors.11 In the head and neck region, a recurring MYB-NFIB gene fusion has been identified in adenoid cystic carcinoma as a prognostic marker and potential therapeutic target.12,13
In HNSCC, TCGA provided the first report on gene fusions. Within this sequencing analysis, there were 13,759 predicted gene fusion events in 279 HNSCC tumors, 36 of which were HPV-positive.10 Among these fusion events, a known gene fusion, FGFR3-TACC3, was identified in two HPV-positive tumors. This gene fusion has been previously reported in multiple solid tumors including nasopharyngeal carcinoma, non-small cell lung cancer, cervical cancer and brain gliomas14–17 with potential oncogenic activity.14 Beyond the FGFR3-TACC3 fusion, no other known gene fusions that involve oncogenes were identified, although EGFR and FGFR3 were noted to occur in fusions with non-recurrent partners.10 Furthermore, the TCGA gene fusion analysis performed limited filtering steps without biologic validation, leading to high potential for false positive results within the 13,759 predicted fusion events.18 Within this large number of predicted fusion events, a major challenge is distinguishing which of these identified gene fusions are functionally relevant to the tumor biology rather than passenger alterations.
Therefore, we performed RNA sequencing on a larger independent cohort of HPV-positive OPSCC primary tumors for the identification and analysis of gene fusions specific for HPV-related OPSCC. Additional validation was performed by comparison with TCGA, as well as biologic validation in primary tissues. Lastly, we also examined alterations in gene expression in genes associated with fusions. This integrative approach enabled the identification of several gene fusions with potential functional activity in HPV-positive OPSCC.
Material and Methods
Patient samples
Fifty primary tumor tissue samples were obtained from a cohort of patients with HPV-related oropharyngeal squamous cell carcinoma for analysis. The pathology of the primary tumor samples was confirmed by two pathologists, and all tissues were microdissected to yield at least 80% tumor purity. The HPV tumor status was determined using pathologic HPV in situ hybridization for high-risk HPV subtypes or p16 immunohistochemistry. In equivocal cases, using primers designed to detect E6 and E7 of HPV-16 PCR was used to confirm the presence of HPV. Twenty-five normal mucosal tissue samples of the oropharynx were obtained from uvulopharyngoplasty (UPPP) surgical samples in cancer unaffected controls. All tissue samples were collected from the Johns Hopkins Tissue Core, part of the Head and Neck Cancer Specialized Program of Research Excellence (HNC-SPORE). All patients were recruited under an institutional review board approved protocol (#NA_00-36235).
RNA preparation and sequencing analysis
The RNA was extracted from 0.35 mm thick frozen tissue sections using the mirVana miRNA Isolation Kit (Ambion, Forster City, CA) per manufacturer’s recommendations. The concentration of RNA was quantified using a NanoDrop spectrophotometer (Thermo Fisher Scientific, Waltham, MA). The RNA quality was assessed using a Agilent RNA 6000 Nano Kit (Santa Clara, CA). The samples were required to achieve an RNA Integrity Number (RIN) of at least 7.0.
After RNA extraction, 47 tumors and 25 normal samples passed minimum quality thresholds. A stranded RNA library was prepared using the Illumina TruSeq stranded total RNA seq poly A+ Gold kit (San Diego, CA) following the manufacturer’s recommendations. Next, a ribosomal RNA reduction was performed from 400 ng of total RNA and purified with AMPure XP magnetic beads. The purified RNA was fragmented, primed at 94°C for 8 min and stored at 4°C. The fragmented RNA was then converted to double stranded cDNA, and the cDNA was 3′ adenylated and ligated with barcode adapters. The library was then enriched using PCR and AMPure XP bead purification. The quality and quantity of each library was assessed using the Agilent High Sensitivity DNA Analysis Kit. Sequencing was then performed using the HiSeq 2500 platform sequencer (Illumina), and the TruSeq Cluster Kit for 2×100 bp sequencing. There were approximately 80 million paired reads per sample. The reads were trimmed to remove adapter sequences and low quality reads using Trim Galore (http://www.bioinformatics.babraham.ac.uk/projects/trim_galore/).
The RNA sequencing data were next normalized using the version 2 protocols as developed by TCGA.10 The RNA sequences were aligned to the GRCh37/hg19 genome assembly using MapSplice2 version 2.0.1.9. MapSplice was run with the default command line arguments and the fusion option to perform fusion identification and quantify read counts in fusions during the alignment.19
Fusion analysis
After normalization, additional filtering criteria were applied to identify the candidate fusions and decrease false positive events from misalignment (Fig. 1). Using the fusions identified from MapSplice, we used R (version 3.1.1) to apply additional filtering. Fusions were retained if the following requirements were met: (1) the fusion was required to have a read coverage >5 per tumor, (2) the fusion was not identified in normal tissue, and (3) the fusion mapped to two different genes, or between a gene and non-coding region.
Figure 1.
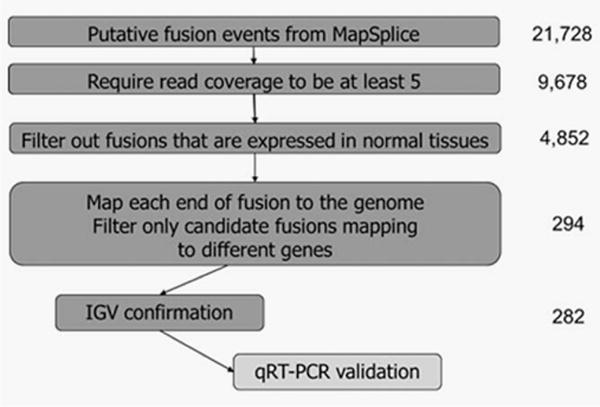
Summary of filtering algorithm for identification of gene fusions. From MapSplice, 21,728 putative fusions candidates were identified: these were filtered according to the depicted algorithm to ultimately identify 282 gene fusions within 47 HPV positive OPSCC primary tumors. Further validation with qRT-PCR was performed on selected gene fusions.
Next the candidate fusions were visualized in the Integrative Genome Viewer (IGV, Broad Institute, version 2.3.36,20 and the fusions were included if one or more of the following conditions were met: the fusion (1) spanned across different chromosomes, (2) connected exons of two different known genes, (3) connected exons of the same gene but in reverse order, (4) changed strands, (5) connected introns or non-coding regions of a gene in reverse order, that is, read out of frame, or (6) connected a noncoding region to a transcribed region of a gene in frame, but spanning across a distance of >200,000 bp. The putative fusions were excluded if they (1) connected exons of the same gene in frame, or (2) connected non-coding regions surrounding the gene (possible alternative start or end site for the gene) in frame at distance <200,000 bp.
Comparison with TCGA data
MapSplice was also used by TCGA to identify fusions in HNSCC tumors.10,19 The data regarding fusions, genes associated with fusions and coverage read counts for each tumor were obtained from Supporting Information 3.1.8 published in the TCGA paper.10 The analysis was restricted to the 36 HPV-positive tumors. Fusions identified in TCGA were again required to have a read coverage greater than five per tumor for inclusion. Because the fusions were not analyzed within normal tissue in TCGA, no comparisons were made between tumor and normal tissue.
Gene expression analysis
Gene expression values were quantified using transcript models based on the TCGA methods using RSEM version 1.2.9 and upper quartile normalized, according to the TCGA normalization protocol.10,21 The gene expression values of donor (the first gene in the fusion) and acceptor (the second gene in the fusion) genes of a fusion were compared between tumors with the fusion of interest and normal tissue, and the log fold change of gene expression was compared. Based on the distribution of log fold change values among all genes analyzed, log fold change values that were greater than two standard deviations above or below the median were identified as significant. Next, the overall gene expression was compared between normal tissue and all primary tumor samples using a Wilcoxon test and adjusted for false discovery rate (FDR) using Benjamini–Hochberg correction.22
PCR validation
Selected gene fusions were validated using RT-PCR and Sanger sequencing. The primer pairs were designed for each fusion, with primer sequences flanking the fusion, using the assistance of Integrated DNA Technologies PrimerQuest tools (Supporting Information Table 1). The RNA was isolated using the protocol described above. Reverse transcription to generate the cDNA was performed using the High Capacity cDNA Reverse Transcription Kit (Applied Biosystems, Forster City, CA). The DNA was isolated from similarly prepared 0.35 mm thick frozen tissue cuts, which were digested in a 1% SDS (Sigma-Aldrich, St. Louis, MO) and 50 μg/mL proteinase K (Invitrogen, Carlsbad, CA) solution at 48°C for 48 hrs. The DNA was then purified by phenol-chloroform extraction and ethanol precipitation. Touchdown PCR was performed using DNA or cDNA isolated from the tumors harboring the fusion of interest, based on sequencing analysis. The DNA and cDNA isolated from UPPP specimens were used as negative controls. The PCR products of correct length based upon primer design were purified, and Sanger sequencing was performed. The sequences were aligned to donor and acceptor genes to map and confirm gene fusions using the GRCh37/hg19 genome assembly.
Results
Characterization of fusions
Using MapSplice alignment algorithms, 21,728 putative fusion events were identified in 47 HPV-positive oropharynx tumor samples (Clinical data, Supporting Information Table 2). We applied the filtering algorithm summarized in Figure 1. After filtering to require read coverage to be five or greater, 9,678 putative fusions remained. Next, fusions occurring in normal samples were removed, leaving 4,852 putative events. Then, when requiring fusions to map to either two different genes, between a gene and a noncoding region, or to be read out of frame, 294 fusions remained. Of these, 282 could be confirmed using IGV visualization (Supporting Information Tables 3 and 4). Notably, 29 fusions mapping to the same gene were retained because the fusion was read out of frame.
Of the 282 fusions identified from 47 HPV-positive OPSCC tumors (Supporting Information Table 4), 219 (77.7%) were intra-chromosomal and 63 (22.3%) were inter-chromosomal. The distribution of fusions per tumor showed that a majority of tumors (45, 95.7%) harbored at least one fusion. The median number of fusions per tumor was five (standard deviation 8.6, range 0–34). The frequency of fusions was analyzed showing that most (240, 85.1%) fusions were unique, occurring only in a single tumor. The remaining fusions recurred in between 2 and 16 tumors. About half of the gene fusions identified (51.4%) involved a non-coding region (denoted as “NA”) at either the donor or acceptor end of the fusion, and 38.3% of fusions involved two unique genes. Of gene fusions involving a non-coding region, 25 (17.2%) spanned across different chromosomes, and 10 (6.9%) involved a strand switch.
Comparison with TCGA
The set of 282 gene fusions was then compared to gene fusions that were identified through TCGA.10 Similar to the distribution seen in our filtered cohort, 80% of these gene fusions were intra-chromosomal. Of the 13,759 fusion events, there were 4,821 unique gene fusions. Within HPV-positive tumors of TCGA, 759 unique fusions were identified. To harmonize our algorithm filters, fusions with read coverage less than five were removed from the TCGA fusions, and this left 281 fusions. When fusions lists were compared, 10 gene fusions were found to overlap between the two cohorts (Table 1). These overlapping gene fusions included the previously published FGFR3-TACC3 gene fusion (chr4~chr4:1808661-1741429).10,14,15 While this exact gene fusion was only identified in one tumor in TCGA, another fusion between these two genes was identified in a second HPV-positive tumor in TCGA. The other gene fusions identified with overlap in TCGA were: NA-PDE4DIP, NA-STOX2, KRT14-KRT16, NA-CYP19A1, TFG-GPR128, ZNF750-TBCD, CASZ1-CTNNBIP1, FTO-NA and SHANK3-NA.
Table 1.
Fusions with overlap in TCGA HPV-positive cohort
| Fusion name and location | Donor gene | Acceptor gene | # tumors in TCGA (n = 36) | # tumors in JHU (n = 47) |
|---|---|---|---|---|
| chr1~chr1:143743240-145004783 | – | PDE4DIP | 12 | 1 |
| chr4~chr4:184719208-184922478 | – | STOX2 | 6 | 11 |
| chr17~chr17:39743011-39768876 | KRT14 | KRT16 | 6 | 1 |
| chr15~chr15:51329878-51570180 | – | CYP19A1 | 5 | 14 |
| chr3~chr3:100438902-100348442 | TFG | GPR128 | 1 | 3 |
| chr4~chr4:1808661-1741429 | FGFR3 | TACC3 | 1 | 1 |
| chr17~chr17:80797803-80828100 | ZNF750 | TBCD | 1 | 1 |
| chr1~chr1:10753931-9908376 | CASZ1 | CTNNBIP1 | 1 | 1 |
| chr16~chr16:53968021-54685487 | FTO | – | 1 | 1 |
| chr22~chr16:51144580-79639434 | SHANK3 | – | 1 | 1 |
BOLD indicates gene fusion associated with gene expression change. Absent gene names, depicted with a dash, indicate fusion to a non-coding region. Fusion genome positions are based on GRCh37/hg19 assembly.
Gene expression changes
In order to elucidate whether the identified gene fusions may have potential functional implications, the mRNA expression of genes involved in the identified gene fusions was analyzed. The 282 gene fusions involved 318 unique genes, of which 306 had gene expression data available. Expression of these genes was compared between tumors harboring a fusion involving the gene of interest and normal tissue. The median ratio of gene expression in tumors with fusions compared to normal tissue was 1.24. A majority of genes (63.7%, n = 195) showed increased expression in association with a fusion. Sixteen genes, including EGFR, ERBB4, KRT14 and KRT19, showed significant up regulation in association with a fusion, and 4 genes (SLCO5A1, DLG2, ZNF750 and PTPRT) showed significant down regulation (Table 2). Although not statistically significant, PTEN also showed down regulation in association with a fusion, with a log fold change of −1.85. The median gene expression in tumors lacking a fusion in the gene of interest is also shown in Table 2. In fusions associated with over-expression, gene expression was uniformly higher in tumors with a fusion compared to median expression of tumors without a fusion. Similarly, in fusions associated with decreased gene expression, expression was 5–29 times lower in tumors with a fusion compared to the median expression of tumors without a fusion.
Table 2.
Genes with significant changes in expression in association with a fusion
| Gene | Associated Fusion | # tumors | Fusion genes | Median expression non-fusion tumors | Median expression in fusion tumors | Median expression in normal | Ratio (Expression in fusion tumors vs. normal) | Log fold change |
|---|---|---|---|---|---|---|---|---|
| ANKRD30A | chrl0~chrl0:37531775-37507908 | 1 | NA-ANKRD30A | 1.54 | 14444.9 | 0.87 | 16521.6 | 14.01 |
|
| ||||||||
| GPR128 | chr3~chr3:100438902-100348442 | 3 | TFG-GPR128 | 5.90 | 877.8 | 0.87 | 1004.1 | 9.97 |
|
| ||||||||
| DDC | chr7~chrl6:50570392-85822656 | 1 | DDC-EMC8 | 1.23 | 330.6 | 1.3 | 254.8 | 7.99 |
|
| ||||||||
| DNAH12 | chr3~chr3:56916320-57469238 | 1 | ARHGEF3-DNAH12 | 6.40 | 708.3 | 3.9 | 181.9 | 7.51 |
|
| ||||||||
| LIPJ | chrl0~chrl 0:89653866-90347023 | 1 | PTEN-LIPJ | 1.02 | 165.7 | 0.99 | 166.0 | 7.38 |
|
| ||||||||
| FSIP1 | chrl5~chrl 5:39893046-39363809 | 1 | FSIP1-NA | 16.0 | 1231.2 | 9.7 | 126.5 | 6.98 |
|
| ||||||||
| EGFR | chr7~chr7:55 275013-55275104 | 3 | EGFR-NA | 3255.0 | 107486.5 | 1601.7 | 67.1 | 6.07 |
|
| ||||||||
| ERBB4 | chr20~chr2:48330113-212812341 | 1 | B5GALT4-ERBB4 | 22.4 | 1942.3 | 34.4 | 56.5 | 5.82 |
|
| ||||||||
| TBCD | chr7~chrl7:106888841-80739465 | 1 | COG5-TBCD | 1307.5 | 16879.5 | 1118.3 | 24.0 | 4.59 |
|
| ||||||||
| DNAH17 | chrl7~chrl7:38640736-76459159 | 1 | TNS4-DNAH17 | 64.5 | 1240.8 | 56.8 | 21.8 | 4.45 |
|
| ||||||||
| CYP19A1 | chrl5~chrl5:513 29878-51570180 | 14 | CYP19A1-NA | 98.0 | 213.4 | 9.9 | 21.4 | 4.42 |
|
| ||||||||
| KRT14 | chrl7~chrl7:39743011-39768876 | 1 | KRT14-KRT16 | 6041.1 | 116311.2 | 5974.2 | 19.5 | 4.28 |
|
| ||||||||
| KRT14 | chrl2~chrl7:99067236-39738532 | 1 | APAF1-KRT14 | 6041.1 | 116311.2 | 5974.2 | 19.5 | 4.28 |
|
| ||||||||
| DNAH6 | chr2~chr2:85361573-84806651 | 1 | TCF7L1-DNAH6 | 52.6 | 921.9 | 49.8 | 18.5 | 4.21 |
|
| ||||||||
| KRT19 | chrl7~chrl7:39781583-39683411 | 1 | NA-KRT19 | 16611.3 | 68856.2 | 3968.1 | 17.4 | 4.12 |
|
| ||||||||
| CSMD1 | chr8~chr8:4970998-4495080 | 1 | NA-CSMD1 | 41.2 | 472.2 | 27.5 | 17.2 | 4.10 |
|
| ||||||||
| CD274 | chr9~chr9:5466829-6068218 | 1 | CD274-NA | 290.5 | 2668.2 | 163.3 | 16.3 | 4.03 |
|
| ||||||||
| SLC05A1 | chr8~chr6:70645842-144692159 | 1 | SLC05A1-UTRN | 65.8 | 10.0 | 118.0 | 0.0845 | −3.56 |
| DLG2 | chr11~chrl7:85195030-33478336 | 1 | DLG2-UNC45B | 53.6 | 9.3 | 153.0 | 0.0610 | −4.03 |
| ZNF750 | chrl7~chrl7:80797803-80828100 | 1 | ZNF750-TBCD | 1203.9 | 41.1 | 1434.7 | 0.0287 | −5.13 |
| PTPRT | chr20~chr20:32581937-41199932 | 1 | RALY-PTPRT | 43.9 | 1.6 | 89.7 | 0.0182 | −5.78 |
Gene expression was compared between tumors harboring a fusion and normal tissue. Log transformed ratios were compared, and transformed ratios that were greater than two standard deviations above or below the median are shown. Sixteen genes were associated with overexpression in the presence of a fusion, and four genes were associated with underexpression (grey, bottom). Fusion genome positions are based on GRCh37/hg19 assembly.
Notably, three fusions associated with significant gene expression changes were also identified in the TCGA cohort (TFG-GPR128, ZNF750-TBCD and KRT14-KRT16, with differential expression in underlined gene). Two genes, GPR128 and ZNF750, showed parallel gene expression changes in TCGA. The TFG-GPR128 fusion was associated with increased expression of GPR128 (ratio of gene expression in tumor with fusion compared to median of normal: 580.5 in TCGA vs. 1004.1 in JHU cohort). There was also decreased expression of ZNF750 in the presence of the ZNF750-TBCD fusion in both cohorts (ratio: 0.142 in TCGA vs. 0.0287 in JHU). The KRT14-KRT16 gene fusion was not associated with overexpression of KRT14 in TCGA (ratio: 0.466 in TCGA vs. 19.5 in JHU). However, the tumor with the KRT14-KRT16 fusion in the JHU cohort that showed increased expression of KRT14 also harbored an APAF1-KRT14 fusion, which was not identified in the TCGA cohort.
Next, genes with significant changes in expression were compared globally between all tumors and normal samples. The 16 genes up regulated in association with a fusion were analyzed in the full cohort of tumor and normal samples. Gene expression of these genes was up regulated across tumor samples compared to normal tissue, with statistically significant up regulation in seven (43%) of these genes (Fig. 2a). Tumors with a fusion had the maximum gene expression of the cohort in 13 (81.3%) of the up-regulated genes. A similar comparison was performed on the four genes with down regulation in association with a fusion, and three genes (75%) showed statistically significant down regulation in tumors (Fig. 2b). Similarly, tumors with a fusion in a down regulated gene had the lowest gene expression of the cohort in 75% of the genes.
Figure 2.
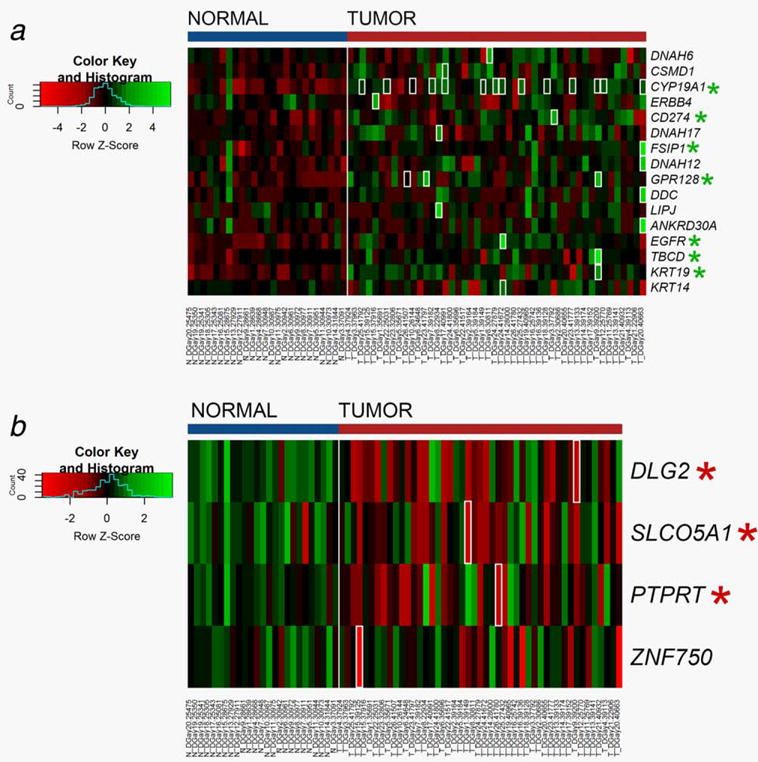
Heatmap of overall gene expression in normal tissue compared to tumors. Gene expression values are calculated based on the log transform of RSEM values determined from RNA sequencing analysis. High expression is depicted by green; low expression is depicted by red, normalized by row z scores (legend). Tumors with a fusion in the gene of interest are outlined in white. Genes with significant differences in expression between tumor and normal are marked with asterisk. (a) Overall gene expression of genes associated with overexpression in association with a fusion (b) Overall gene expression of genes associated with underexpression in association with a fusion.
RT-PCR Validation
Six fusions were selected for RT-PCR validation in primary tumor samples. Fusions selected for validation were restricted to those involving two genes, and those with either overlap with TCGA or associated with significant changes in gene expression. Using these criteria, we selected the following six fusions for validation: FGFR3-TACC3, TFG-GPR128, PTEN-LIPJ, BGALT-ERBB4, ZNF750-TBCD and RALY-PTPRT (Table 3).
Table 3.
Gene fusions selected for validation
| Fusion | Intra chrom | Donor gene | Gene expression log fold change | Acceptor gene | Gene expression log fold change | TCGA overlap | # tumors | Validated |
|---|---|---|---|---|---|---|---|---|
| chr3~chr3:100438902-100348442 | N | TFG | 0.243 | GPR128 | 9.97 | Y | 3 | Y |
| chr4~chr4:1808661-1741429 | N | FGFR3 | 2.61 | TACC3 | 1.39 | Y | 1 | Y |
| chr17~chr17:80797803-80828100 | N | ZNF750 | −5.13 | TCBD | 1.82 | Y | 1 | N |
| chr20~chr2:48330113-212812341 | Y | B4GALT5 | 0.71 | ERBB4 | 5.82 | N | 1 | Y |
| chr10~chr10:89653866-90347023 | N | PTEN | −1.85 | LIPJ | 7.38 | N | 1 | Y |
| chr20~chr20:32581937-41199932 | N | RALY | 1.94 | PTPRT | −5.78 | N | 1 | Y |
BOLD indicates statistically significant gene expression change.
Intrachrom indicates gene fusion spanning across different chromosomes. Gene expression log fold change (between tumors harboring a fusion and normal tissue) is shown for both donor and acceptor genes.
Using RNA from the tumors identified to harbor each fusion, five fusions could be validated using RT-PCR and Sanger sequencing (Fig. 3). Additionally, one of these fusions (FGFR3-TACC3) was also able to be validated in tumor DNA, which identified the location of the fusion alteration at the intronic DNA level. Sequencing showed that this fusion occurred within the intron before the last exon of FGFR3, then reversed the order of the genes, connecting to TACC3 in the intron prior to the last five exons. The Sanger sequencing revealed matching sequences with a single base pair insertion between fused sequences. The PTEN-LIPJ gene fusion included the first two exons of PTEN, skipped an intervening gene RLNS, and connected to the second exon of LIPJ. The BGALT5-ERBB4 gene fusion connected the first exon of BGALT4 on chromosome 20 to the third exon of ERBB4 on chromosome 2. The TFG-GPR128 gene fusion was identified between the third exon of TFG and the second exon of GPR128, also reversing the order of the genes. Lastly, the RALY-PTPRT gene fusion connected the first exon of RALY to the 7th intron of PTPRT, spanning a distance of 8 Mb across chromosome 20.
Figure 3.
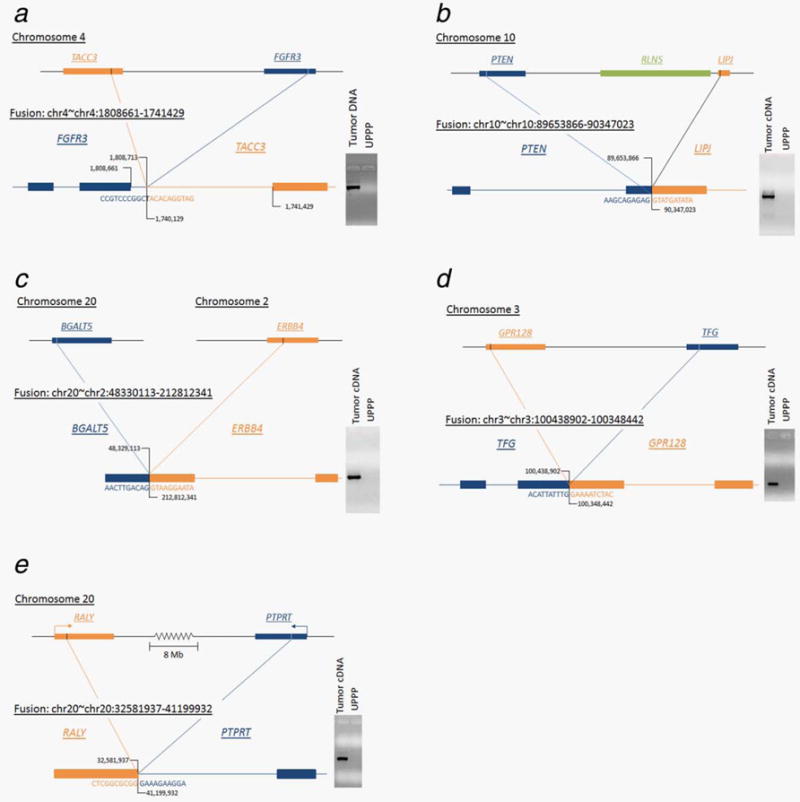
Validated gene fusions with mapping. (a) FGFR3-TACC3 gene fusion mapped where the fusion product cut off the last exon of FGFR3 and included the last 5 exons of TACC3 with an intervening single base pair insertion. This fusion was detectable in the both RNA and DNA with the fusion mapping in the intron. (b) PTEN-LIPJ gene fusion where the fusion product included the first two exons of PTEN connecting to the second exon of LIPJ. (c) BGALT-ERBB4 gene fusion mapped across chromosomes 2 and 20 where the fusion product included the first exon of BGALT4 connected to the third exon of ERBB4. (d) TFG-GPR128 gene fusion mapped where the gene fusion product connected the third exon of TFG to the second exon of GPR128. (e) RALY-PTPRT gene fusion mapped from first exon of RALY to the 7th intron of PTPRT spanning a distance of >8 Mb along chromosome 20.
Discussion
Our understanding of gene fusions in the setting of heterogeneous solid tumors has grown substantially, boosted by the advent of next generation sequencing.23,24 The potential benefits of characterizing solid tumor gene fusions include both therapeutic and diagnostic applications. Gene fusions that result in activation of relevant oncogenes, such as those in protein kinases which were recently identified in several cancer types through TCGA,25 could represent potential therapeutic targets, as exemplified by the use of Imantinib to target the BCR-ABL1 fusion.26 For instance, the FGFR3-TACC3 gene fusion has been identified in multiple cancer types14–17 and has been shown to display oncogenic activity in in vivo models.27,28 Additionally given that gene fusions are unique to tumors, they also have the potential to be utilized as biomarkers for noninvasive diagnosis29 or evaluation of prognosis.12 In this study, we also highlight how correlation of gene expression analysis with identified fusions can prioritize functionally relevant genes.
To date, TCGA has been the first study to report gene fusions present in HPV-related head and neck cancer.10,25 To expand on this study, we performed a comprehensive analysis of gene fusions in a larger independent cohort of HPV-positive OPSCC tumors with additional biologic validation. In this data set, few gene fusions were frequently recurring, and these fusions primarily were associated with a noncoding partner. Instead, most gene fusions were sporadic, occurring in a single tumor. However, ten gene fusions that were identified in our cohort could also be independently validated in TCGA.
The identification of gene fusions using RNA-seq still remains a computational challenge with potential for misalignment allowing for false positive results.24,25,30,31 Our current study utilizes some strategies published in the literature, including requiring a minimum read coverage18,25 and categorizing fusion reads in normal tissue as misalignments.32 These challenges also highlight the importance of biologic validation for the detection of gene fusions in primary tissue, which was not performed in prior publications of TCGA data. Using gene expression changes to prioritize gene fusions of interest, we selected six gene fusion for validation, and five of six (83%) could be validated in primary tumor RNA. One gene fusion, which was associated with down regulation of gene expression, was not able to validated using PCR methods, potentially related to the decrease in overall expression. Additionally, one gene fusion (FGFR3-TACC3) was able to be validated in both DNA and RNA, likely due to a relatively short intronic sequence (<1.5 kb) which enabled amplification of a viable PCR product. As not all fusions were subjected to validation, the current study is limited by similar potential for false positive results. For instance, gene fusions which included a non-coding region represented 51.4% (n = 145) of the gene fusions identified. These putative fusions could potentially represent undocumented splice variants, although 25 of these fusions were intra-chromasomal, 10 involved a strand switch, and 20 spanned a distance >1,000,000 bases.
Another limitation in this study is that the identified gene fusions were primarily private, occurring only in a single tumor. However, this phenomenon has been observed in other solid tumors.33–35 In contrast, gene expression changes associated with these fusions were observed to be pervasive among the whole tumor cohort. Genes with up regulation in the presence of a fusion, such as EGFR and TBCD, were also up regulated in tumors as a whole when compared to normal tissue. These gene expression changes were augmented in the presence of a fusion, as tumors with a fusion had the highest level of gene expression among the tumor cohort in 81% of up-regulated genes and lowest expression in 75% of down-regulated genes. The fusion may represent one mechanism of gene activation or suppression, where other tumors without a fusion may rely on other mechanisms to achieve gene expression changes, including transcriptional, genomic, and epigenetic alterations. For instance, the gene PTPRT was seen to be down regulated in association with a gene fusion, but PTPRT was also significantly down regulated in tumors without a gene fusion. This could be mediated by frequent promoter hypermethylation of PTPRT, which has been reported in HNSCC tumors.36
Some particularly relevant genes appear in the list of genes that are affected by the presence of a gene fusion including EGFR, ERBB4, ZNF750 and PTPRT. These results suggest a potential functional role in HPV-positive OPSCC. Additionally, although not statistically significant, PTEN was also observed to be down regulated in the presence of a gene fusion that was biologically validated. EGFR has long been recognized as a functionally relevant gene in HNSCC with overexpression in up to 90% of tumors,37 and it remains the only gene targeted by an FDA-approved therapy for HNSCC. ERBB4, or HER4, is another member of the epidermal growth factor tyrosine kinase receptor family, and the related ERBB2 is mutated in 4% of HNSCC tumors.10 ZNF750 regulates late epidermal differentiation by inhibiting progenitor genes,38,39 and mutations were identified in 4% of the TCGA HNSCC cohort10 as well as in esophageal SCC.40 PTPRT is a negative regulator of STAT3 signaling,41 and inhibition of this gene has reported in HNSCC tumors through promoter hypermethylation in HNSCC tumors36 as well as inactivating mutations in both HNSCC and colorectal tumors.42,43 Several other relatively unexplored gene candidates were identified, including genes in the dynein family (DNAH6, DNAH12, DNAH17) and tubulin cofactor (TBCD), which may play roles in centromere formation44 and intracellular transport of molecules, including p53.45 Future studies may further elucidate the functional role of these fusion candidates.
In conclusion, RNA sequencing analysis of 47 HPV-positive OPSCC primary tumors revealed 282 gene fusions, 10 of which were also present in the TCGA cohort. By integrating gene expression analysis, the most relevant gene fusions were prioritized, and the potential functional role of these gene fusions were elucidated. Furthermore, identification of gene fusions can highlight globally relevant genes in which tumors have utilized gene fusions as a mechanism for gene activation or suppression. This is supporting evidence that gene fusions in HPV-positive OPSCC may be one mechanism by which functionally relevant gene targets are altered.
Supplementary Material
What’s new?
The Cancer Genome Atlas (TCGA), a national sequencing project to investigate genetic changes in cancer, predicted the presence of nearly 14,000 gene fusion events in head and neck squamous cell carcinoma (HNSCC). Now, a major challenge is to determine which of those fusions are functionally relevant. Here, in an independent cohort of human papillomavirus (HPV)-positive oropharyngeal SCCs, some 282 gene fusions, 10 of which overlapped with previous TCGA findings, were identified by RNA sequencing. While fusions were limited to a small number of tumors, fusion-associated changes in gene expression were pervasive. Moreover, gene expression analyses illuminated potential functional roles for identified fusions.
Acknowledgments
Grant sponsor: National Institute of Dental and Craniofacial Research and National Institute of Health; Grant number: R01 DE023347 (to J.A.C.); Grant sponsor: National Institute of Dental and Craniofacial Research and National Cancer Institute; Grant number: P50 DE 019032 (to J.A.C.); Grant sponsor: National Institute of Dental Craniofacial Research Training; Grant number: 2T32DC000027-26 (to T.G.)
Abbreviations
- HNSCC
head and neck squamous cell carcinoma
- HPV
human papillomavirus
- OPSCC
oropharyngeal squamous cell carcinoma
- RT-PCR
reverse transcription polymerase chain reaction
- TCGA
the Cancer Genome Atlas
- UPPP
uvulopalatopharyngoplasty
Footnotes
Additional Supporting Information may be found in the online version of this article
References
- 1.Siegel RL, Miller KD, Jemal A. Cancer statistics, 2015. CA Cancer J Clin. 2015;65:5–29. doi: 10.3322/caac.21254. [DOI] [PubMed] [Google Scholar]
- 2.Warnakulasuriya S. Global epidemiology of oral and oropharyngeal cancer. Oral Oncol. 2009;45:309–16. doi: 10.1016/j.oraloncology.2008.06.002. [DOI] [PubMed] [Google Scholar]
- 3.Simard EP, Ward EM, Siegel R, et al. Cancers with increasing incidence trends in the United States: 1999 through 2008. CA Cancer J Clin. 2012;62:118–28. doi: 10.3322/caac.20141. [DOI] [PubMed] [Google Scholar]
- 4.Chaturvedi AK, Engels EA, Anderson WF, et al. Incidence trends for human papillomavirus-related and -unrelated oral squamous cell carcinomas in the United States. J Clin Oncol. 2008;26:612–9. doi: 10.1200/JCO.2007.14.1713. [DOI] [PubMed] [Google Scholar]
- 5.Ang KK, Harris J, Wheeler R, et al. Human papillomavirus and survival of patients with oropharyngeal cancer. N Engl J Med. 2010;363:24–35. doi: 10.1056/NEJMoa0912217. [DOI] [PMC free article] [PubMed] [Google Scholar]
- 6.Argiris A, Li S, Ghebremichael M, et al. Prognostic significance of human papillomavirus in recurrent or metastatic head and neck cancer: an analysis of Eastern Cooperative Oncology Group trials. Ann Oncol. 2014;25:1410–6. doi: 10.1093/annonc/mdu167. [DOI] [PMC free article] [PubMed] [Google Scholar]
- 7.Mirghani H, Amen F, Blanchard P, et al. Treatment de-escalation in HPV-positive oropharyngeal carcinoma: ongoing trials, critical issues and perspectives. Int J Cancer. 2015;136:1494–503. doi: 10.1002/ijc.28847. [DOI] [PubMed] [Google Scholar]
- 8.Agrawal N, Frederick MJ, Pickering CR, et al. Exome sequencing of head and neck squamous cell carcinoma reveals inactivating mutations in NOTCH1. Science. 2011;333:1154–7. doi: 10.1126/science.1206923. [DOI] [PMC free article] [PubMed] [Google Scholar]
- 9.Stransky N, Egloff AM, Tward AD, et al. The mutational landscape of head and neck squamous cell carcinoma. Science. 2011;333:1157–60. doi: 10.1126/science.1208130. [DOI] [PMC free article] [PubMed] [Google Scholar]
- 10.Cancer Genome Atlas N. Comprehensive genomic characterization of head and neck squamous cell carcinomas. Nature. 2015;517:576–82. doi: 10.1038/nature14129. [DOI] [PMC free article] [PubMed] [Google Scholar]
- 11.Maher CA, Kumar-Sinha C, Cao X, et al. Transcriptome sequencing to detect gene fusions in cancer. Nature. 2009;458:97–101. doi: 10.1038/nature07638. [DOI] [PMC free article] [PubMed] [Google Scholar]
- 12.Mitani Y, Rao PH, Futreal PA, et al. Novel chromosomal rearrangements and break points at the t(6;9) in salivary adenoid cystic carcinoma: association with MYB-NFIB chimeric fusion, MYB expression, and clinical outcome. Clin Cancer Res. 2011;17:7003–14. doi: 10.1158/1078-0432.CCR-11-1870. [DOI] [PMC free article] [PubMed] [Google Scholar]
- 13.Gao R, Cao C, Zhang M, et al. A unifying gene signature for adenoid cystic cancer identifies parallel MYB-dependent and MYB-independent therapeutic targets. Oncotarget. 2014;5:12528–42. doi: 10.18632/oncotarget.2985. [DOI] [PMC free article] [PubMed] [Google Scholar]
- 14.Yuan L, Liu ZH, Lin ZR, et al. Recurrent FGFR3-TACC3 fusion gene in nasopharyngeal carcinoma. Cancer Biol Ther. 2014;15:1613–21. doi: 10.4161/15384047.2014.961874. [DOI] [PMC free article] [PubMed] [Google Scholar]
- 15.Wang R, Wang L, Li Y, et al. FGFR1/3 tyrosine kinase fusions define a unique molecular subtype of non-small cell lung cancer. Clin Cancer Res. 2014;20:4107–14. doi: 10.1158/1078-0432.CCR-14-0284. [DOI] [PubMed] [Google Scholar]
- 16.Xiang L, Li J, Jiang W, et al. Comprehensive analysis of targetable oncogenic mutations in chinese cervical cancers. Oncotarget. 2015;6:4968–75. doi: 10.18632/oncotarget.3212. [DOI] [PMC free article] [PubMed] [Google Scholar]
- 17.Bao ZS, Chen HM, Yang MY, et al. RNA-seq of 272 gliomas revealed a novel, recurrent PTPRZ1-MET fusion transcript in secondary glioblastomas. Genome Res. 2014;24:1765–73. doi: 10.1101/gr.165126.113. [DOI] [PMC free article] [PubMed] [Google Scholar]
- 18.Edgren H, Murumagi A, Kangaspeska S, et al. Identification of fusion genes in breast cancer by paired-end RNA-sequencing. Genome Biol. 2011;12:R6. doi: 10.1186/gb-2011-12-1-r6. [DOI] [PMC free article] [PubMed] [Google Scholar]
- 19.Wang K, Singh D, Zeng Z, et al. MapSplice: accurate mapping of RNA-seq reads for splice junction discovery. Nucleic Acids Res. 2010;38:e178. doi: 10.1093/nar/gkq622. [DOI] [PMC free article] [PubMed] [Google Scholar]
- 20.Robinson JT, Thorvaldsdottir H, Winckler W, et al. Integrative genomics viewer. Nat Biotechnol. 2011;29:24–6. doi: 10.1038/nbt.1754. [DOI] [PMC free article] [PubMed] [Google Scholar]
- 21.Li B, Dewey CN. RSEM: accurate transcript quantification from RNA-Seq data with or without a reference genome. BMC Bioinformatics. 2011;12:323. doi: 10.1186/1471-2105-12-323. [DOI] [PMC free article] [PubMed] [Google Scholar]
- 22.Benjamini Y, Hochberg Y. Controlling the false discovery rate—a practical and powerful approach to multiple testing. J R Stat Soc B Met. 1995;57:289–300. [Google Scholar]
- 23.Mitelman F, Johansson B, Mertens F. The impact of translocations and gene fusions on cancer causation. Nat Rev Cancer. 2007;7:233–45. doi: 10.1038/nrc2091. [DOI] [PubMed] [Google Scholar]
- 24.Xuan J, Yu Y, Qing T, et al. Next-generation sequencing in the clinic: promises and challenges. Cancer Lett. 2013;340:284–95. doi: 10.1016/j.canlet.2012.11.025. [DOI] [PMC free article] [PubMed] [Google Scholar]
- 25.Yoshihara K, Wang Q, Torres-Garcia W, et al. The landscape and therapeutic relevance of cancer-associated transcript fusions. Oncogene. 2015;34:4845–54. doi: 10.1038/onc.2014.406. [DOI] [PMC free article] [PubMed] [Google Scholar]
- 26.Druker BJ, Talpaz M, Resta DJ, et al. Efficacy and safety of a specific inhibitor of the BCR-ABL tyrosine kinase in chronic myeloid leukemia. N Engl J Med. 2001;344:1031–7. doi: 10.1056/NEJM200104053441401. [DOI] [PubMed] [Google Scholar]
- 27.Parker BC, Annala MJ, Cogdell DE, et al. The tumorigenic FGFR3-TACC3 gene fusion escapes miR-99a regulation in glioblastoma. J Clin Invest. 2013;123:855–65. doi: 10.1172/JCI67144. [DOI] [PMC free article] [PubMed] [Google Scholar]
- 28.Singh D, Chan JM, Zoppoli P, et al. Transforming fusions of FGFR and TACC genes in human glioblastoma. Science. 2012;337:1231–5. doi: 10.1126/science.1220834. [DOI] [PMC free article] [PubMed] [Google Scholar]
- 29.Hessels D, Smit FP, Verhaegh GW, et al. Detection of TMPRSS2-ERG fusion transcripts and prostate cancer antigen 3 in urinary sediments may improve diagnosis of prostate cancer. Clin Cancer Res. 2007;13:5103–8. doi: 10.1158/1078-0432.CCR-07-0700. [DOI] [PubMed] [Google Scholar]
- 30.Wang Q, Xia J, Jia P, et al. Application of next generation sequencing to human gene fusion detection: computational tools, features and perspectives. Brief Bioinform. 2013;14:506–19. doi: 10.1093/bib/bbs044. [DOI] [PMC free article] [PubMed] [Google Scholar]
- 31.Carrara M, Beccuti M, Lazzarato F, et al. State-of-the-art fusion-finder algorithms sensitivity and specificity. BioMed Res Int. 2013;2013:340620. doi: 10.1155/2013/340620. [DOI] [PMC free article] [PubMed] [Google Scholar]
- 32.Kim D, Salzberg SL. TopHat-fusion: an algorithm for discovery of novel fusion transcripts. Genome Biol. 2011;12:R72. doi: 10.1186/gb-2011-12-8-r72. [DOI] [PMC free article] [PubMed] [Google Scholar]
- 33.Berger MF, Levin JZ, Vijayendran K, et al. Integrative analysis of the melanoma transcriptome. Genome Res. 2010;20:413–27. doi: 10.1101/gr.103697.109. [DOI] [PMC free article] [PubMed] [Google Scholar]
- 34.Ha KC, Lalonde E, Li L, et al. Identification of gene fusion transcripts by transcriptome sequencing in BRCA1-mutated breast cancers and cell lines. BMC Med Genomics. 2011;4:75. doi: 10.1186/1755-8794-4-75. [DOI] [PMC free article] [PubMed] [Google Scholar]
- 35.Pflueger D, Terry S, Sboner A, et al. Discovery of non-ETS gene fusions in human prostate cancer using next-generation RNA sequencing. Genome Res. 2011;21:56–67. doi: 10.1101/gr.110684.110. [DOI] [PMC free article] [PubMed] [Google Scholar]
- 36.Peyser ND, Freilino M, Wang L, et al. Frequent promoter hypermethylation of PTPRT increases STAT3 activation and sensitivity to STAT3 inhibition in head and neck cancer. Oncogene. 2016;35:1163–9. doi: 10.1038/onc.2015.171. [DOI] [PMC free article] [PubMed] [Google Scholar]
- 37.Kalyankrishna S, Grandis JR. Epidermal growth factor receptor biology in head and neck cancer. J Clin Oncol. 2006;24:2666–72. doi: 10.1200/JCO.2005.04.8306. [DOI] [PubMed] [Google Scholar]
- 38.Boxer LD, Barajas B, Tao S, et al. ZNF750 interacts with KLF4 and RCOR1, KDM1A, and CTBP1/2 chromatin regulators to repress epidermal progenitor genes and induce differentiation genes. Genes Dev. 2014;28:2013–26. doi: 10.1101/gad.246579.114. [DOI] [PMC free article] [PubMed] [Google Scholar]
- 39.Sen GL, Boxer LD, Webster DE, et al. ZNF750 is a p63 target gene that induces KLF4 to drive terminal epidermal differentiation. Dev Cell. 2012;22:669–77. doi: 10.1016/j.devcel.2011.12.001. [DOI] [PMC free article] [PubMed] [Google Scholar]
- 40.Zhang L, Zhou Y, Cheng C, et al. Genomic analyses reveal mutational signatures and frequently altered genes in esophageal squamous cell carcinoma. Am J Hum Genet. 2015;96:597–611. doi: 10.1016/j.ajhg.2015.02.017. [DOI] [PMC free article] [PubMed] [Google Scholar]
- 41.Zhang X, Guo A, Yu J, et al. Identification of STAT3 as a substrate of receptor protein tyrosine phosphatase T. Proc Natl Acad Sci USA. 2007;104:4060–4. doi: 10.1073/pnas.0611665104. [DOI] [PMC free article] [PubMed] [Google Scholar]
- 42.Lui VW, Peyser ND, Ng PK, et al. Frequent mutation of receptor protein tyrosine phosphatases provides a mechanism for STAT3 hyperactivation in head and neck cancer. Proc Natl Acad Sci USA. 2014;111:1114–9. doi: 10.1073/pnas.1319551111. [DOI] [PMC free article] [PubMed] [Google Scholar]
- 43.Wang Z, Shen D, Parsons DW, et al. Mutational analysis of the tyrosine phosphatome in colorectal cancers. Science. 2004;304:1164–6. doi: 10.1126/science.1096096. [DOI] [PubMed] [Google Scholar]
- 44.Cunningham LA, Kahn RA. Cofactor D functions as a centrosomal protein and is required for the recruitment of the gamma-tubulin ring complex at centrosomes and organization of the mitotic spindle. J Biol Chem. 2008;283:7155–65. doi: 10.1074/jbc.M706753200. [DOI] [PubMed] [Google Scholar]
- 45.Giannakakou P, Sackett DL, Ward Y, et al. p53 is associated with cellular microtubules and is transported to the nucleus by dynein. Nat Cell Biol. 2000;2:709–17. doi: 10.1038/35036335. [DOI] [PubMed] [Google Scholar]
Associated Data
This section collects any data citations, data availability statements, or supplementary materials included in this article.