Abstract
The double helix is known to form as a result of hybridization of complementary nucleic acid strands in aqueous solution. In the helix the negatively charged phosphate groups of each nucleic acid strand are distributed helically on the outside of the duplex and are available for interaction with cationic groups. Cation-coated glass surfaces are now widely used in biotechnology, especially for covalent attachment of cDNAs and oligonucleotides as surface-bound probes on microarrays. These cationic surfaces can bind the nucleic acid backbone electrostatically through the phosphate moiety. Here we describe a simple method to fabricate DNA microarrays based upon adsorptive rather than covalent attachment of oligonucleotides to a positively charged surface. We show that such adsorbed oligonucleotide probes form a densely packed monolayer, which retains capacity for base pair-specific hybridization with a solution state DNA target strand to form the duplex. However, both strand dissociation kinetics and the rate of DNase digestion suggest, on symmetry grounds, that the target DNA binds to such adsorbed oligonucleotides to form a highly asymmetrical and unwound duplex. Thus, it is suggested that, at least on a charged surface, a non-helical DNA duplex can be the preferred structural isomer under standard biochemical conditions.
INTRODUCTION
Microarray technology has revolutionized applied genomics (1,2). It is based upon hybridization to form the Watson–Crick double helix as the result of a mixed phase reaction between complementary nucleic acid strands. The structure of the resulting double helix is determined, in part, by base pairing and base stacking, in conjunction with the constraints imposed on phosphodiester backbone conformation and sugar pucker. These interactions serve to define local base pairing and also the overall pitch of the helix. Although in solution the average pitch of the helix is nearly 10 bp, structural studies have revealed a high degree of variability and flexibility of pitch angle, including the prediction, based upon modeling, that a flat, non-helical ribbon-like structure might form under conditions of extreme mechanical distension (3–6; J.F.Marko, M.Feig and B.M.Pettitt, submitted for publication) or upon disruptive binding of an intercalator (7). Here we present results obtained in a microarray format demonstrating formation of a duplex with highly asymmetrical strand properties. Based upon symmetry analysis, it is concluded that on such a cationic microarray surface, at room temperature and under ordinary ion conditions, the preferred duplex structure may no longer be a helix.
MATERIALS AND METHODS
Aminosilanization of a glass surface
Pre-cleaned Gold Seal glass microslides (Gold Seal Products) were cleaned in deionized water, followed by rinsing in HPLC grade methanol and dried in a dust-free oven at 45°C. The slides were transferred to a vacuum oven at 82°C, equilibrated against 3-aminopropyltrimethoxysilane (Aldrich) in 1:2 proportion to p-xylene (Aldrich). The slides were then incubated overnight at 27 mm Hg, followed by storage at room temperature under dust-free conditions.
Fabrication of arrays
All oligodeoxyribonucleotides were synthesized, labeled with Cy3 or Cy5 fluorescent dyes at the 5′-end and HPLC purified by BioSource International (Camarillo, CA). A Microlab 4200 robot (Hamilton) with 10 µl syringes was used to print 6 × 8 arrays on aminosilanized glass slides: 10 nl volume per array element, 500 µm diameter, 900 µm center-to-center. Oligodeoxyribonucleotides were printed from 384 well plates (NUNC) at the desired concentration in 70% DMSO (Aldrich)/30% H2O. DMSO inclusion in the printing solution slowed the process of drying and therefore resulted in more uniform probe density within the array elements as compared to printing the probes in water. After printing, arrays were washed in 10 mM NaOH, 100 mM Na+ carbonate, 2% polyvinyl alcohol, 5× Denhardt’s for 1 min, then rinsed multiple times in deionized H2O and dried for storage. All procedures were performed at room temperature.
Hybridization and imaging
Hybridization was carried out in the following hybridization buffers: 90 mM Na+ carbonate, 5× Denhardt’s, pH 9.5, for 12mer targets and 60 mM Na+ carbonate, 5× Denhardt’s, 20% formamide, 0.6% polyvinyl alcohol, pH 9.5, for 24mer targets. The pH was held at 9.5 throughout in order to reduce surface charge due to free amino groups. Before hybridization the arrays were pretreated in corresponding hybridization buffers without the targets, containing 1.5% (w/v) polyvinyl alcohol (Aldrich), used as a blocking agent. All steps were done at room temperature. After 10 min hybridization, the slides were washed in corresponding hybridization buffers, rinsed several times in deionized water, dried and imaged. The arrays were imaged on a CCD-based ArrayWorx Imager (Applied Precision) with 10 µm resolution. Cy3 and Cy5 optical filters were used during imaging of the arrays. Exposure times were held at 0.2 s for the Cy3 channel and 1 s for the Cy5 channel, in order to normalize sensitivity. The analysis of intensities from the Cy3 and Cy5 channels was done with ArrayWorx v.1.50 software (Applied Precision) from the original stitched images and bar graphs were generated in Microsoft Excel. Pictures of representative arrays were modified by adjusting the levels in Adobe Photoshop 5.5 for presentation purposes only and the level adjustments did not have any effect on our conclusions, since quantification was based on the original images.
Calculation of target to probe ratio
For these experiments it was important to have a high target to probe ratio, therefore 12mer targets were hybridized at 5 µM concentration and 24mer targets were hybridized at 3 µM concentration, unless stated otherwise. The time course and concentration dependence experiments (not shown) have revealed that at such concentrations of the targets their signal was saturated on specific probes after 5 min hybridization. The target to probe ratio was measured based on calculation of the number of molecules from analysis of Cy5 signals before hybridization for probes, Cy3 signals after hybridization for targets and standard curves for Cy3- (not shown) and Cy5-labeled oligodeoxyribonucleotides (Fig. 1A). The standard curve for Cy5-wt-24-as (n = 56) was fitted by linear regression [log(Cy5 signal) = yo + a × log(no. of molecules)] in Sigma Plot 2000. The number of molecules was found from the known volume (10 nl/array element) and concentration of oligodeoxyribonucleotide in the printed solution per array element. The standard curves for Cy3-wt-24-s (n = 56) and Cy3-wt-12-s (n = 56) were fitted by linear regression [log(Cy3 signal) = yo + a × log(no. of molecules)] in Sigma Plot 2000. The regression curve for the Cy5-wt-24-as probe had values yo = –13.1, a = 1.58, R = 0.999, where R is the regression coefficient of the mean. The regression curves for targets Cy3-wt-24-s and Cy3-wt-12-s had values yo = –9.69, a = 1.29, R = 0.997 and yo = –13.7, a = 1.64, R = 0.999, respectively. The average background subtracted Cy5 signal of the Cy5-wt-24-as probe before hybridization was 332. Thus the number of Cy5-wt-24-as probe molecules per array element could be calculated from its regression equation: no. of probe molecules = 10 [{log(Cy5 signal) – yo}/a] = 10[{log(332) + 13.1}/1.58] = 7.7 × 10⁹. In the same way, the number of target molecules after hybridization was found to be 3.8 × 10⁹ for Cy3-wt-24-s and 7.8 × 10⁹ for Cy3-wt-12-s. Thus the target to probe ratios were 0.5 and 1 for 24 and 12 base target hybridizations to 24 base probes, respectively. The concentration of 24 base targets was not increased above 3 µM, because that would lead to a dramatic increase in background. The fact that a 5 µM concentration could be used for 12 base targets could be explained by the fact that longer nucleic acids have more negative charge and therefore are more strongly attracted to a positively charged surface. The ability of oligodeoxyribonucleotide probes adsorbed onto a positively charged surface to specifically hybridize to nucleic acid targets with a target to probe ratio approaching 1 had been shown previously by radioactive labeling of the targets (8).
Figure 1.
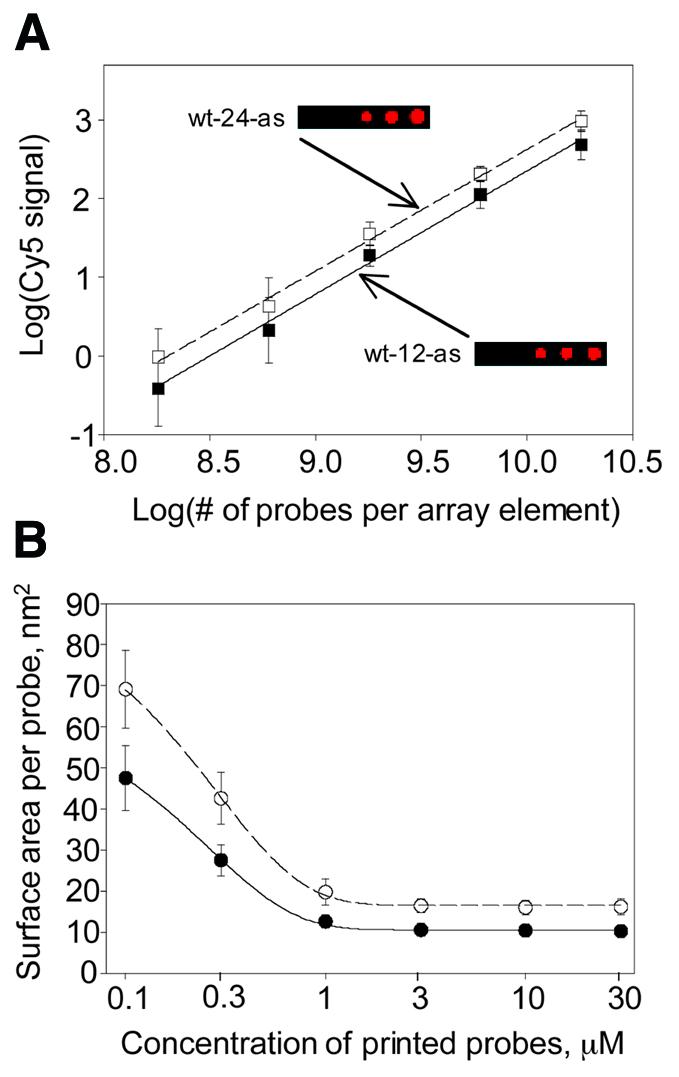
Non-covalent adsorption of DNA oligonucleotides on a positively charged surface. (A) Standard curves for a 12mer (filled squares) and a 24mer (open squares). Cy5-labeled probes were printed at 10 nl, then imaged without washing on an ArrayWorx imager (Applied Precision). The number of probe molecules per array element (x-axis) was calculated from the product of printed volume, probe concentration and Avogadro’s number. The y-axis represents log of the mean integrated value of Cy5 dye fluorescent signal from the array elements. Each data point represents the mean and a single standard deviation from the mean calculated from 56 array elements. (B) Surface area per oligonucleotide occupied by a 12mer (filled circles) or a 24mer (open circles). Cy5-labeled oligonucleotide probe was printed in 70% DMSO/30% H2O at 10 nl/array element, as a function of concentration on the aminosilanized glass surface, followed by washing to remove unbound probe. The y-axis was calculated by dividing the measured array element surface area by the number of adsorbed probe molecules per array element [calculated from standard curves in (A)]. Each data point represents the mean and a single standard deviation from the mean calculated from 56 array elements.
Dissociation experiments
After hybridization, the slides were washed five times in the corresponding hybridization buffer containing 1.5% (w/v) polyvinyl alcohol. They were then incubated for various times at room temperature in wash buffer containing 60 mM Na+ carbonate, 20% formamide for 12mers and 35% formamide for 24mers, 5× Denhardt’s, 0.6% polyvinyl alcohol, pH 9.5.
DNase protection assays
After hybridization, the slides were washed twice in the corresponding hybridization buffer containing 1.5% (w/v) polyvinyl alcohol, followed by brief application of DNase I digestion buffer containing 50 mM KCl, 10 mM MgCl2, 20 mM Tris–HCl, pH 8.0. The slides were then incubated for 20 min at room temperature in 0, 0.1, 1.0 or 10 U/µl DNase I (Roche) in the above buffer, rinsed eight times in the corresponding hybridization buffer containing 1.5% polyvinyl alcohol, then washed in deionized water, dried and imaged.
RESULTS
Adsorption of oligodeoxyribonucleotides to aminosilanized glass surface
Cy5 [indodicarbocyanine, λ(ex)max 651 nm, λ(em)max 667 nm, red] dye-labeled 12mer and 24mer oligodeoxyribonucleotide (oligonucleotide) probes were printed on an aminosilanized glass surface (3-aminopropyltrimethoxysilane) in the array format. Unadsorbed material was removed by extensive washing at room temperature. We found that the oligonucleotide-bound Cy5 signal saturated beginning at 1 µM printed oligonucleotide. By reference to standard curves (Fig. 1A) the surface area per bound oligonucleotide could be calculated as a function of total applied probe concentration. A well-defined density limit was detected (Fig. 1B) for both 12mer and 24mer probes. At saturation it was found that 10.6 ± 0.3 nm2 is occupied by a Cy5-labeled 12mer oligonucleotide and 16.6 ± 0.5 nm2 is occupied by a Cy5-labeled 24mer oligonucleotide. Assuming a 1 nm width for an oligonucleotide strand and full extension of the phosphate backbone (at 0.7 nm/base repeat), it is predicted that a 12mer and a 24mer should occupy ∼7.7 and 16.1 nm2 of surface, respectively. The appended dye label might be expected to add 1 nm2 to that. Thus, the data suggest that at adsorptive binding saturation the surface structure for both the 12mer and 24mer probes approximates a densely packed monolayer of extended probe oligonucleotide strands.
Adsorptive attachment of such labeled oligonucleotides was found to be slowly reversible, probes remaining bound to the surface even after repeated washing with boiling deionized water. We found that adsorbed oligonucleotides could be removed by washing with boiling 5 M NaCl, indicating reversible non-covalent electrostatic interaction. Thus, the attachment of oligonucleotides to the surface can be attributed to extremely tight electrostatic interaction of the negatively charged phosphate backbone of nucleic acids with the positively charged amine groups of the surface.
Specific hybridization of DNA to adsorbed oligonucleotides
To determine whether DNA could specifically hybridize to such a densely adsorbed oligonucleotide monolayer, microarrays were fabricated with six Cy5-labeled DNA oligonucleotide probes (red), printed in quadruplicate on the aminopropylsilane surface, slightly below saturation of probe adsorption (0.3 µM added probe) and also at a saturating probe concentration of 3.0 µM. For 12mer (left side of arrays in Fig. 2) and 24mer probes (right side of arrays in Fig. 2) three probe sequence homologs were employed: a wild-type reference sequence (wt), a single nucleotide change per 12 bases (mt) and a randomly scrambled isomer (scr). The sequences are provided in Table 1.
Figure 2.
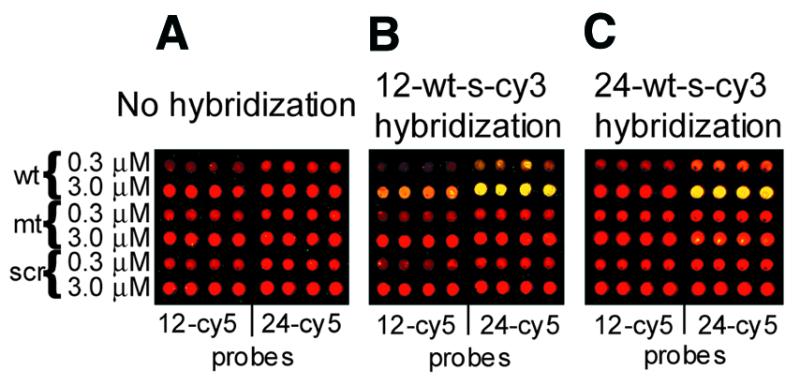
Fabrication of the arrays and specific hybridization. (A) The standard layout of the microarray used in this study. (B) Hybridization of a 12mer Cy3-labeled target to the array shown in (A). A 10 min hybridization at 5 µM and at room temperature was followed by a 1 min wash at room temperature in 60 mM Na+ carbonate, 20% formamide, 0.6% polyvinyl alcohol, 5× Denhardt’s, pH 9.5. (C) Hybridization of a 24mer Cy3-labeled target to the array shown in (A). A 10 min hybridization at 3 µM and at room temperature was followed by a 1 min wash at room temperature in 60 mM Na+ carbonate, 35% formamide, 0.6% polyvinyl alcohol, 5× Denhardt’s, pH 9.5. Hybridization conditions are described in Materials and Methods. Probe and target sequences are described in Table 1. Cy3 signal is green and Cy5 signal is red.
Table 1. Cy3- and Cy5-labeled oligodeoxyribonucleotides (Biosource International) used in the experiments.
| Oligodeoxyribonucleotide name |
Oligodeoxyribonucleotide sequence,
5′→3′ |
5′-Label |
Color |
Probe (P) or target (T) |
| wt-12-as | ctgtagtgggcg | Cy5 | Red | P |
| mt-12-as | ctgtagagggcg | Cy5 | Red | P |
| scr-12-as | gtcgtggagcgt | Cy5 | Red | P |
| wt-24-as | ctgtagtgggcgtcctgctgttcc | Cy5 | Red | P |
| mt-24-as | ctgtagagggcgtccagctgttcc | Cy5 | Red | P |
| scr-24-as | tggtgcggtgacaagctcctcctg | Cy5 | Red | P |
| wt-12-s | cgcccactacag | Cy3 | Green | T |
| mt-12-s | cgccctctacag | Cy3 | Green | T |
| scr-12-s | acgctccacgac | Cy3 | Green | T |
| wt-24-s | ggaacagcaggacgcccactacag | Cy3 | Green | T |
| mt-24-s | ggaacagctggacgccctctacag | Cy3 | Green | T |
| scr-24-s | caggaggagcttgtcaccgcacca | Cy3 | Green | T |
| wt-10-s-(-3′) | cgcccactac | Cy3 | Green | T |
| wt-10-s-(-5′) | cccactacag | Cy3 | Green | T |
| wt-11-s-(-3′) | cgcccactaca | Cy3 | Green | T |
| wt-11-s-(-5′) | gcccactacag | Cy3 | Green | T |
| wt-14-s | gacgcccactacag | Cy3 | Green | T |
| wt-16-s | aggacgcccactacag | Cy3 | Green | T |
| wt-18-s | gcaggacgcccactacag | Cy3 | Green | T |
| wt-20-s-(-3′) | aacagcaggacgcccactac | Cy3 | Green | T |
| wt-20-s-(-5′) | cagcaggacgcccactacag | Cy3 | Green | T |
| wt-22-s-(-3′) | ggaacagcaggacgcccactac | Cy3 | Green | T |
| wt-22-s-(-5′) | aacagcaggacgcccactacag | Cy3 | Green | T |
| wt-28-s | caggaacagcaggacgcccactacagtt | Cy3 | Green | T |
s, sense; as, antisense; wt, wild-type; mt, mutant type; scr, scrambled or random; the number in the name is the number of bases.
Microarrays were hybridized to a Cy3 [indocarboxycyanine, λ(ex)max 552 nm, λ(em)max 565 nm, green] dye-labeled 12mer (Fig. 2B) or 24mer oligonucleotide target (Fig. 2C), chosen to be complementary to the wild-type reference probe sequence. Hybridization was performed at a relatively high solution state target concentration (3 µM for 24mer targets and 5 µM for 12mer targets) to achieve saturation of the perfectly matched duplex binding equilibrium (yellow). At the saturation point, the bound target to probe ratio in these hybridization experiments has been measured to be 0.5 for 24mer targets and 1 for 12mer targets (see Materials and Methods). Thus, the specificity data obtained comprise a representative average over the entire adsorbed probe monolayer.
Note that the 12mer target (Fig. 2B) was designed to be complementary to both the wild-type 12mer and a segment of the 24mer probe strands. Similarly, the 24mer target (Fig. 2C) was designed to be complementary to both the wild-type 24mer probe and (with target strand overhang) to the 12mer wild-type probe strands. However, for the 24mer target, hybridization experimental stringency was increased so that binding to the 12mer probe is too weak to be detectable (Fig. 2C, left).
Visual inspection of the data reveals that, even at binding saturation, hybridization is highly specific. A single base mismatch in a 12mer pairing or two mismatches in a 24mer pairing are seen to produce a >5-fold reduction in target binding (compare rows 2 and 4 in Fig. 2B and C), while binding to the scrambled isomer could not be detected. Thus, the data above confirm that oligonucleotides bound by adsorption to an aminosilanized surface retain the capacity to bind their anti-parallel Watson–Crick sequence complement with measurable single mismatch discrimination within a 12mer duplex and double-mismatch discrimination within a 24mer pairing. Hybridization of the targets complementary to mt probes, as well as reversal of the targets and probes, additionally supports this conclusion (data not shown).
Formulation of the symmetry argument for a helical duplex
Strong, nearly irreversible adsorption of a single-stranded DNA oligonucleotide to a positively charged, aminosilanized surface suggests multiple electrostatic interactions between backbone phosphate groups and the surface, as depicted in Figure 3A. The aminosilane monolayer presents a plane of closely packed amine groups to the solution (Fig. 3D). During formation of a rotationally symmetrical double helix with an ordinary 10 bp pitch (Fig. 3C) the ribbon-like phosphate backbone of the probe (Fig. 3A) must detach from the densely charged surface, transiently, in order to wrap about the incoming target strand. In contrast, probe desorption from the surface is not required to explain formation of a non-helical duplex, such as that depicted in Figure 3B.
Figure 3.
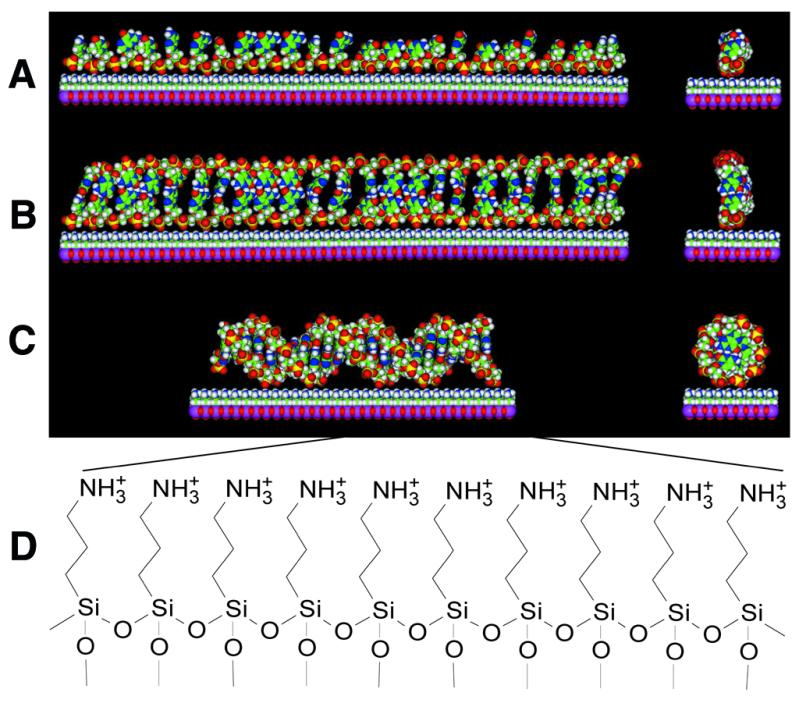
Models of duplex formation on a cationic surface. (A) A single-stranded 24mer oligonucleotide probe electrostatically attached to an aminosilanized surface. (B) A linear, non-helical DNA ribbon duplex on the surface, formed along its full length between an extended 24mer probe and its 24mer complementary target. (C) A 24 bp long B-form DNA double helix on the surface. (D) The chemical structure of the 3-aminopropyltrimethoxysilanized glass surface used in this study. The models in (A)–(C) were generated in the Molecular Builder module of InsightII and energy minimizations for ribbon duplex structure were done with the Amber force field of the Discover 3 package (MSI). Although it is quite possible that most common isomers of single-stranded (A) and double-stranded (B) DNA may have some curvature on a positively charged surface, only the linear isomers are shown for simplicity.
If the duplex formed on the surface were a helix with a relatively ordinary pitch, helical symmetry requires that both strands (target and probe) bind equally to the surface through their rotationally equivalent phosphate backbones (Fig. 3C) and thus, during the process of duplex dissociation, it would be impossible to remove the target without concomitant dissociation of the symmetrically equivalent probe strand. Given the simplicity of the modeling technique and the substantial uncertainty of surface forces, the models in Figure 3 should be treated as very preliminary.
Asymmetrical dissociation of the strands from the DNA duplex formed on an aminosilanized glass surface
Such an experimental dissociation analysis is shown in Figure 4, which depicts a dissociation kinetics experiment similar in form to the equilibrium binding experiment of Figure 2. Briefly, a Cy3-labeled 12mer target (left) or a Cy3-labeled 24mer target (right) was hybridized to microarrays of Cy5-labeled oligonucleotide probes as described in Figure 2. Target dissociation from the probes by stringent washing was measured as a function of time. At each time point binding signals were quantified fluorimetrically by deconvoluting the signal from the bound duplex (yellow) into its two components: Cy3 target (green) and Cy5 probe (red).
Figure 4.
Dissociation kinetics to analyze strand asymmetry within the surface-bound duplex. (A) Wild-type sense 12mer targets labeled with Cy3 dye hybridized to the arrays described in Figure 2. (B) Wild-type sense 24mer targets labeled with Cy3 dye hybridized to the arrays described in Figure 2. The kinetics of target dissociation during washing: (1) no hybridization; (2) after hybridization and no dissociation; (3) after hybridization and dissociation for 1 min; (4) after hybridization and dissociation for 4 min; (5) after hybridization and dissociation for 16 min; (6) after hybridization and dissociation for 16 min, followed by a second hybridization step. The bar graphs represent the normalized means and the standard deviations of the mean from eight array elements.
The comparison in Figure 4 of the initial and final dissociation time points (array 2 versus array 5 and subsequent bar graphs) reveals that during the 16 min wash the target strand of both the 12mer and 24mer duplex pairings was >90% dissociated from the microarray under conditions which left the density of adsorbed probes intact (compare array 1 and array 5 and subsequent bar graphs). Moreover, a repeat hybridization upon an array which had been previously hybridized and then washed for 16 min (array 6) reveals that the process of hybridization and dissociation is fully reversible, thereby confirming that the probe had not been lost or otherwise structurally altered during the course of duplex formation and dissociation. Again, since the initial ratio of bound target to probe was measured as close to 1 in these experiments, we conclude that the observed kinetic asymmetry during dissociation is a general property of all duplex pairings formed on the microarray surface.
This highly asymmetrical kinetic behavior is not easily rationalized in the context of a helical structure for the surface-bound duplex, since in that case the targets would be bound to the surface in a manner equivalent to probe strands (Fig. 3C). To confirm that important experimental observation, a 3 mm2 area of the aminosilanized glass surface was saturated with the same set of three Cy5-labeled 12mer and 24mer probes (wt, mt and scr) described for the microarray analysis. Cy3-labeled complementary targets (green) were hybridized to this patch of adsorbed probe under conditions identical to those described for microarray analysis in Figure 4 and imaged. The surface was then rinsed briefly in hybridization buffer (to remove unbound target), followed by application of the wash buffer to initiate dissociation of the duplex, as described previously for microarray analysis. Figure 5A presents these image data. The first row presents raw image data for 1 mm2 of the probe-modified surface monolayer prior to hybridization; the second row presents 1 mm2 of the same surface after hybridization to target binding saturation; and the third row presents 1 mm2 of the surface after hybridization and then a 15 min wash. Overall, the bulk analysis of surface hybridization in Figure 5A (rows 1–3) directly confirms the specificity and kinetics of dissociation that had previously been monitored in the microarray format.
Figure 5.
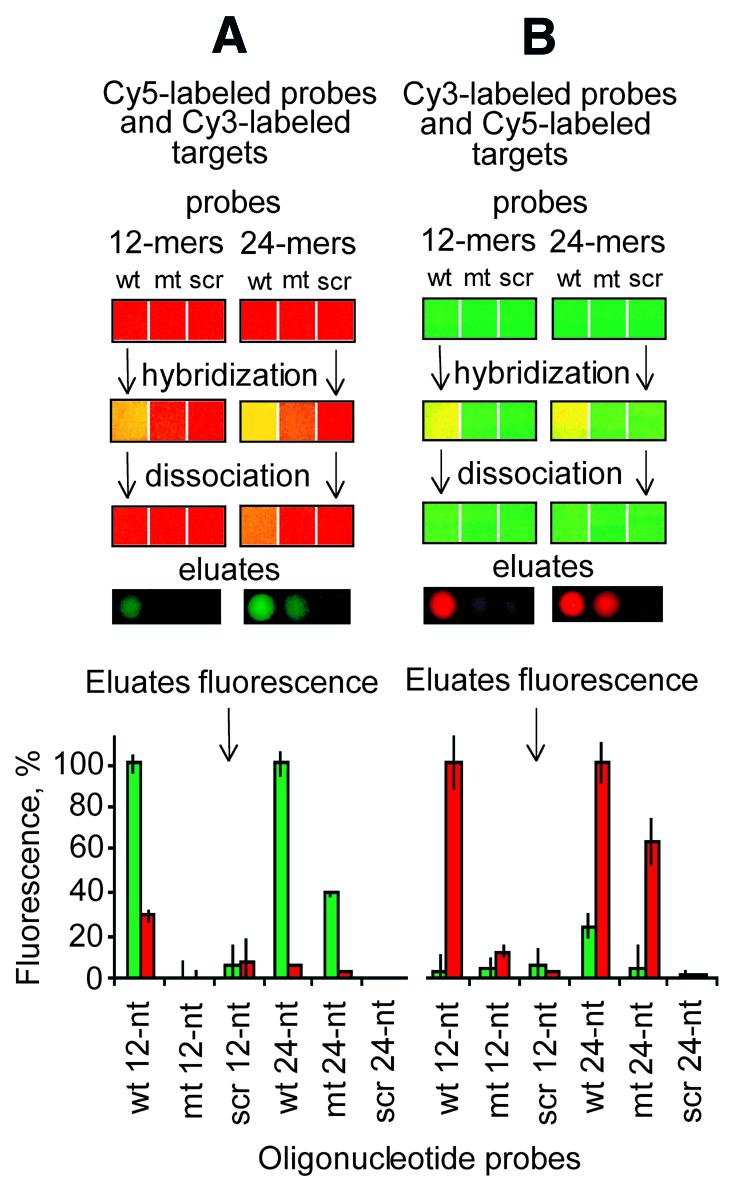
Analysis of the washing eluate. (A) Patches of aminosilanized surface (3 mm2 each) were saturated with Cy5-labeled probes (red), followed by rinsing to remove excess probe as described in Materials and Methods. Cy3-labeled targets (green) were hybridized to these patches, rinsed to remove the unbound targets and washed in 2 µl of the washing buffer for 15 min (see Materials and Methods). A 0.2 µl aliquot was aspirated from the resulting washing buffer and spotted on a clean slide, which was subsequently imaged with Cy3 and Cy5 filter sets on an ArrayWorx Imager (Applied Precision). (B) The reverse experiments are also shown, where the targets and probes had been reversed. The bar graphs represent the normalized means and the standard deviations of the mean from four such 0.2 µl eluates.
After 15 min dissociation the wash buffer was collected and pipetted onto a clean aminosilanized glass slide and imaged. These raw image data are presented in row 4. Strong Cy3 and weak Cy5 signals were obtained (Fig. 5A). When the experimental protocol was reversed and the probes were used as solution state targets and the targets were used as surface-bound probes, the result was reversed, i.e. the wash buffer contained strong Cy5 and weak Cy3 signals (Fig. 5B) in relative proportions generally the inverse of the distribution obtained in the initial analysis. Overall, the data in Figure 5 confirm a 5- to 20-fold kinetic asymmetry for dissociation of the two surface-bound duplex strands.
Asymmetrical DNase I digestion of the strands from the DNA duplex formed on an aminosilanized glass surface
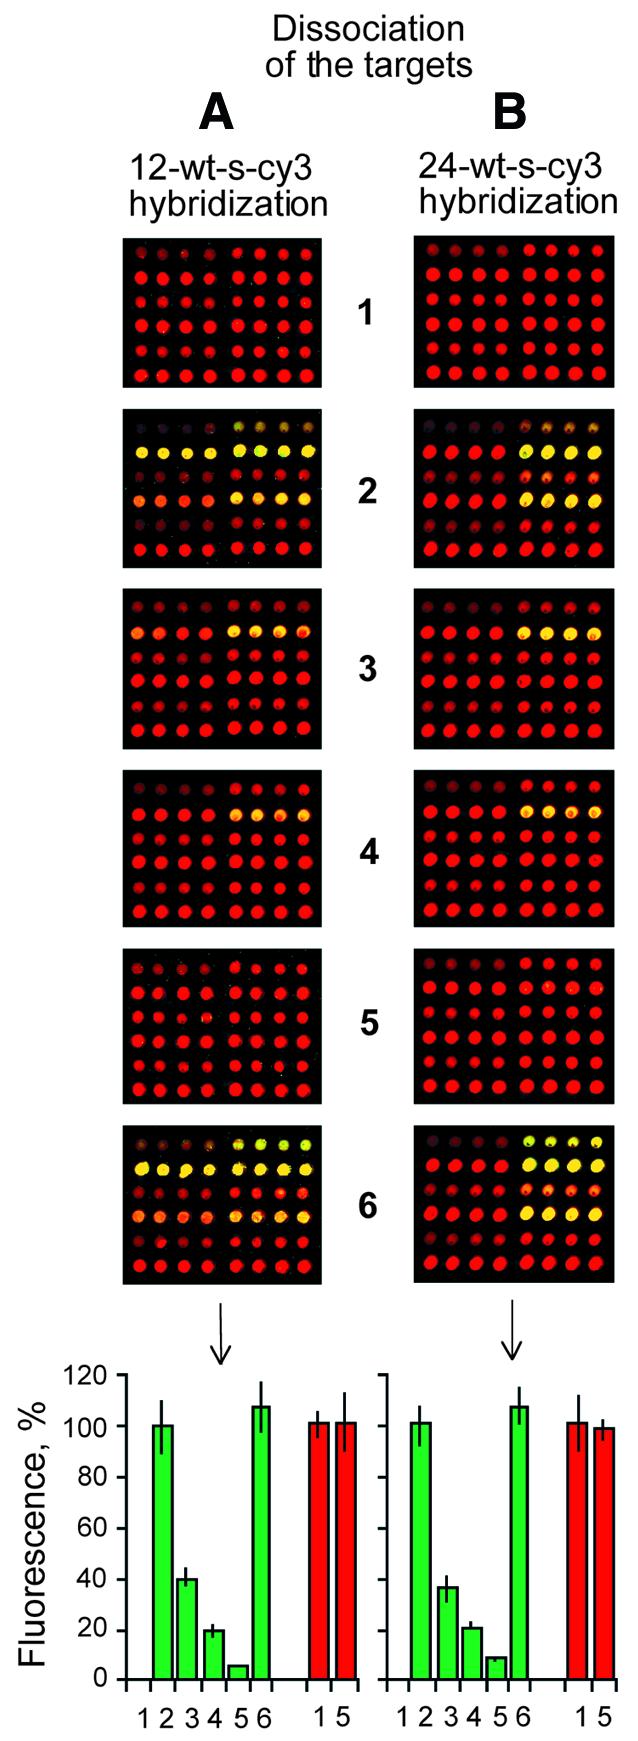
In order to confirm the observed strand asymmetry by a third method, the surface-bound duplex was analyzed by quantitative DNase I digestion (Fig. 6). Briefly, the experiment was designed exactly as in Figure 4 but rather than being monitored for dissociation kinetics, bound duplex digestion at room temperature for 20 min was measured as a function of increasing DNase I concentration (arrays 2–5 comprising 0, 0.1, 1.0 and 10 U DNase I, respectively). As seen by direct comparison (array 1 versus array 5), the fluorescence signals from the adsorbed probe strands are completely protected from DNase I cleavage (presumably due to the direct phosphate backbone interaction with surface amines) under conditions in which >90% of the bound 12mer (Fig. 6A) or 24mer (Fig. 6B) target strands were digested away with DNase I. However, re-hybridization of arrays which had been previously digested at the highest DNase I concentration (compare array 2 with array 6) suggests a small but finite loss of probe capacity to bind target, which may reflect a slow but finite rate of probe cleavage by DNase I, which does not appear to alter probe association with the surface, as detected by fluorescence.
Figure 6.
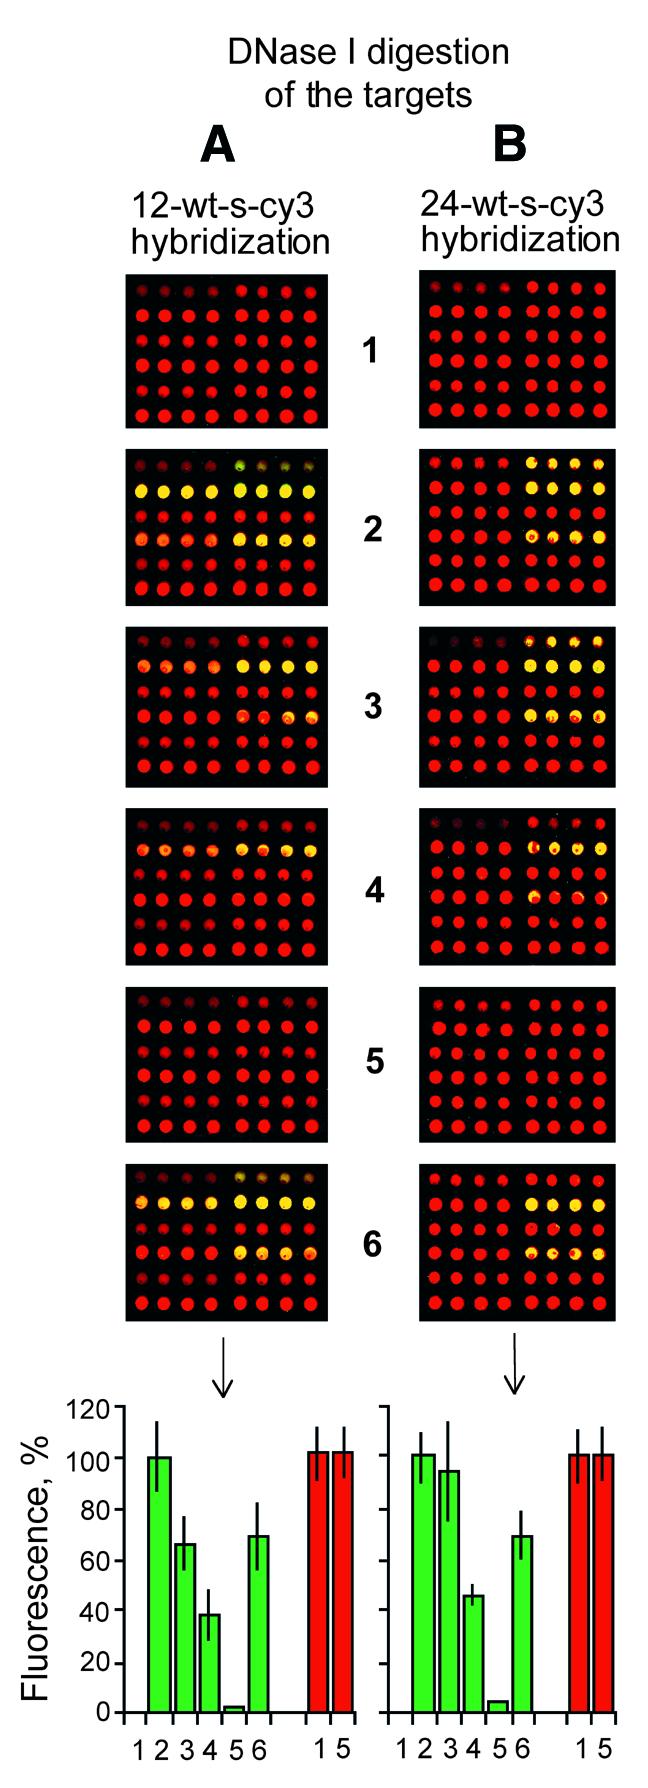
DNase protection assays. (A) Cy3-labeled, wild-type sense 12mer targets hybridized to the arrays described in Figure 2. (B) Cy3-labeled, wild-type sense 24mer targets hybridized to the arrays described in Figure 2. (1) No hybridization; (2) after hybridization and incubation without DNase I in DNase buffer (see Materials and Methods); (3) after hybridization and incubation with 0.1 U/µl DNase I; (4) after hybridization and incubation with 1.0 U/µl DNase I; (5) after hybridization and incubation with 10.0 U/µl DNase I; (6) after hybridization, incubation with 10.0 U/µl DNase I, pre-hybridization and a second hybridization. The bar graphs represent the normalized means and the standard deviations of the mean from eight array elements. Cy3 signal is green and Cy5 signal is red.
When a standard B-form double helix is first formed in solution and then deposited on the surface, it is known that DNase I digests both strands symmetrically (9). Thus, the pattern of highly asymmetrical DNase I protection detected in this study confirms the idea that the phosphate backbone of the adsorbed probe strands is not available for interaction with solution state DNase I, but instead faces the aminosilanized surface. On the other hand the data confirm that the phosphate backbone of the bound target strand faces the solution phase and remains readily accessible to DNase digestion.
DNA duplex forms along the length of more than two helical turns of B-helix
Although both the dissociation kinetics and DNase protection assays have suggested a highly asymmetrical duplex structure and are generally inconsistent with a symmetrical double helix, such a simple interpretation of the data can only be made if the duplex under study is fully formed over the span of the surface-bound probe. To answer this question, a set of 14 Cy3-labeled (green) target oligonucleotides of various lengths were synthesized and hybridized to the arrays described in Figure 2A. Under stringent hybridization and washing conditions it was found that binding stability to complementary 24mer probes, printed at 0.3 µM on an aminosilanized surface, increased as a function of target length up to the full probe length of 24 bases (Fig. 7) and leveled off thereafter. Throughout, base pairing specificity was maintained at the level of two base changes per 24mer probe. This relatively simple outcome suggests that a sequence-specific duplex is formed, on average, along the entirety of the available 24 base probe strand, which, if the resulting product were a standard B-form helix, would correspond to slightly more than two helical turns.
Figure 7.
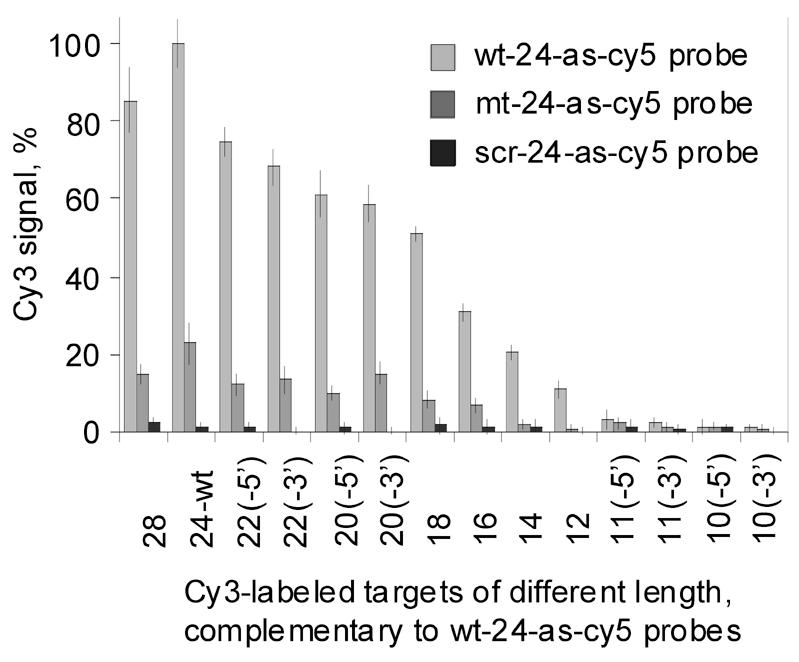
Length dependence of target hybridization stability upon a 24 base surface-bound probe. The following protocol was employed at room temperature throughout: (1) pre-hybridization in 60 mM sodium carbonate, 20% formamide, 5× Denhardt’s, 1.5% polyvinyl alcohol, pH 9.5, for 1 min, (2) 10 min hybridization at 3 µM Cy3-labeled targets (10–28 bases) in 60 mM sodium carbonate, 20% formamide, 5× Denhardt’s, 0.6% PVA, pH 9.5, (3) two rinses in pre-hybridization buffer, (4) 10 min wash in 60 mM sodium carbonate, 25% formamide, 5× Denhardt’s, 0.6% polyvinyl alcohol, pH 9.5, (5) brief wash in deionized H2O, (6) drying. Sequences of oligonucleotides on the x-axis are provided in Table 1. The arrays used in these experiments are identical to the array shown in Figure 2A. The bar graphs represent the normalized means and the standard deviations of the mean from 12 array elements.
DISCUSSION
In summary, the data presented here suggest that single-stranded DNA can bind tightly to a positively charged, aminosilanized glass surface to form a densely packed nucleic acid monolayer. Upon sequence-selective hybridization of such adsorbed probes to their anti-parallel Watson–Crick complement, a duplex is formed with distinctly asymmetrical properties that appear hard to reconcile with the known DNA structures, such as the A, B and Z double helices.
Although unexpected in a simple, mixed phase hybridization experiment as presented here, it is interesting to note that unwound ribbon-like duplexes have been proposed to exist in other somewhat more extreme contexts. For instance, the DNA complex formed upon binding of intercalators such as ditercalinium, as revealed by X-ray crystallography (7), involves a nearly complete loss of helical winding. Similarly, an unwound and significantly extended double helix has been proposed to form in solution as a response to the mechanical stress induced by stretching (3–6).
Within the context of an anti-parallel double helix, it is well known that base stacking and helix twist are mechanically coupled. In the studies described previously either a chemical force (insertion of a heterocycle between base planes) or mechanical strain upon the duplex (stretching) was coupled with an increase in base pair separation and a resultant loss of helical twist.
The experimental data described here do not directly measure base pair separation. However, as previously predicted from modeling studies, we have found it difficult to generate adsorbed linear, ribbon-like duplexes that do not involve at least a 50% increase in duplex length relative to the B-helix (Fig. 3B). Thus, it is interesting to consider that the ribbon-like duplex inferred from the studies described here may have necessarily incurred a significant loss of base stacking due to stretching. It is well known that the energetics of duplex formation are mainly determined by base stacking interactions and electrostatic repulsion among phosphates (10,11). The findings of this study suggest that, due to the direct and indirect consequences of duplex adsorption upon an intensely cationic plane, both the structure and the energetics of ribbon-like duplex formation may differ from those known in dilute aqueous solutions. The practical applications of such energetic differences are currently under investigation.
Acknowledgments
ACKNOWLEDGEMENTS
This work was supported by grant PO1CA75173 to M.H. from the National Cancer Institute and by Genometrix Inc. S.L. was in part supported by Baylor Research Advocates for Student Scientists.
References
- 1.Cheung V.G., Morley,M., Aguilar,F., Massimi,A., Kucherlapati,R. and Childs,G. (1999) Making and reading microarrays. Nature Genet., 21, 15–19. [DOI] [PubMed] [Google Scholar]
- 2.Duggan D.J., Bittner,M., Chen,Y., Meltzer,P. and Trent,J.M. (1999) Expression profiling using cDNA microarrays. Nature Genet., 21, 10–14. [DOI] [PubMed] [Google Scholar]
- 3.Leger J.F., Romano,G., Sarkar,A., Robert,J., Bourdieu,L., Chatenay,D. and Marko,J.F. (1999) Structural transitions of a twisted and stretched DNA molecule. Phys. Rev. Lett., 83, 1066–1069. [Google Scholar]
- 4.Bensimon D., Simon,A.J., Croquette,V. and Bensimon,A. (1995) Stretching DNA with a receding meniscus: experiments and models. Phys. Rev. Lett., 74, 4754–4757. [DOI] [PubMed] [Google Scholar]
- 5.Smith S.B., Cui,Y. and Bustamante,C. (1996) Overstretching B-DNA: the elastic response of individual double-stranded and single-stranded DNA molecules. Science, 271, 795–799. [DOI] [PubMed] [Google Scholar]
- 6.Lebrun A. and Lavery,R. (1996) Modelling extreme stretching of DNA. Nucleic Acids Res., 24, 2260–2267. [DOI] [PMC free article] [PubMed] [Google Scholar]
- 7.Gao O., Williams,L.D., Egli,M., Rabinovich,D., Chen,S.L., Quinly,G.J. and Rich,A. (1991) Drug-induced DNA repair: X-ray structure of a DNA-ditercalinium complex. Proc. Natl Acad. Sci. USA, 88, 2422–2426. [DOI] [PMC free article] [PubMed] [Google Scholar]
- 8.Belosludtsev Y.Y., Iverson,B., Lemeshko,S.V., Eggers,R., Wiese,R., Lee,S., Powdrill,T. and Hogan,M. (2001) DNA microarrays based on non-covalent oligonucleotide attachment and hybridization in two dimensions. Anal. Biochem., 292, 250–256. [DOI] [PubMed] [Google Scholar]
- 9.Rhodes D. and Klug,A. (1980) Helical periodicity of DNA determined by enzyme digestion. Nature, 286, 573–578. [DOI] [PubMed] [Google Scholar]
- 10.Dickerson R.E. (1992) DNA structure from A to Z. Methods Enzymol., 211, 67–111. [DOI] [PubMed] [Google Scholar]
- 11.McConnell K.J. and Beveridge,D.L. (2000) DNA structure: what’s in charge? J. Mol. Biol., 304, 803–820. [DOI] [PubMed] [Google Scholar]


