Abstract
Electrocorticography (ECoG) records neural signals directly from the surface of the cortex. Due to its high temporal and favorable spatial resolution, ECoG has emerged as a valuable new tool in acquiring cortical activity in cognitive and systems neuroscience. Many studies using ECoG visualized topographies of cortical activity or statistical tests on a three-dimensional model of the cortex, but a dedicated tool for this function has not yet been described. In this paper, we describe the NeuralAct package that serves this purpose. This package takes as input the 3D coordinates of the recording sensors, a cortical model in the same coordinate system (e.g., Talairach), and the activation data to be visualized at each sensor. It then aligns the sensor coordinates with the cortical model, convolves the activation data with a spatial kernel, and renders the resulting activations in color on the cortical model. The NeuralAct package can plot cortical activations of an individual subject as well as activations averaged over subjects. It is capable to render single images as well as sequences of images. The software runs under Matlab and is stable and robust. We here provide the tool and describe its visualization capabilities and procedures. The provided package contains thoroughly documented code and includes a simple demo that guides the researcher through the functionality of the tool.
Keywords: Brain, Imaging, ECoG, EEG, MEG, DOT, Matlab
Introduction
The visualization of neurophysiological data on anatomical structures is a critical vehicle in communicating research in cognitive and systems neuroscience. Over the past two decades, several research groups have been developing software that can render functional maps onto models of the brain (e.g., Cox and Hyde 1997; Dale et al. 1999; Darvas and Pantazis 2004; Delorme and Makeig 2004; Weber 2005; Van Essen et al. 2001; Penny et al. 2011; Fischl 2012). These software tools address the visualization needs of scientists working with different types of volume-based data, such as those derived using functional magnetic resonance imaging (fMRI), positron emission tomography (PET), computed tomography (CT), or with conventional surface-based data, such as scalp-recorded electroencephalography (EEG) or magnetoencephalography (MEG).
The recent increase in the application of electrocorticography (ECoG) as a recording modality has been paralleled by an increased need for visualization of the resulting data. This visualization faces important challenges that in part are unique to ECoG (Graimann et al. 2002; Korzeniewska et al. 2011; Hermes et al. 2010). As with EEG and MEG, the functional imaging space (i.e., the space of the recording electrodes) is different than the anatomical space (e.g., the coordinate system used by a MRI machine). In contrast to EEG/MEG, the spatial resolution of ECoG is higher than the typical inter-electrode distance (1 cm, Hermes et al. 2010). Furthermore and critically, ECoG recording electrodes are positioned in different locations in each subject (see Fig. 1 for an example).
Fig. 1.
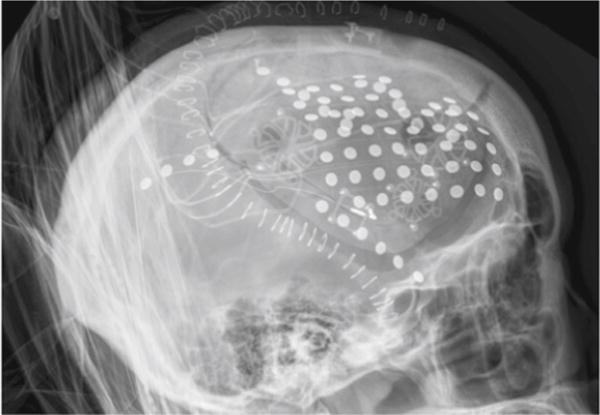
A radiograph demonstrating one possible placement of ECoG electrodes
A meaningful visualization of ECoG data must consist of three steps. First, it is necessary to estimate the locations of the implanted electrodes by co-registering them within a model of the cortical surface (Step 1 in “Materials and Methods”). This can be performed using commercial software or tools produced by the academic community (Hermes et al. 2010). Because the coordinates of the recording electrodes are typically devised using a different imaging methodology than is the anatomical surface of the brain (CT compared to MRI, Miller et al. 2010), the co-registered electrode locations are typically located within up to several millimeters above or below the surface of a cortical model (Hermes et al. 2010; Kubanek et al. 2013). This would lead to inaccurate and in certain cases possibly even misleading visualization results. To address this issue, it is necessary to perform a second step (Step 2 in “Materials and Methods”). In this step, the estimated electrode coordinates are projected onto the model of the cortical surface. Finally, in the third step, the topographies associated with neural activity or a particular statistical analysis of the neural data (“activations”) must be visualized at those projected electrode locations. This step poses a conceptual problem: the cortical signals are inherently sampled only at the locations of the electrodes. Thus, ideally, only the locations of the electrodes would convey activation information to the reader (e.g., each electrode would be rendered in its true shape and in the color associated with the particular value of an activation). This would produce a very sparse plot that is difficult to interpret. The third step (Step 3 in “Materials and Methods”) addresses this problem using spatial interpolation. Specifically, NeuralAct offers the researcher to convolve the activation data at each electrode with a spatial kernel.
The NeuralAct tool that is described in this paper receives its input from procedures that perform the first step, i.e., procedures that provide a model of the cortical surface and the estimates of the locations of the recording electrodes. It then submits this input to the second and the third steps, which produce the desired activation images.
There are two studies that deal with the first step, i.e., the localization of ECoG electrodes on a template of the brain surface (Miller et al. 2007; Hermes et al. 2010). However, to our knowledge, no study to date has described and provided a tool that performs the visualization steps 2 and 3. NeuralAct has been used for this purpose over the past several years (e.g., Schalk et al. 2007; Kubanek et al. 2009; Pei et al. 2011a, b; Gunduz et al. 2012; Wang et al. 2012; Kubanek et al. 2013; Martin et al. 2014; Potes et al. 2014). Nevertheless, this tool has not been formally described, and has not been made publicly available. To extend the benefit of this tool to the wider neuroscientific community, we here describe the challenges associated with the visualization of data such as those acquired using ECoG, discuss how these challenges are addressed in NeuralAct, apply NeuralAct to an exemplary ECoG dataset, and provide the software in a downloadable package along with a description of its function. The procedure is robust, simple to use, the code is thoroughly documented and contains a demonstration script that highlights the most important functions.
Materials and Methods
We developed the “NeuralAct” tool to visualize cortical activations on a three-dimensional model of a brain surface. The tool is written in Matlab (The Mathworks, Inc., Natick, MA, RRID:nlx_153890). The tool has been tested with Matlab versions 7 (R14, June 2004) and higher, on both Windows and Linux Matlab distributions. It is available for download at www.neuralgate.org/download/NeuralAct. The inputs to as well as the individual steps involved in the visualization procedure are described in detail below.
Step 1: Inputs and Their Estimation
NeuralAct takes three inputs: 1) a 3D model of the cortical surface; 2) 3D coordinates of the recording sensors; and 3) the activation data for each of the sensors.
The first input to NeuralAct is a 3D model of the cortical surface. In NeuralAct, the model consists of triplets of vertices that define the elementary triangles that build the cortical surface. NeuralAct includes a model of a pial cortical surface in the Talairach coordinate space (Talairach and Tournoux 1988). This cortical surface model is derived from the AFNI SUMA package (afni.nimh.nih.gov/afni/suma; Cox and Hyde 1997, RRID:nif-0000-00259). This default model is loaded into Matlab using the command load pial_talairach. The model can subsequently be visualized by invoking the command viewBrain(cortex). The output is shown in Fig. 2. Notably, the anatomy of the brain and of the cortical surface can vary quite substantially across subjects (Roland et al. 1993). Therefore, when possible, it is desirable to extract a model of the cortical surface individually in each subject (Gunduz et al. 2012; Kubanek et al. 2013; Martin et al. 2014; Potes et al. 2014). To do so, we usually acquire pre-operative structural magnetic resonance (MR) images, and from these images generate the three-dimensional cortical models using one of the available commercial software packages, such as the Curry software (Compumedics, Charlotte, NC; RRID:nlxSUBSCRIPTNB155726), or academic tools (Miller et al. 2010).
Fig. 2.
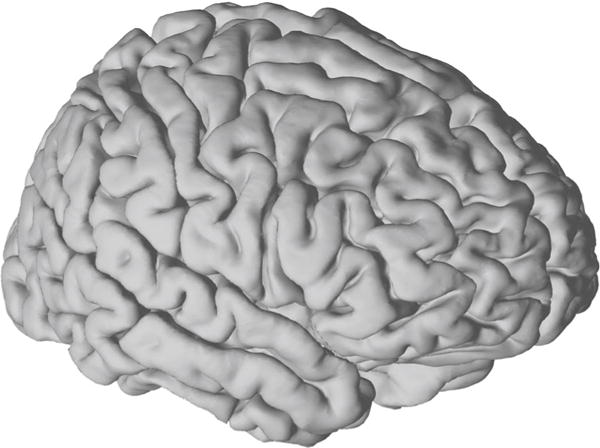
A default model of the pial cortical surface provided in NeuralAct. This model was derived from source code provided on the AFNI SUMA website (see text)
The second input to NeuralAct are the 3D coordinates of the recording sensors. In our earlier studies (Schalk et al. 2007; Kubanek et al. 2009), we estimated the 3D coordinates of each electrode from lateral skull radiographs using a simple procedure (Fox et al. 1985; Miller et al. 2007). In our more recent studies (Gunduz et al. 2012; Kubanek et al. 2013; Martin et al. 2014; Potes et al. 2014), we performed a more complex and rigorous procedure to extract the 3D coordinates of the implanted electrodes (Hermes et al. 2010). This and other methods rest on pre-operative magnetic resonance (MR) images and on post-operative computed tomography (CT) images. In NeuralAct, the 3D coordinates of each channel are specified as a n-by-3 vector (n is the number of electrodes) subj.electrodes. See an example by invoking load DEMOsubj. It is to note that the estimation of the 3D coordinates of the electrodes can be a significant source of inaccuracy, resulting in up to several millimeters of error (Hermes et al. 2010). NeuralAct does not by itself perform this step and is therefore free of this source of error.
The third input is the value of cortical activity (“activation”) that results from a particular statistical analysis at each individual sensor. An example of such an analysis may be the average power of ECoG activity in the gamma band, or the value of the ECoG raw potential at a particular latency relative to sensory stimulation or motor output. In NeuralAct, activations are specified as a n-by-1 vector subj.activations. The individual rows of the activations vector ( subj.activations) correspond to the individual rows of the electrodes vector ( subj.electrodes).
NeuralAct allows researchers to visualize activations that are averaged over subjects (e.g., Fig. 6c). To do so, data for each subject are provided in a separate structure subj and these individual structures form a structure field. For instance, the electrode coordinates of one subject are specified in subj(1).electrodes, of another subject in subj(2).electrodes, etc. The corresponding activations are specified as subj(1).activations, subj(2).activations, etc. Invoke load DEMOtwosubjs for an example.
Fig. 6.

Examples of plots produced using NeuralAct. a Activations rendered on the default model of the cortical surface in a single subject. Extracted from Fig. 6 in Kubanek et al. (2009), with permission. b Activations on a subject-specific cortical surface. Extracted from Fig. 5C in Kubanek et al. (2013). c Subject-average activations. In this case, NeuralAct computed activation average over 5 subjects. Extracted from Fig. 5AVG in Kubanek et al. (2013)
Steps 2 and 3: The Visualization Procedure
The individual steps of the visualization procedure are summarized in Fig. 3.
Fig. 3.
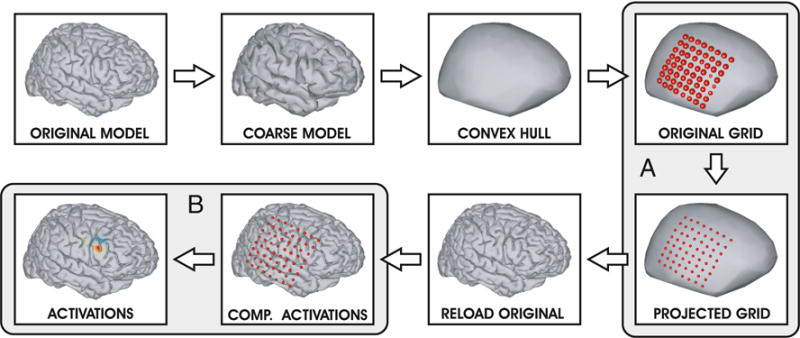
Flow chart of the visualization procedure
The electrode coordinates estimated using the available packages (see Inputs for details) typically fall close within but not precisely on the surface of a 3D cortical template (Hermes et al. 2010; Kubanek et al. 2013). Thus, NeuralAct must first project the electrode coordinates onto the surface of the cortical model. This raises a challenge—the pial surface model of the cortex is morphologically complex, featuring convexities and concavities—the gyri and the sulci. When an electrode is projected onto such morphologically rich surface, some of the electrodes fall within the concavities, the sulci. Furthermore, the inter-electrode distances of electrodes projected this way may differ from their known values. These two issues would lead to misleading visualization results. To overcome this challenge, we performed a critical first step in which we computed the convex hull of the brain surface. Since the computation of the convex hull is computationally expensive, the procedure first calculates a coarser version of the brain surface—with fewer vertices and triangles—before computing the convex hull. This simplification considerably speeds up both the computation of the convex hull and the subsequent projection of the electrode coordinates onto the resulting surface, while having minimal impact on the visualization results.
The electrode coordinates are then projected onto the resulting cortical surface (Fig. 3, section A). This procedure is described in detail in section “Step 2 in Detail: The Projection of the Electrode Coordinates onto the Cortical Surface”. Subsequently, the tool reloads the original, morphologically rich model of the cortical surface, as the final activations are plotted on the original surface. Finally, the activations are visualized on the cortical surface as color maps (Fig. 3, section B). This procedure is described in detail in section “Step 3 in Detail: The Computation of the Activations”.
Step 2 in Detail: The Projection of the Electrode Coordinates onto the Cortical Surface
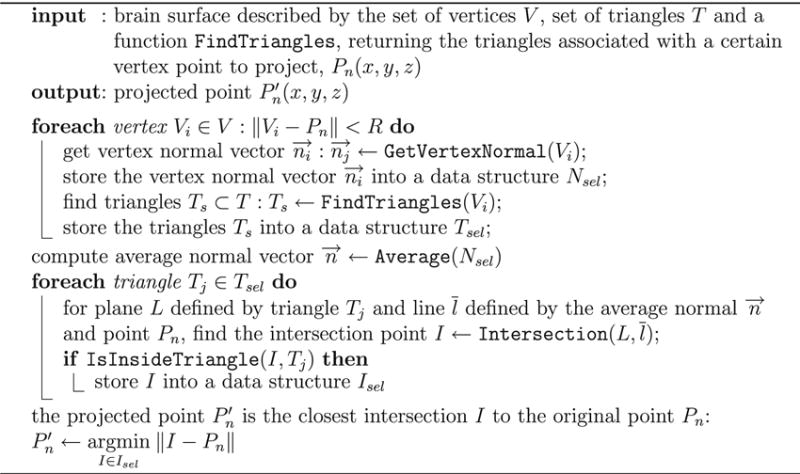
NeuralAct projects each electrode coordinate Pn(x, y, z) onto a coordinate of the cortical surface. The procedure is illustrated in Fig. 4. First, the procedure finds all vertices Vi(x, y, z) (i = 1, 2, …, N) of the surface within a predefined radius (within the yellow sphere of Fig. 4). For each of the vertices, the procedure computes the average normal vector of the triangles of which the given vertex is a part of. In Fig. 4, each of the resulting normal vectors is shown as a blue arrow. Finally, a line whose normal vector equals the average of the normal vectors (of the blue arrows) is intersected with the triangles within the considered radius, and an intersect is found. This constitutes the projected . This procedure is formally described in Algorithm 1.
Fig. 4.
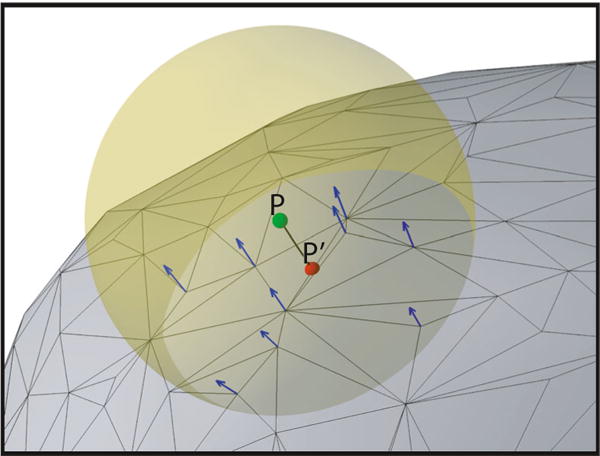
Projection of an electrode coordinate onto the cortical surface. Electrode locations are projected onto the surface using the average normal vector at all vertices within a given radius
Algorithm 1.
The projection of electrodes coordinates onto the cortical surface.
|
This algorithm is implemented by the NeuralAct function projectElectrodes.
Step 3 in Detail: The Computation of the Activations
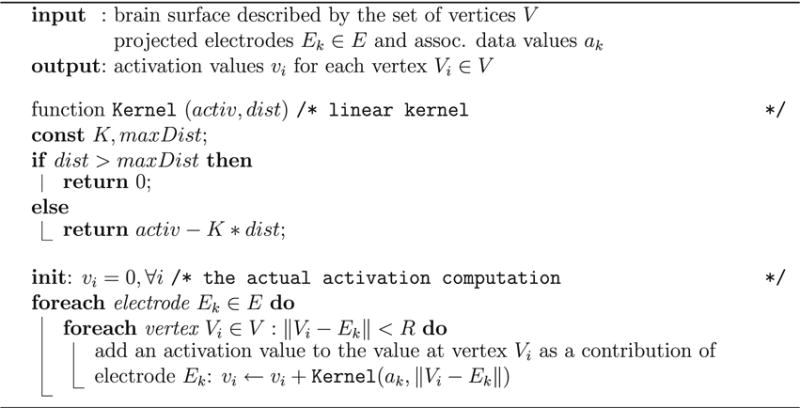
Given a set of projected electrode coordinates, the procedure renders in color the activation values on the cortical surface. The procedure is illustrated in Fig. 5. First, the procedure detects all vertices within a given distance of a given sensor. The procedure then assigns an activation value to each vertex by convolving the data value at each sensor with a spatial kernel. Finally, each triangle is colored according to the activation values assigned to the three vertices the triangle consists of. This procedure is formally described in Algorithm 2.
Fig. 5.
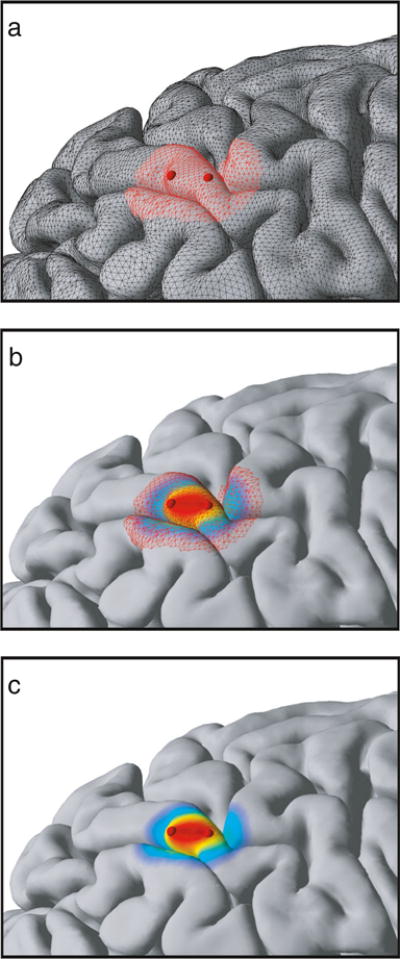
The computation of the activations. This example uses two electrodes with equal data values. a The procedure detects all vertices within a given distance of a given electrode. b The procedure assigns an activation value to each vertex by convolving the data value at each electrode with a spatial kernel. Values from the individual electrodes are superimposed. c Each triangle is colored according to the activation values assigned to the three vertices the triangle consists of
By default, the spatial kernel is a linear decay kernel whose value reaches zero at the typical ECoG inter-electrode distance (10 mm by default; Schalk et al. 2007; Kubanek et al. 2009; Pei et al. 2011a, b; Gunduz et al. 2012; Wang et al. 2012; Kubanek et al. 2013; Martin et al. 2014; Potes et al. 2014). The linear kernel has the advantage that each point of a line connecting any two electrodes represents a linearly interpolated value of the activation values at the two electrodes. Consequently, if two adjacent electrodes have the same data value, the cortical areas found within a line spanning these two electrodes will have the same activation value, i.e., the same color (Fig. 5). However, the experimenter is free to choose a different kernel. For example, NeuralAct already includes a Gaussian kernel. Additional kernels can be defined in the script electrodesContributions.
We worked with euclidian distance when computing the activations. ECoG studies typically visualize signals of low frequencies (< 200 Hz), which have relatively large spatial extent and may propagate through volume conduction (Miller 2010). For this kind of propagation, the euclidian distance would be appropriate. However, signals of higher frequencies likely travel mostly through particular axonal pathways. A visualization of such signals should take such pathways into account and not use the simple euclidian distance.
Algorithm 2.
Computation of the cortical activations.
|
This algorithm is implemented using the NeuralAct function electrodesContributions, which implements the convolution with the spatial kernel, and function NeuralAct, which implements the rendering of the resulting values on the cortical surface.
Results and Discussion
NeuralAct provides researchers working with ECoG the means to visualize cortical activity on 3D models of the cortex. We and others have used NeuralAct to visualize data acquired primarily using ECoG (e.g., Schalk et al. 2007; Kubanek et al. 2009; Pei et al. 2011a, b; Gunduz et al. 2012; Wang et al. 2012; Kubanek et al. 2013; Martin et al. 2014; Potes et al. 2014), but the tool may also be applied to data recorded with other modalities, such as the EEG. In the case of the EEG, for instance, the 3D Talairach coordinates of EEG channels in various montages can be obtained using Loreta software (www.uzh.ch/keyinst/loreta.htm, RRID:nif-0000-00323). However, since EEG electrodes are positioned relatively far from the cortex, extra care should be exercised when interpreting a visualization of EEG data on a cortical model using NeuralAct.
Figure 6 shows examples of some of the renderings NeuralAct has been used for. Figure 6a shows a rendering of ECoG activations on the default cortical surface in a single subject (Schalk et al. 2007; Kubanek et al. 2009). Figure 6b shows a rendering on a subject-specific model (see section “Materials and Methods”) of the cortical surface (Pei et al. 2011a, b; Gunduz et al. 2012; Wang et al. 2012; Kubanek et al. 2013; Martin et al. 2014). Figure 6b also displays the recording electrodes as spheres (Kubanek et al. 2013), which can be toggled using the viewstruct.what2view option in the NeuralAct script, or rendered separately using the plotSpheres ancillary script. Figure 6c demonstrates NeuralAct’s capability (“Materials and Methods”) to visualize activations that are averaged over subjects (Schalk et al. 2007; Kubanek et al. 2009; Pei et al. 2011a, b; Gunduz et al. 2012; Wang et al. 2012; Kubanek et al. 2013; Martin et al. 2014).
Besides static images, NeuralAct has been used to produce sequences of images of neural activity evolving in time (e.g., see Supplementary Material in Schalk et al. 2007 and Kubanek et al. 2009). This functionality is demonstrated in the demo included in the NeuralAct package.
NeuralAct is available for download at www.neuralgate.org/download/NeuralAct. The package includes the default cortical template and the code that implements the individual steps described in this paper. In addition to the description provided in this paper, we include detailed comments about the purpose and parameters of each function in the package. We also provide comments on the individual lines of the code.
Within the package directory, the command demo demonstrates the basic NeuralAct functionality. The demo performs the individual steps shown in Fig. 3 and produces an example plot. Following a five-second delay, the script further demonstrates the NeuralAct’s feature to render a movie of evolving neuronal activity, and saves the output as an .avi file.
In summary, we provide a tool to visualize cortical activity on a 3D model of the cortex. In our hands, the tool has proven valuable in visualizing data acquired using ECoG. Scientists using other modalities in which sensors are located near the cortical surface (EEG, MEG, diffuse optical tomography (DOT)) may also find it useful. The tool is robust and easy to use, and should therefore benefit a wide range of researchers in these areas.
Acknowledgments
This work was supported in part by grants from the US Army Research Office [W911NF-08-1-0216 and W911NF-07-1-0415] and the NIH [EB006356 and EB000856].
Footnotes
Information Sharing Statement
NeuralAct is available for download for research purposes at www.neuralgate.org/download/NeuralAct. RRID: SciRes 000162.
Conflict of interest The authors declare that they have no conflict of interest.
Contributor Information
Jan Kubanek, Department of Anatomy & Neurobiology, Washington University in St. Louis, St. Louis, MO 63130, USA.
Gerwin Schalk, National Resource Center for Adaptive Neurotechnologies, Wadsworth Center, New York State Department of Health, Albany, NY 12201, USA.
References
- Cox R, Hyde J. Software for analysis and visualization of functional magnetic resonance NeuroImages. Computers and Biomedical Research. 1997;10:171–178. doi: 10.1006/cbmr.1996.0014. [DOI] [PubMed] [Google Scholar]
- Dale A, Fischl B, Sereno M. Cortical surface-based analysis I: segmentation and surface reconstruction. NeuroImage. 1999;9(2):179–194. doi: 10.1006/nimg.1998.0395. [DOI] [PubMed] [Google Scholar]
- Darvas F, Pantazis D. Mapping human brain function with MEG and EEG: methods and validation. NeuroImage. 2004;23(supplement 1):S289–S299. doi: 10.1016/j.neuroimage.2004.07.014. [DOI] [PubMed] [Google Scholar]
- Delorme A, Makeig S. EEGLAB: an open source toolbox for analysis of single-trial EEG dynamics including independent component analysis. Journal of Neuroscience Methods. 2004;134:9–21. doi: 10.1016/j.jneumeth.2003.10.009. [DOI] [PubMed] [Google Scholar]
- Fischl B. FreeSurfer. NeuroImage. 2012;62:774–781. doi: 10.1016/j.NeuroImage.2012.01.021. [DOI] [PMC free article] [PubMed] [Google Scholar]
- Fox PT, Perlmutter JS, Raichle ME. A stereotactic method of anatomical localization for positron emission tomography. Journal of Computer Assisted Tomography. 1985;9:141–153. doi: 10.1097/00004728-198501000-00025. [DOI] [PubMed] [Google Scholar]
- Graimann B, Huggins J, Levine S, Pfurtscheller G. Visualization of significant ERD/ERS patterns in multichannel EEG and ECoG data. Clinical Neurophysiology. 2002;113:43–47. doi: 10.1016/s1388-2457(01)00697-6. [DOI] [PubMed] [Google Scholar]
- Gunduz A, Brunner P, Daitch A, Leuthardt EC, Ritaccio AL, Pesaran B, Schalk G. Decoding covert spatial attention using electrocorticographic (ECoG) signals in humans. Neuro Image. 2012;60:2285–2293. doi: 10.1016/j.neuroimage.2012.02.017. [DOI] [PMC free article] [PubMed] [Google Scholar]
- Hermes D, Miller KJ, Noordmans HJ, Vansteensel MJ, Ramsey NF. Automated electrocorticographic electrode localization on individually rendered brain surfaces. Journal of Neuroscience Methods. 2010;185:293–298. doi: 10.1016/j.jneumeth.2009.10.005. [DOI] [PubMed] [Google Scholar]
- Korzeniewska A, Franaszczuk PJ, Crainiceanu CM, Kuś R, Crone NE. Dynamics of large-scale cortical interactions at high gamma frequencies during word production: event related causality (ERC) analysis of human electrocorticography (ECoG) NeuroImage. 2011;56:2218–2237. doi: 10.1016/j.neuroimage.2011.03.030. [DOI] [PMC free article] [PubMed] [Google Scholar]
- Kubanek J, Brunner P, Gunduz A, Poeppel D, Schalk G. The tracking of speech envelope in the human cortex. PloS one. 2013;8:e53398. doi: 10.1371/journal.pone.0053398. [DOI] [PMC free article] [PubMed] [Google Scholar]
- Kubanek J, Miller K, Ojemann J, Wolpaw J, Schalk G. Decoding flexion of individual fingers using electrocorticographic signals in humans. Journal of Neural Engineering. 2009;6:066001. doi: 10.1088/1741-2560/6/6/066001. [DOI] [PMC free article] [PubMed] [Google Scholar]
- Martin S, Brunner P, Holdgraf C, Heinze HJ, Crone NE, Rieger J, Schalk G, Knight RT, Pasley BN. Decoding spectrotemporal features of overt and covert speech from the human cortex. Frontiers in Neuroengineering. 2014;7 doi: 10.3389/fneng.2014.00014. [DOI] [PMC free article] [PubMed] [Google Scholar]
- Miller KJ. Broadband spectral change: evidence for a macroscale correlate of population firing rate. The Journal of Neuroscience. 2010;30:6477–6479. doi: 10.1523/JNEUROSCI.6401-09.2010. [DOI] [PMC free article] [PubMed] [Google Scholar]
- Miller KJ, Hebb AO, Hermes D, den Nijs M, Ojemann JG, Rao RP. 2010 annual international conference of the IEEE engineering in medicine and biology society (EMBC) IEEE; 2010. Brain surface electrode co-registration using mri and x-ray; pp. 6015–6018. [DOI] [PubMed] [Google Scholar]
- Miller KJ, Makeig S, Hebb AO, Rao RP, dennijs M, Ojemann JG. Cortical electrode localization from x-rays and simple mapping for electrocorticographic research: the location on cortex(LOC) package for MATLAB. Journal of Neuroscience Methods. 2007;162:303–308. doi: 10.1016/j.jneumeth.2007.01.019. [DOI] [PubMed] [Google Scholar]
- Pei X, Barbour DL, Leuthardt EC, Schalk G. Decoding vowels and consonants in spoken and imagined words using electrocorticographic signals in humans. Journal of Neural Engineering. 2011a;8:046028. doi: 10.1088/1741-2560/8/4/046028. [DOI] [PMC free article] [PubMed] [Google Scholar]
- Pei X, Leuthardt EC, Gaona CM, Brunner P, Wolpaw JR, Schalk G. Spatiotemporal dynamics of electrocorticographic high gamma activity during overt and covert word repetition. NeuroImage. 2011b;54:2960–2972. doi: 10.1016/j.neuroimage.2010.10.029. [DOI] [PMC free article] [PubMed] [Google Scholar]
- Penny WD, Friston KJ, Ashburner JT, Kiebel SJ, Nichols TE. Statistical parametric mapping: the analysis of functional brain images: the analysis of functional brain images. Academic Press; 2011. [Google Scholar]
- Potes C, Brunner P, Gunduz A, Knight RT, Schalk G. Spatial and temporal relationships of electrocorticographic alpha and gamma activity during auditory processing. NeuroImage. 2014;97:188–195. doi: 10.1016/j.neuroimage.2014.04.045. [DOI] [PMC free article] [PubMed] [Google Scholar]
- Roland P, Graufelds C, Wahlin J, Ingelman L, Andersson M, Ledberg A, Pedersen J, Åkerman S, Dabringhaus A, Zilles K. Human brain atlas: for high-resolution functional and anatomical mapping. Human Brain Mapping. 1993;1:173–184. doi: 10.1002/hbm.460010303. [DOI] [PubMed] [Google Scholar]
- Schalk G, Kubanek J, Miller K, Anderson N, Leuthardt E, Ojemann J, Limbrick D, Moran D, Gerhardt L, Wolpaw J. Decoding two-dimensional movement trajectories using electrocorticographic signals in humans. Journal of Neural Engineering. 2007;4:264. doi: 10.1088/1741-2560/4/3/012. [DOI] [PubMed] [Google Scholar]
- Talairach J, Tournoux P. Co-planar sterotaxic atlas of the human brain. New York: Thieme Medical Publishers Inc; 1988. [Google Scholar]
- Van Essen DC, Drury HA, Dickson J, Harwell J, Hanlon D, Anderson CH. An integrated software suite for surface-based analyses of cerebral cortex. Journal of the American Medical Informatics Association. 2001;8:443–459. doi: 10.1136/jamia.2001.0080443. [DOI] [PMC free article] [PubMed] [Google Scholar]
- Wang Z, Gunduz A, Brunner P, Ritaccio AL, Ji Q, Schalk G. Decoding onset and direction of movements using electrocorticographic (ecog) signals in humans. Frontiers in Neuroengineering. 2012;5 doi: 10.3389/fneng.2012.00015. [DOI] [PMC free article] [PubMed] [Google Scholar]
- Weber D. Bioelectromagnetism Matlab Toolbox 2005 [Google Scholar]


