Abstract
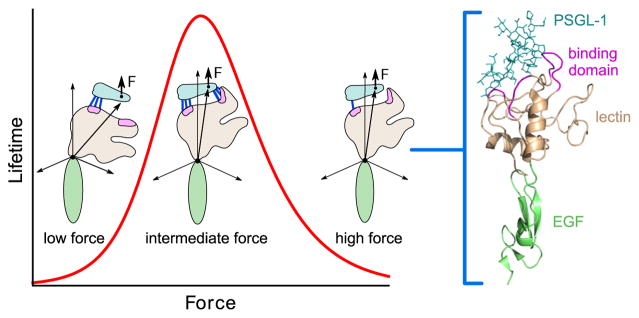
Lifetimes of bound states of protein complexes or biomolecule folded states typically decrease when subject to mechanical force. However, a plethora of biological systems exhibit the counter-intuitive phenomenon of catch bonding, where non-covalent bonds become stronger under externally applied forces. The quest to understand the origin of catch-bond behavior has led to the development of phenomenological and microscopic theories that can quantitatively recapitulate experimental data. Here, we assess the successes and limitations of such theories in explaining experimental data. The most widely applied approach is a phenomenological two-state model, which fits all of the available data on a variety of complexes: actomyosin, kinetochore-microtubule, selectin-ligand, and cadherin-catenin binding to filamentous actin. With a primary focus on the selectin family of cell-adhesion complexes, we discuss the positives and negatives of phenomenological models and the importance of evaluating the physical relevance of fitting parameters. We describe a microscopic theory for selectins, which provides a structural basis for catch bonds and predicts a crucial allosteric role for residues Asn82–Glu88. We emphasize the need for new theories and simulations that can mimic experimental conditions, given the complex response of cell adhesion complexes to force and their potential role in a variety of biological contexts.
Keywords: Catch-bond, Force, Energy landscape, Cell adhesion
1. Introduction
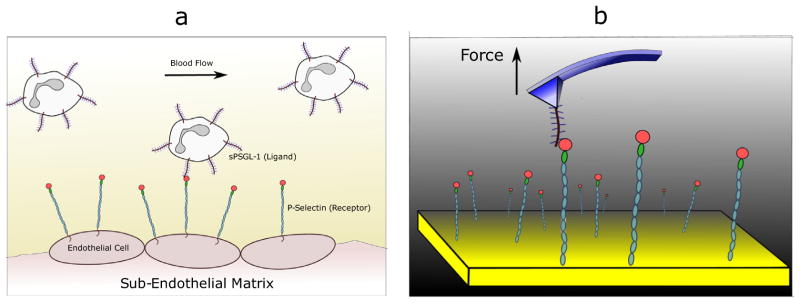
For complex multicellular organisms to function, individual cells need mechanisms to bind to each other and to the extracellular matrix. This is accomplished through specialized molecules on the surfaces of cells known as adhesion proteins (Berrier and Yamada, 2007; Gumbiner, 1996). Beyond their role as the essential mortar of tissue architecture, these proteins are involved in signaling, cellular movement, and tissue repair. For example, the adhesion of leukocytes to the endothelial cells of the blood vessel is a vital step in rolling and capture of blood cells (Fig. 1a), ultimately leading to wound healing (Ley et al., 2007; Vestweber and Blanks, 1999; McEver and Cummings, 1997). Viruses and bacteria utilize these molecules to establish initial attachments with host-cell receptors (Marsh and Helenius, 2006; Pizarro-Cerdá and Cossart, 2006). The general importance of cell adhesion complexes is evident from the fact that many diseases are caused by the mal-functioning or faulty expression of the proteins—for instance, the family of leukocyte adhesive deficiency (LAD) diseases in humans (Parsons et al., 2010; Symposium, 2008; Anderson and Springer, 1987).
Fig. 1.
Probing receptor-ligand interactions. (a) The cartoon shows ligands on leukocytes in the blood flow interacting with receptors on the endothelial cells. This interaction leads to the phenomenon of white blood cell rolling, and is the first step of a signaling cascade that ultimately leads to leukocyte localization at injured sites and wound healing. (b) Probing the receptor-ligand interaction at the single molecule level using an atomic force microscope (AFM).
In the process of executing their functions, cell adhesion complexes are typically subject to fluid flows, which result in shear stresses. Though these fluid flows sometimes impede the formation of protein complexes, in many cases the generated shear forces are of crucial functional importance. For instance, selectin and integrin activation, leading to enhanced ligand binding, is only possible in the presence of such shear flows (Alon and Ley, 2008; Alon and Dustin, 2007). Biological function can also be induced by other kinds of mechanical forces, such as those arising from the coupling of focal adhesions to the cytoskeleton (Burridge and Chrzanowska-Wodnicka, 1996; Wozniak et al., 2004). Under stress, molecules undergo conformational changes, triggering biophysical, biochemical, and gene regulatory responses that have been, and still are, subjects of intense research (Davies, 1995; Traub and Berk, 1998).
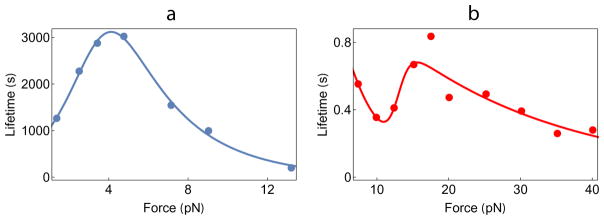
One expects that a force acting on a protein assembly should decrease its lifetime, the mean length of time the complex remains intact before rupture. This is indeed the experimental observation in a multitude of cases. Such behavior, described phenomenologically by Zhurkov (1965) and Bell (1978), is the defining characteristic of a “slip bond”. However, the response of certain complexes to mechanical force exhibits a surprisingly counterintuitive phenomenon. Lifetimes increase over a range of low force values, so-called “catch bond” behavior (Dembo et al., 1988), while at high forces the lifetimes decrease (Fig. 2a). The non-monotonic response of a variety of protein-complexes has attracted a great deal of attention thanks to the ability to observe them directly in single molecule pulling experiments (Zoldak and Rief, 2013) (Fig. 1b). However, in retrospect, the existence of catch-bonds was already evident in early experiments by Greig and Brooks, who discovered that agglutination of human red blood cells, using the lectin concanavalin A, increased under shear (Greig and Brooks, 1979). Although not interpreted in terms of catch bonds, their data showed lower rates of unbinding with increasing force on the complex. Direct evidence for catch bonds in a wide variety of cell adhesion complexes has come from flow, atomic force microscopy (AFM), biomembrane force probe (BFP) and optical tweezer experiments in the last decade (Thomas et al., 2002; Marshall et al., 2003; Kong et al., 2009; Liu et al., 2014; Buckley et al., 2014), along with examples from other load-bearing cellular complexes like actomyosin bonds (Guo and Guilford, 2006) and microtubule-kinetochore attachments (Akiyoshi et al., 2010). A number of articles have reviewed these results (see Refs. Sokurenko et al., 2008; McEver and Zhu, 2010; Rakshit and Sivasankar, 2014; Liu et al., 2015). The interested reader should consult these articles for details of experimental methodologies and a wider overview of the kind of systems where catch bonds have been discovered.
Fig. 2.
Catch bond data from (a) Kinetochore-microtubules (Akiyoshi et al., 2010) and (b) sulfatase-glycosaminoglycans (Harder et al., 2015). The filled circles are experimental data while the lines are fits using the general two-state model. Evidently, both biphasic and triphasic lifetime behavior can be explained by this model.
In this perspective we investigate the basic principles of some of the commonly used catch bond models critically. The successes and limitations of the theories are pointed out. In the process, we highlight the need for theories that account for the structural transitions of protein complexes subject to force. This is critically necessary because only by developing such theories testable predictions can be made. To date there is only one microscopic theory (Chakrabarti et al., 2014), applicable to a class of cell-adhesion complexes, that satisfies this criterion. We believe that progress in understanding the role of catch bonds under in vivo conditions can only be made by creating suitable theories with predictive power.
2. Phenomenological theories
2.1. The two-state model
A theoretical explanation for catch-bonds at the single molecule level was provided by Barsegov and Thirumalai (BT) (Barsegov and Thirumalai, 2005), inspired by experiments on forced-unbinding of complexes of P-selectin with ligands. The essential idea is that the protein-ligand complex can exist in two bound states S1 and S2 as depicted pictorially (Fig. 3). The model in Evans et al. (2004) is often considered to be a two-state model for catch bonds. However, it is worth emphasizing that there are key differences between the approaches in Evans et al. (2004) and Barsegov and Thirumalai (2005). In the former it was assumed that the two states of the complex interconvert rapidly, thus restricting the application of the model to the analysis of only a few experiments. The complete solution of the simple two-state model was provided by BT, which can be used to study catch bonds in all systems.
Fig. 3.
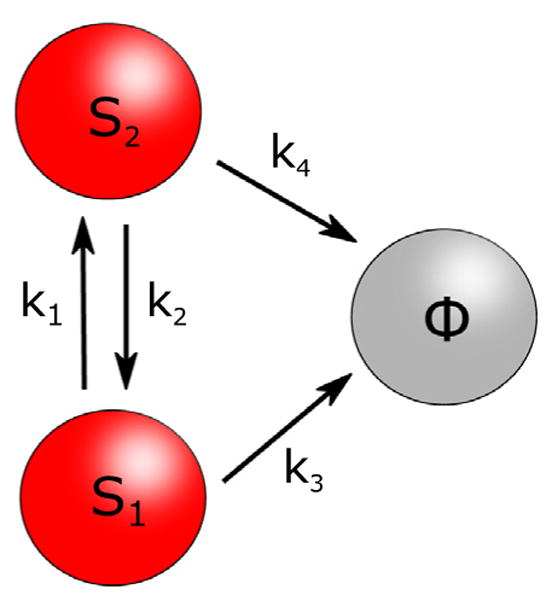
The two-state model for catch bonds. There are two protein-ligand bound states S1 and S2, which can interconvert with rates k1 and k2. From each state, the complex can disassociate to form Φ with characteristic rates k3, k4. All the rates depend on the external force in a Bell-like fashion, as described in the text.
The free energy barrier between the two states determines how fast they interconvert (with rates k10 and k20 at zero force). The protein-ligand complex could dissociate to a state Φ, with characteristic zero-force dissociation rates k30 and k40 for S1 and S2 respectively. If k40 > k30, dissociation from S2 would be easier than dissociation from S1, implying that the energy barrier along S2 → Φ is lower than that along S1 → Φ. To describe the effect of an external force (F) on this energy landscape, each of the four rates was assumed to vary with F according to the Bell equations, ki(F) = ki0 ediF (i = 1, 2, 3, 4). The reason the two-state model could produce non-monotonic lifetimes as a function of F is evident from the following scenario. If initially (at zero F) a large fraction of the protein-ligand population is in S2, most dissociation of the complex would occur from S2, making the average lifetime small. With an increase in F, the force-stabilized S1 starts becoming more populated, thus leading to dissociation events from both S1 and S2. This would naturally result in larger average lifetimes, thus giving the catch bond regime. Beyond a certain critical force Fc, the bound protein-ligand population would be almost entirely in S1, and the system returns to a slip bond regime, characterized by a mean lifetime decaying with F with rate constant d1. The two-state model was successfully used to explain catch and slip bond data from P-selectin and its ligands (Barsegov and Thirumalai, 2005; Barsegov and Thirumalai, 2006), therefore providing an important and basic physical understanding of the apparently strange catch bond phenomenon.
The two-state model has been subsequently used to explain catch-slip data from a number of biological systems like the bacterial FimH adhesive protein (Thomas et al., 2006; Pereverzev et al., 2009), kinetochore-microtubule attachments (Akiyoshi et al., 2010), cell surface sulfatase and glycosaminoglycan interactions (Harder et al., 2015) and cadherin-catenin interactions (Buckley et al., 2014). Among all these experiments, the work by Akiyoshi et al. on kinetochore-microtubule attachments (Akiyoshi et al., 2010) is a remarkable validation of the two-state model. The four force-dependent rates k1(F) through k4(F) were measured directly in their experiment, which were then used in the two-state model with no free parameters to reproduce the experimental catch-slip lifetime data. Catch bond behavior in the cadherin-catenin/F-actin complex demonstrated in Buckley et al. (2014) is also noteworthy. The complex with F-actin, known to readily form in vivo, can only be reconstituted in vitro in the presence of force. This suggests that the in vivo complex is likely under tension. The experimental force-dependent mean lifetimes and the survival probability of the minimal complex comprising cadherin-catenin and F-actin were analyzed quantitatively (Buckley et al., 2014) using the two-state model exactly as formulated by BT, who analyzed the data on the selectin-ligand complex by assuming equilibrium between S1 and S2 without invoking any force history on the initial population distribution.
2.2. Slip-catch-slip transition
The BT model also predicts that in principle it is possible to observe a decrease in the lifetime of a bond (slip bond) at F ≤ Fmin followed by an increase in the lifetime (catch bond) in the intermediate force regime, Fmin < F ≤ Fc, and finally a decrease in the lifetime at F ≥ Fc. Such a scenario is possible when at small forces (F ≤ Fmin) the force-stabilized state cannot be populated sufficiently so that unbinding occurs mainly from the weakly bound state S1. This would lead to an initial regime of conventional slip bond behavior. The predicted triphasic (slip-catch-slip) behavior should be generic although it appears that in many cases Fmin could be very small, thus preventing detection of the initial slip bond behavior. However, this triphasic behavior has been observed in an insightful experiment probing cell surface sulfatase and glycosaminoglycan interactions (Harder et al., 2015) (Fig. 2b), and also in an experiment on the von Willebrand factor (Kim et al., 2009). Although not analyzed in terms of triphasic behavior, it appears that force effects on the von Willebrand factor seem to be in accord with this slip-catch-slip scenario.
2.3. Effective 1-D models
Besides the two-state model, a variety of effectively 1-D models have been proposed and used to analyze catch bond data (Pereverzev et al., 2005; Liu and Zhong-can, 2006). The most widely used among these is the “one-state, two-pathway” model (Pereverzev et al., 2005; Bullerjahn and Kroy, 2016). Based on the original models proposed in Bartolo et al. (2002), this model posits one protein-ligand bound state instead of two, and allows for bond rupture via two different pathways. The two pathways have barriers of different heights which the bound state complex must overcome in order to dissociate. Under different force conditions a varying fraction of the bound state population escape via the two pathways, thereby giving rise to catch bond phenomena. Unlike the two-state model, which has experimental validation (especially in kinetochore-microtubule complexes (Akiyoshi et al., 2010)), this model has not yet been shown to have any direct experimental significance.
2.4. Limitations of the phenomenological theories
Although the two-state model has been used to recapitulate an impressive range of experimental data sets, a major limitation of the model is that it does not provide a structural explanation for the origin of catch bonds. In this picture, force (F) is coupled (in a Zhurkov-Bell exponential manner) to the distances d1, d2, d3 and d4, which are meant to represent transition state (TS) distances. If stretching by force exceeds the TS distance then the bound state is destabilized. However, since the actual protein-ligand energy landscape is multi-dimensional, comprising the coordinates of all the atoms, the transition states are merely projections along the force direction. Without any structural knowledge of the complex landscape or assessing the adequacy of such projections (Morrison et al., 2011), it becomes difficult to extract any meaningful information from a knowledge of these distances alone. Though if the extracted distances are physically reasonable it adds to the credibility of the phenomenological two-state theory.
The effective 1-D models have fewer free parameters than the two-state model, but nonetheless their efficacy is tarnished by their inability to produce physically reasonable parameters when analyzing experimental data. For example, the one-state, two-pathway model produces a non-physical negative transition state distance when used to analyze catch bond data (Pereverzev et al., 2005). This immediately suggests that these distances are projections, and provides no theoretical basis to reconstruct the actual transition state distances, assuming that this notion is even appropriate. The failure of effective 1-D models has recently been highlighted by Zhuravlev et al. (2016), who showed using a very general theory that the energy landscape of systems exhibiting catch bond behavior has to be strongly multidimensional, making any effective 1-D theory inadequate.
In light of the arguments given above it is clear that one has to create theories that capture the crucial structural features of the protein-ligand complexes. We now discuss a microscopic theory devised with an eye towards understanding the structural origins of catch bonds. Since structural models are by definition more limited in their scope and applicable to specific biological systems, the ensuing discussion will be much less general than the previous one. We will focus on P-selectin and its ligands, which along with L-selectin is the only system for which microscopic models have been used to analyze data (Chakrabarti et al., 2014).
3. Microscopic models for the unbinding of selectin-ligand complexes
3.1. Insights from experiments and crystal structures
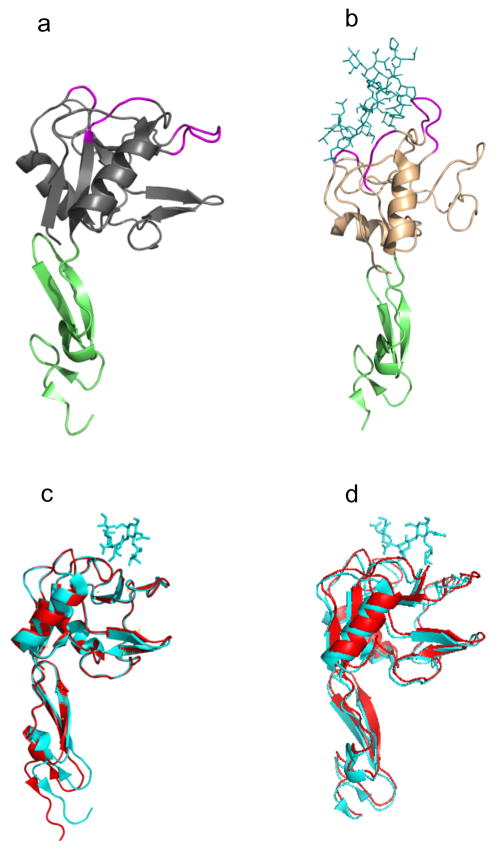
The idea is to create an effective multi (at least two) dimensional energy landscape that can be justifiably obtained from known structures of selectin complexes. Key ingredients for a microscopic theory can be deduced by analyzing experiments that provide both biochemical and structural data for selectins (Somers et al., 2000; Phan et al., 2006). The structures of a number of selectin complexes are shown in Fig. 4, both with and without ligands. Fig. 4a shows P-selectin in the “bent” or “flexed” state, while Fig. 4b shows the same receptor in the “extended” state. These are the only two states that have been crystallized in the selectin family of receptors. The green domain in both figures is the EGF domain, while gray/beige represents the lectin domain. The purple regions are the ligand binding domains of the receptor. As is evident from the two figures, the angle between the EGF and lectin domains defines whether the receptor is in the bent or extended state. In Fig. 4c and d, the bent states of P- and E-selectin are shown, with and without a ligand. Clearly, the structure of the bent state does not really change with or without the ligand. Fig. 4 as a whole, suggests that ligands can bind the selectin receptor either in the bent state or in the extended state. Mutation experiments provide evidence regarding the lifetime of the ligands in the two conformational states of the selectin receptor. In a beautiful experiment, Phan et al. (2006) created an extra carbohydrate region (glycan) at the interface between the lectin and EGF domains of P-selectin. The glycan domain acted as a wedge to pry the lectin and EGF domain apart, forcing them to adopt only the extended conformation. The lifetime of a ligand was then measured for the mutant, and compared to the lifetime of the wild type, which lacked the glycan wedge. Surprisingly, the lifetime of the mutant was larger, indicating that the ligand bound the receptor more tightly in the extended state compared to the bent state.
Fig. 4.
Selectin structures with and without ligands. (a) P-selectin in the bent state (PDB ID 1G1Q). (b) P-selectin complexed with ligand in the extended state (PDB ID 1G1S). (c) Aligned P-selectin structures in the bent state, with (1G1R, blue) and without (1G1Q, red) ligand. (d) Aligned E-selectin structures in the bent state, with (1G1T, blue) and without (1ESL, red) ligand.
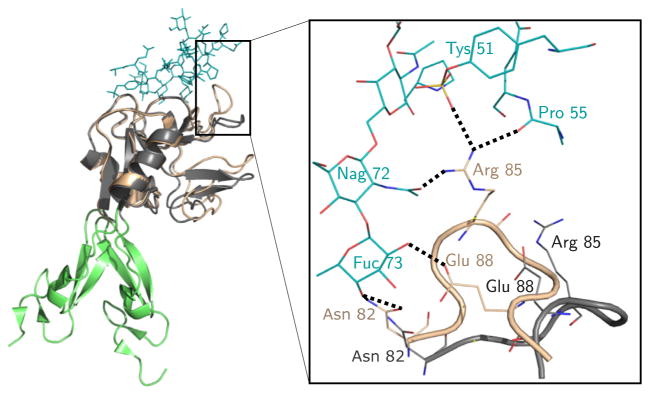
A plausible reason for the larger ligand lifetime in the extended state (and hence the catch bond phenomenon) can be inferred from an analysis of the crystal structures shown in Fig. 4. The purple shaded loop in Fig. 4a and b denotes the set of residues between Asn82 and Glu88 that are part of the ligand-binding lectin domain of P-selectin. As pointed out elsewhere (Somers et al., 2000; Springer, 2009), there is a major structural change in this loop, going from the bent (Fig. 4a, c and d) to the extended (Fig. 4b) conformations. Unlike the bent conformation where the loop creates no contacts with the ligand, there are six hydrogen bonds formed in the extended state (Fig. 5). The conformational changes have been suggested to arise due to allostery (Waldron and Springer, 2009), which is supported by the observation that the mutation A28H in the lectin domain, that is far from either the ligand binding interface or the lectin-EGF interface, can cause an increase in affinity for the ligand (Waldron and Springer, 2009). Experimental evidence from biochemical studies and crystal structures suggests that selectins can exist in (at least) two conformations—a bent and an extended state. Both states can bind ligands, but crucially, the lifetime is larger in the extended state. The larger lifetime in the extended state could be due to structural changes in the loop of residues Asn82–Glu88, which create extra contacts with the ligand only in the extended state.
Fig. 5.
Close-up of the receptor-ligand interactions of P-selectin in the bent (dark grey) and extended (beige) states. In the extended state, residues in the loop Asn82–Glu88 create new hydrogen bonds (dashed lines) with the ligand (blue) that were not present in the bent state.
3.2. Structure-based energy-landscape model predicts crucial role of Asn82–Glu88 loop and allostery in selectin catch bonds
The experimental results provide fundamental insights to the possible origin of catch bond behavior in selectins, and are reminiscent of the two-state model (Barsegov and Thirumalai, 2005; Barsegov and Thirumalai, 2006) with the extended and bent states serving as the two bound states S1 and S2 discussed earlier in this review. However, to quantitatively judge whether the shift of the loop region Asn82–Glu88 can indeed explain P-selectin force-lifetime curves in single molecule experiments (Marshall et al., 2003), we created a microscopic model (described in detail in Chakrabarti et al. (2014)). A three-dimensional energy landscape (effectively two-dimensional due to azimuthal symmetry in the Hamiltonian) was designed to mimic the angle-dependent ligand detachment rate observed in experiments, and to allow the external force to be incorporated in a manner similar to the geometry in single molecule AFM experiments (Fig. 6). Note that an a priori Bell-like force dependence was not assumed in this model, but emerged naturally only at large forces (Chakrabarti et al., 2014). Mean first passage times within the energy landscape were then calculated using a Fokker–Planck formalism, to estimate the dissociation rates at various forces. Crucially, the four free parameters of the model were directly associated with quantities that can be measured, for instance the number of hydrogen bonds in the Asn82–Glu88 loop or the size of the lectin domain. The mathematical model provided very strong support to the idea that remodeling of the Asn82–Glu88 loop causes catch-like behavior in P-selectin. It also provided a concrete prediction for change in force-lifetime behavior on mutating the sulfated tyrosine 51 on PSGL-1 (the P-selectin ligand) to phenylalanine. This mutant PSGL-1 construct had been developed earlier (Xiao et al., 2012), and hence an experimental validation of the prediction is possible, and would be of much interest in the context of the model.
Fig. 6.
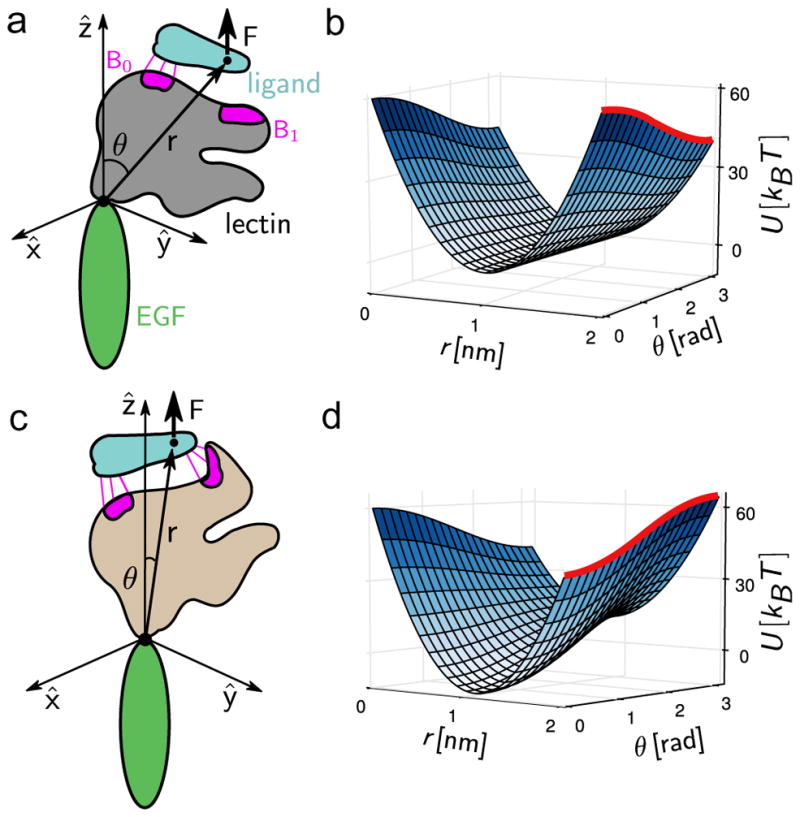
Structure-based microscopic model for catch bonds in selectins, developed by Chakrabarti et al. (2014). a) and c): The model, highlighting the key components. b) and d): The energy landscape at zero and high forces respectively. The barrier to bond breaking is shown as a red line.
Finally, we point out the limitations of the above model in its current form: A correct theory for catch bonds must be able to explain the full distribution of experimentally determined lifetimes in addition to the average lifetime as functions of force. Since this model was built keeping specifically selectins in mind (which exhibit single-exponential lifetime distributions), it cannot be used to understand catch bonds in systems that exhibit double-exponential lifetimes (for example cadherin-catenin (Buckley et al., 2014)). Even more complex behavior has been observed in E-selectin, where there is a slip-catch-slip triphasic behavior of the force-lifetime curve (Wayman et al., 2010). This too cannot be explained by the current model and might be important to consider in the future. As noted earlier, triphasic behavior has also been seen in the interactions of cell surface sulfatase and glycosaminoglycans (Harder et al., 2015), where the authors explained the data using the two-state model as formulated by BT Barsegov and Thirumalai, 2005. Finally, we should point out that unlike the only available microscopic theory, so far restricted to the selectin family (Chakrabarti et al., 2014), the phenomenological model can be used to quantitatively analyze all of the available data.
3.3. Sliding-rebinding model
A very different model has been proposed to explain catch bonds in a variety of other adhesion complexes (Lou et al., 2006; Lou and Zhu, 2007). This “sliding-rebinding” model was originally inspired by results of steered molecular dynamics simulations on L-selectin (Lou et al., 2006) (albeit at unphysically large loading rates), and proposes a radically different explanation for the increase in lifetimes under force. The observation in the simulation, which uses very large values of F to observe rupture in very short times, was that under external force, the ligand shifted its position in the binding pocket of the lectin domain, thereby rupturing original bonds and creating new bonds that stabilized the ligand. A model was proposed based on this observation, which can be summarized as follows: N pairs of pseudo-atoms represent the non-covalent bonds of the zero force receptor-ligand complex, where N can be any number greater than zero. Under force, sliding results in a progressive decrease in the number of interacting pairs while rebinding increases the number of interacting pairs. Each event is given a defined rate of formation/disruption (with Bell-like force dependence), and the final set of rates is used in a kinetic Monte Carlo simulation to calculate lifetimes of the receptor-ligand (Lou and Zhu, 2007).
The principle of sliding of protein domains to form new stabilizing contacts seems to have experimental support (Rakshit et al., 2012; Manibog et al., 2014). Using steered molecular dynamics simulations of cadherin molecules in the presence of calcium ions, Manibog et al. showed that the sliding of opposing cadherins under force can cause formation of new hydrogen bonds (Manibog et al., 2014). Based on their simulations they predicted that reducing the calcium ion concentration would eliminate the force-induced hydrogen bonds, which was then validated in AFM experiments. Though these results indeed support the basic idea of a sliding-induced stabilization, the mathematical analysis carried out based on the sliding-rebinding model highlights an inherent issue with the model, that has not been addressed satisfactorily to date. Like in the original papers (Lou and Zhu, 2007), Manibog et al. observe an unphysically large (more than two orders of magnitude) rebinding rate of interactions compared to the regular bond formation rate. In addition, the model has features that are difficult to justify on physical grounds and difficult to measure experimentally—for instance, a force scale f0 beyond which new interactions are formed with unit probability. Without a more physical justification of the extracted parameters of the model, it therefore becomes difficult to judge the validity of the sliding-rebinding model. Finally, the lifetime distributions predicted by the sliding-rebinding model were not explored by the authors in the cadherin study (Manibog et al., 2014). The experimental data clearly suggests double-exponential lifetime distributions, and it is not yet clear whether the sliding-rebinding model can produce similar results for the parameters extracted.
For the particular case of catch bonds in selectins, it has been pointed out before that steered molecular dynamics simulations and the sliding-rebinding model fail to reproduce essential experimental details (Waldron and Springer, 2009). To begin with, the atomistic simulations on L-selectin where force was used to convert the bent state to the extended state, could not reproduce the crucial structural change in the Asn82–Glu88 loop seen in crystal structures (Fig. 1B in Lou et al. (2006)). This is hardly surprising since the current force fields in all-atom simulations, especially those for divalent ions, are not good enough to reproduce major allosteric changes in protein domains. This is not an isolated incident, and major differences between SMD predictions (Puklin-Faucher et al., 2006) and eventual crystal structures have been noted in the case of α5β3 integrin as well (Zhu et al., 2013). In addition, it has been shown in recent experiments that at high ramp rates of pulling, the catch bond behavior of certain complexes completely disappears due to non-equilibrium effects (Sarangapani et al., 2011). It is therefore difficult to justify using steered molecular dynamics simulations (which usually operate under ramp rates that are several orders of magnitude larger than experimental rates) to investigate the origins of catch bond behavior. In light of all these limitations, steered molecular dynamics simulation results cannot be taken seriously until force-fields are improved and the simulations are carried out at forces that are comparable to those observed in experiments. Because of these difficulties we surmise that the sliding-rebinding model, while plausible, should be viewed as unphysical.
4. Conclusions and future directions
As the exciting field of mechanobiology hurtles into a new age of experimental, theoretical and computational research, it is worthwhile to pause for a moment and critically analyze the tools being currently used to analyze experiments, in order to chart out the future path for developing more informative theories. Here, we have explored some of the theoretical ideas currently employed to analyze catch bond data from experiments. We have highlighted the insights provided by phenomenological theories over the last decade, yet at the same time balanced it with discussions of their limitations. Phenomenological theories of catch bonds must give way eventually to more detailed and structure-based models, and we argue how one such model suggests a clear structural mechanism for catch bonds in selectins (Chakrabarti et al., 2014) (Fig. 7). Another recent work explored kinetochore-microtubule catch-bonds based on an energy landscape model (Sharma et al., 2014). Although experimental data was not analyzed, it will be interesting if this model can shed light on structural mechanisms in the future. A major theme of our discussions has been interpretability and physical meaningfulness of parameters extracted from mathematical models. In addition, we have emphasized that detailed simulations must be performed under conditions that mimic experimental forces and loading rates in order to be trust-worthy and relevant. Given the observation of catch bonds in diverse systems it is critical to create general theories, if possible, in order to explain their origin and shed light on the way nature uses them in executing cellular functions. In order to achieve these goals the theories have to be critically evaluated on solid physical grounds.
Fig. 7.
A summary of the predicted allosteric mechanism of catch bonds in P-selectin and PSGL-1. Allosteric changes coupled to the lectin domain rotation create extra hydrogen bonds between the receptor and ligand, causing catch bond behavior.
Acknowledgments
This work was supported in part by grants from the National Science Foundation (Grant No. CHE 13-61946) and the National Institutes of Health (GM 089685).
References
- Akiyoshi B, Sarangapani KK, Powers AF, Nelson CR, Reichow SL, Arellano-Santoyo H, Gonen T, Ranish JA, Asbury CL, Biggins S. Nature. 2010;468:576. doi: 10.1038/nature09594. [DOI] [PMC free article] [PubMed] [Google Scholar]
- Alon R, Dustin ML. Immunity. 2007;26:17. doi: 10.1016/j.immuni.2007.01.002. [DOI] [PubMed] [Google Scholar]
- Alon R, Ley K. Curr Opin Cell Biol. 2008;20:525. doi: 10.1016/j.ceb.2008.04.003. [DOI] [PMC free article] [PubMed] [Google Scholar]
- Anderson DC, Springer TA. Ann Rev Med. 1987;38:175. doi: 10.1146/annurev.me.38.020187.001135. [DOI] [PubMed] [Google Scholar]
- Barsegov V, Thirumalai D. Proc Natl Acad Sci. 2005;102:1835. doi: 10.1073/pnas.0406938102. [DOI] [PMC free article] [PubMed] [Google Scholar]
- Barsegov V, Thirumalai D. J Phys Chem B. 2006;110:26403. doi: 10.1021/jp0653306. [DOI] [PubMed] [Google Scholar]
- Bartolo D, Derenyi I, Ajdari A. Phys Rev E: Stat Nonlinear Soft Matter Phys. 2002;65:051910. doi: 10.1103/PhysRevE.65.051910. [DOI] [PubMed] [Google Scholar]
- Bell GI. Science. 1978;200:618. doi: 10.1126/science.347575. [DOI] [PubMed] [Google Scholar]
- Berrier AL, Yamada KM. J Cell Physiol. 2007;213:565. doi: 10.1002/jcp.21237. [DOI] [PubMed] [Google Scholar]
- Buckley C, Tan J, Anderson K, Hanein D, Volkmann N, Weis W, Nelson J, Dunn AR. Science. 2014:1254211. doi: 10.1126/science.1254211. [DOI] [PMC free article] [PubMed] [Google Scholar]
- Bullerjahn JT, Kroy K. Phys Rev E. 2016;93:012404. doi: 10.1103/PhysRevE.93.012404. [DOI] [PubMed] [Google Scholar]
- Burridge K, Chrzanowska-Wodnicka M. Annu Rev Cell Dev Biol. 1996;12:463. doi: 10.1146/annurev.cellbio.12.1.463. [DOI] [PubMed] [Google Scholar]
- Chakrabarti S, Hinczewski M, Thirumalai D. PNAS. 2014;111:9048. doi: 10.1073/pnas.1405384111. [DOI] [PMC free article] [PubMed] [Google Scholar]
- Davies PF. Physiol Rev. 1995;75:519. doi: 10.1152/physrev.1995.75.3.519. [DOI] [PMC free article] [PubMed] [Google Scholar]
- Dembo M, Torney DC, Saxman K, Hammer D. Proc R Soc London B Biol Sci. 1988;234:55. doi: 10.1098/rspb.1988.0038. [DOI] [PubMed] [Google Scholar]
- Evans E, Leung A, Heinrich V, Zhu C. Proc Natl Acad Sci. 2004;101:11281. doi: 10.1073/pnas.0401870101. [DOI] [PMC free article] [PubMed] [Google Scholar]
- Greig RG, Brooks DE. Nature. 1979;282:738. doi: 10.1038/282738a0. [DOI] [PubMed] [Google Scholar]
- Gumbiner BM. Cell. 1996;84:345. doi: 10.1016/s0092-8674(00)81279-9. [DOI] [PubMed] [Google Scholar]
- Guo B, Guilford WH. Proc Natl Acad Sci. 2006;103:9844. doi: 10.1073/pnas.0601255103. [DOI] [PMC free article] [PubMed] [Google Scholar]
- Harder A, Möller AK, Milz F, Neuhaus P, Walhorn V, Dierks T, Anselmetti D. Biophys J. 2015;108:1709. doi: 10.1016/j.bpj.2015.02.028. [DOI] [PMC free article] [PubMed] [Google Scholar]
- Kim J, Zhang CZ, Zhang X, Springer T. Nature. 2009;466:992. doi: 10.1038/nature09295. [DOI] [PMC free article] [PubMed] [Google Scholar]
- Kong F, Garća AJ, Mould AP, Humphries MJ, Zhu C. J Cell Biol. 2009;185:1275. doi: 10.1083/jcb.200810002. [DOI] [PMC free article] [PubMed] [Google Scholar]
- Ley K, Laudanna C, Cybulsky MI, Nourshargh S. Nat Rev Immunol. 2007;7:678. doi: 10.1038/nri2156. [DOI] [PubMed] [Google Scholar]
- Liu F, Zhong-can OY. Phys Rev E: Stat Nonlinear Soft Matter Phys. 2006;73:010901. [Google Scholar]
- Liu B, Chen W, Evavold BD, Zhu C. Cell. 2014;157:357. doi: 10.1016/j.cell.2014.02.053. [DOI] [PMC free article] [PubMed] [Google Scholar]
- Liu B, Chen W, Zhu C. Ann Rev Phys Chem. 2015;66:427. doi: 10.1146/annurev-physchem-040214-121742. [DOI] [PubMed] [Google Scholar]
- Lou J, Zhu C. Biophys J. 2007;92:1471. doi: 10.1529/biophysj.106.097048. [DOI] [PMC free article] [PubMed] [Google Scholar]
- Lou J, Yago T, Klopocki AG, Mehta P, Chen W, Zarnitsyna VI, Bovin NV, Zhu C, McEver RP. J Cell Biol. 2006;174:1107. doi: 10.1083/jcb.200606056. [DOI] [PMC free article] [PubMed] [Google Scholar]
- Manibog K, Li H, Rakshit S, Sivasankar S. Nat Commun. 2014:5. doi: 10.1038/ncomms4941. [DOI] [PubMed] [Google Scholar]
- Marshall BT, Long M, Piper JW, Yago T, McEver RP, Zhu C. Nature. 2003;423:190. doi: 10.1038/nature01605. [DOI] [PubMed] [Google Scholar]
- Marsh M, Helenius A. Cell. 2006;124:729. doi: 10.1016/j.cell.2006.02.007. [DOI] [PMC free article] [PubMed] [Google Scholar]
- McEver RP, Cummings RD. J Clin Invest. 1997;100:485. doi: 10.1172/JCI119556. [DOI] [PMC free article] [PubMed] [Google Scholar]
- McEver RP, Zhu C. Ann Rev Cell Dev Biol. 2010;26:363. doi: 10.1146/annurev.cellbio.042308.113238. [DOI] [PMC free article] [PubMed] [Google Scholar]
- Morrison G, Hyeon C, Hinczewski M, Thirumalai D. Phys Rev Lett. 2011;106:138102. doi: 10.1103/PhysRevLett.106.138102. [DOI] [PMC free article] [PubMed] [Google Scholar]
- Parsons JT, Horwitz AR, Schwartz MA. Nat Rev Mol Cell Biol. 2010;11:633. doi: 10.1038/nrm2957. [DOI] [PMC free article] [PubMed] [Google Scholar]
- Pereverzev YV, Prezhdo OV, Forero M, Sokurenko EV, Thomas WE. Biophys J. 2005;89:1446. doi: 10.1529/biophysj.105.062158. [DOI] [PMC free article] [PubMed] [Google Scholar]
- Pereverzev YV, Prezhdo OV, Sokurenko EV. Phys Rev E. 2009;79:051913. doi: 10.1103/PhysRevE.79.051913. [DOI] [PubMed] [Google Scholar]
- Phan UT, Waldron TT, Springer TA. Nat Immunol. 2006;7:883. doi: 10.1038/ni1366. [DOI] [PMC free article] [PubMed] [Google Scholar]
- Pizarro-Cerdá J, Cossart P. Cell. 2006;124:715. doi: 10.1016/j.cell.2006.02.012. [DOI] [PubMed] [Google Scholar]
- Puklin-Faucher E, Gao M, Schulten K, Vogel V. J Cell Biol. 2006;175:349. doi: 10.1083/jcb.200602071. [DOI] [PMC free article] [PubMed] [Google Scholar]
- Rakshit S, Sivasankar S. Phys Chem Chem Phys. 2014;16:2211. doi: 10.1039/c3cp53963f. [DOI] [PubMed] [Google Scholar]
- Rakshit S, Zhang Y, Manibog K, Shafraz O, Sivasankar S. Proc Natl Acad Sci. 2012 doi: 10.1073/pnas.1208349109. [DOI] [PMC free article] [PubMed] [Google Scholar]
- Sarangapani KK, Qian J, Chen W, Zarnitsyna VI, Mehta P, Yago T, McEver RP, Zhu C. J Biol Chem. 2011;286:32749. doi: 10.1074/jbc.M111.240044. [DOI] [PMC free article] [PubMed] [Google Scholar]
- Sharma AK, Shtylla B, Chowdhury D. Phys Biol. 2014;11:036004. doi: 10.1088/1478-3975/11/3/036004. [DOI] [PubMed] [Google Scholar]
- Sokurenko EV, Vogel V, Thomas WE. Cell Host Microbe. 2008;4:314. doi: 10.1016/j.chom.2008.09.005. [DOI] [PMC free article] [PubMed] [Google Scholar]
- Somers WS, Tang J, Shaw GD, Camphausen RT. Cell. 2000;103:467. doi: 10.1016/s0092-8674(00)00138-0. [DOI] [PubMed] [Google Scholar]
- Springer TA. Proc Natl Acad Sci USA. 2009;106:91. [Google Scholar]
- Symposium CF. Cell Adhesion and Human Disease. John Wiley & Sons; 2008. [Google Scholar]
- Thomas WE, Trintchina E, Forero M, Vogel V, Sokurenko EV. Cell. 2002;109:913. doi: 10.1016/s0092-8674(02)00796-1. [DOI] [PubMed] [Google Scholar]
- Thomas W, Forero M, Yakovenko O, Nilsson L, Vicini P, Sokurenko E, Vogel V. Biophys J. 2006;90:753. doi: 10.1529/biophysj.105.066548. [DOI] [PMC free article] [PubMed] [Google Scholar]
- Traub O, Berk BC. Arterioscler Thromb Vasc Biol. 1998;18:677. doi: 10.1161/01.atv.18.5.677. [DOI] [PubMed] [Google Scholar]
- Vestweber D, Blanks JE. Physiol Rev. 1999;79:181. doi: 10.1152/physrev.1999.79.1.181. [DOI] [PubMed] [Google Scholar]
- Waldron TT, Springer TA. PNAS. 2009;106:85. doi: 10.1073/pnas.0810620105. [DOI] [PMC free article] [PubMed] [Google Scholar]
- Wayman AM, Chen W, McEver RP, Zhu C. Biophys J. 2010;99:1166. doi: 10.1016/j.bpj.2010.05.040. [DOI] [PMC free article] [PubMed] [Google Scholar]
- Wozniak MA, Modzelewska K, Kwong L, Keely PJ. Biochim Biophys Acta. 2004;1692:103. doi: 10.1016/j.bbamcr.2004.04.007. [DOI] [PubMed] [Google Scholar]
- Xiao B, Tong C, Jia X, Guo R, Lu S, Zhang Y, McEver RP, Zhu C, Long M. Biophys J. 2012;103:777. doi: 10.1016/j.bpj.2012.07.028. [DOI] [PMC free article] [PubMed] [Google Scholar]
- Zhu J, Zhu J, Springer TA. J Cell Biol. 2013;201:1053. doi: 10.1083/jcb.201212037. [DOI] [PMC free article] [PubMed] [Google Scholar]
- Zhuravlev PI, Hinczewski M, Chakrabarti S, Marqusee S, Thirumalai D. Proc Natl Acad Sci USA. 2016;113:E715. doi: 10.1073/pnas.1515730113. [DOI] [PMC free article] [PubMed] [Google Scholar]
- Zhurkov S. Inst J Fract Mech. 1965;1:311. [Google Scholar]
- Zoldak G, Rief M. Curr Opin Struct Biol. 2013:48. doi: 10.1016/j.sbi.2012.11.007. [DOI] [PubMed] [Google Scholar]


