

Abstract
Blood-borne extracellular vesicles (i.e. exosomes and microvesicles) carrying microRNAs (miRNAs) could make excellent biomarkers of disease and different physiologic states, including pregnancy status. We tested the hypothesis that circulating extracellular vesicle-derived miRNAs might differentiate the pregnancy status of cows that had maintained pregnancy to Day 30 from non-pregnant cows or from those that exhibited embryonic mortality between Days 17–30 of gestation. Cows were randomly assigned for artificial insemination with fertile semen (n= 36) or dead semen (n=8; control group) on Day 0 (day of estrus). Blood was collected from all animals on Day 0 and on Days 17 and 24 after artificial insemination. Cows receiving live sperm were retrospectively classified as pregnant on Day 30 (n=17) or exhibiting embryonic mortality between Days 17–30 (n=19). Extracellular vesicles from Day-17 and -24 samples were isolated from serum using ultra-centrifugation, and their presence was confirmed by nanoparticle tracking and Western blot analyses (for CD81) prior to RNA extraction. MicroRNA sequencing was performed on pregnant, embryonic-mortality, and control cows (n=4 per day), for a total of 24 independent reactions. In total, 214 miRNAs were identified in serum, 40 of which were novel. Based on differential abundance parameters, we identified 32 differentially abundant loci, representing 27 differentially abundant mature miRNA. At Days 17 and 24, specific miRNAs (e.g. miR-25, -16b and -3596) were identified that differentiated the pregnancy status. In summary, we identified several circulating extracellular vesicles derived miRNAs that differ in abundance between embryonic mortality and pregnant cows.
Keywords: embryo, bovine, small non-coding RNA, pregnancy, miRNA
Introduction
About 85–95% of beef cattle exposed to a single artificial insemination achieve successful fertilization (Maurer and Chenault 1983; Ahmad et al. 1995; Dunne et al. 2000), but a relatively high rate of early embryonic mortality is observed thereafter. Only about 60% of fertilized eggsresult in a pregnancy by Day 30 (Diskin et al. 2006; Diskin and Morris 2008), and a second phase of embryonic mortality occurs between Days 30 to 45 of gestation, which corresponds to the time when the chorioallantoic cotyledonary placenta is forming in cattle (Wiltbank et al. 2016). We previously developed an animal model to investigate some of the mechanisms underlying late embryonic mortality between Days 28 to 45 of gestation (Perry et al. 2005; Pohler et al. 2013; Pohler et al. 2015; Pohler et al. 2016). Bovine pregnancy-associated glycoproteins (PAGs) and real-time ultrasonography were then used in this model to help diagnose pregnancy in cows throughout gestation starting as early as Day 25 (Fricke 2002; Perry et al. 2005), Unfortunately, these data from PAGs and ultrasound provided no information on early embryonic loss between fertilization and Day 25 most likely due to limitation of these methods to identify early embryonic loss. Additional markers, such as the abundance of interferon-stimulated gene transcripts, have been evaluated in leukocytes to study this earlier period of embryonic loss (Gifford et al. 2007; Green et al. 2010), but expression of these genes is not necessarily an indication that a viable conceptus is present because this metric also changes upon exposure to viruses (even when asymptomatic). Nevertheless, an absence of interferon-stimulated gene transcripts may be a good marker of non-pregnant animals.
Extracellular vesicles are primarily classified as exosomes, which are derived from intraluminal vesicles present in multivesicular bodies, and microvesicles, which are derived from plasma membrane blebbing (Gould and Raposo 2013). The term is used to collectively describe these cell-secreted vesicles because their origin is not easily determined once released into bodily fluids. Studies suggest that extracellular vesicle-derived miRNAs can play specific roles in cell-to-cell communication and overall biological function (Camussi et al. 2010; Iguchi et al. 2010; Wang et al. 2010).
Circulating microRNAs (miRNAs) are proposed as novel biomarkers for physiological and disease states because they can be assayed in a non-invasive manner and are potentially predictive, specific, sensitive, and robust (Etheridge et al. 2011; Gilad et al. 2008). For example, over eight types of cancer (including lung, breast, and ovarian) are associated with specific extracellular vesicle-derived miRNAs, and are currently being evaluated as potential screening targets (Thind and Wilson 2016). Placenta-specific miRNAs are released and were shown to be detectable in the maternal circulation during pregnancy in women (Luo et al. 2009) and mares (Klohonatz et al. 2016). Therefore, we tested the hypothesis that specific circulating extracellular vesicle-derived miRNAs may differentiate the early pregnancy status of cows. The association between miRNAs and extracellular vesicles appears to enhance the miRNA half-life within blood serum or plasma (Valadi et al. 2007; Skog et al. 2008; Gallo et al. 2012), so we focused on this population of miRNAs to identify any that might be differentially abundant in pregnant versus embryonic-mortality cows at Days 17 and 24 of gestation.
Results
The expression of interferon-stimulated genes in leukocytes was measured in all animals on Days 0 and 17 of gestation (Figure 1). Qualitative measurements of ISG15 (Interferon-stimulated gene 15), MX2 (Myxovirus resistance 2), and OAS1 (2′-5′-Oligoadenylate Synthetase 1) were made to verify that cows were free of infection (viral) at the time of insemination and to determine the pregnancy status of live sperm-inseminated cows on Day 17 of pregnancy. Animals must have had an increase in transcripts of at least 2 of the 3 specific interferon-stimulated genes to be considered pregnant on Day 17.
Figure 1.
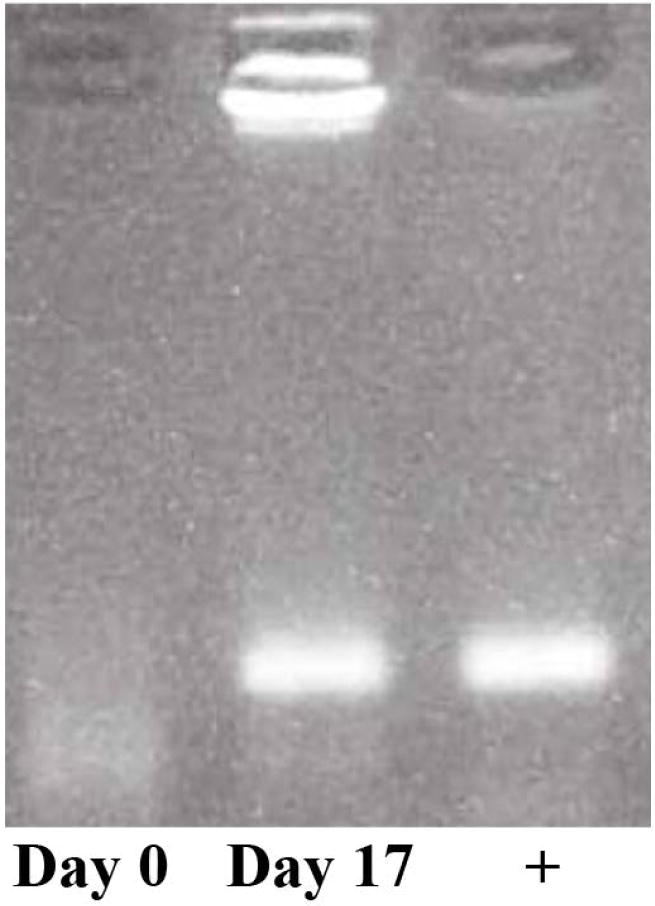
PCR of Interferon-stimulated genes. Representative gel showing PCR products of ISG15 (Interferon-stimulated gene 15) on Day 0 and 17 of gestation. Cows assigned to the pregnant and embryonic-mortality groups had low and increased interferon-stimulated gene transcript abundance on Day 0 and Day 17 of gestation, respectively; conversely, control cows had non-detectable or low interferon-stimulated gene transcript abundance on both days. Positive control lane (+) is also shown for amplicon size.
All animals submitted for deep sequencing had positive serum extracellular vesicle immunoreactivity for CD81 (Cluster of differentiation 81), a well-characterized extracellular vesicle protein marker, at both Days 17 and 24 (Figure 2a). Nanoparticle-tracking analysis revealed an overall extracellular vesicle mean diameter of 109±42 nm (mean ± standard deviation) for all animals whose extracellular vesicle-derived miRNAs were sequenced. The mean number of particles across all samples was 7.3±1.07 × 10⁷/ml of serum (mean ± standard deviation). No significant differences were detected among the groups in the total number or size of particles, or in circulating concentrations of progesterone on Days 17 or 24 among the pregnant, embryonic-mortality, and control (Day-17 controlled internal drug release implant) animals.
Figure 2.
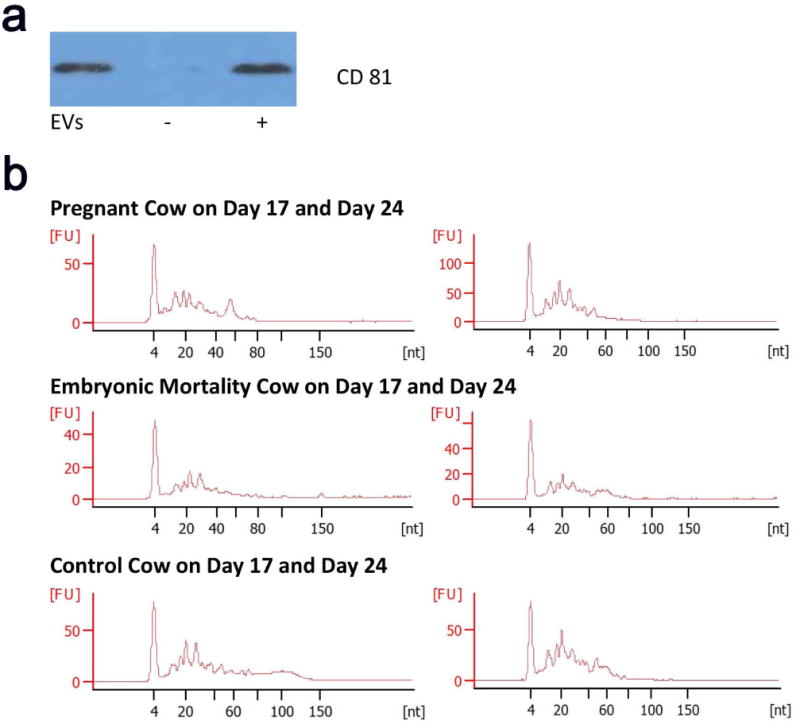
Evaluation of isolated extracellular vesicles and associated RNA. (a) Representative Western blot showing the presence of CD81, a well characterized marker, in serum-derived extracellular vesicles (EVs) from a cow assigned to the pregnant group, compared to negative (−) and positive (+) controls. All extracellular vesicle samples isolated from the pregnant, embryonic-mortality, and control groups possessed CD81. (b) Agilent electropherogram profiles of small RNAs extracted from circulating extracellular vesicles. The base pair length [nt] (x-axis) is plotted against the fluorescence units [FU] (y-axis). Note the clustering of RNA species below 60 bp in all samples.
The small-RNA profiles of purified extracellular vesicles from pregnant, embryonic-mortality, and control groups were collected using an Agilent 2100 Bioanalyzer (Figure 2b). The circulating extracellular vesicles among the groups contained mostly small-RNA species less than 60 bp in length, indicating that the extracted extracellular vesicles possessed small RNAs other than miRNAs. Small-RNA sequencing confirmed these findings, revealing multiple types of small RNAs in the samples (Figure 3). The highest percentage of the population was miRNAs (38%), followed by small nucleolar RNA (snoRNA) (21%), ribosomal RNA (rRNA) (12%), and small nuclear RNA (snRNA) (10%).
Figure 3.
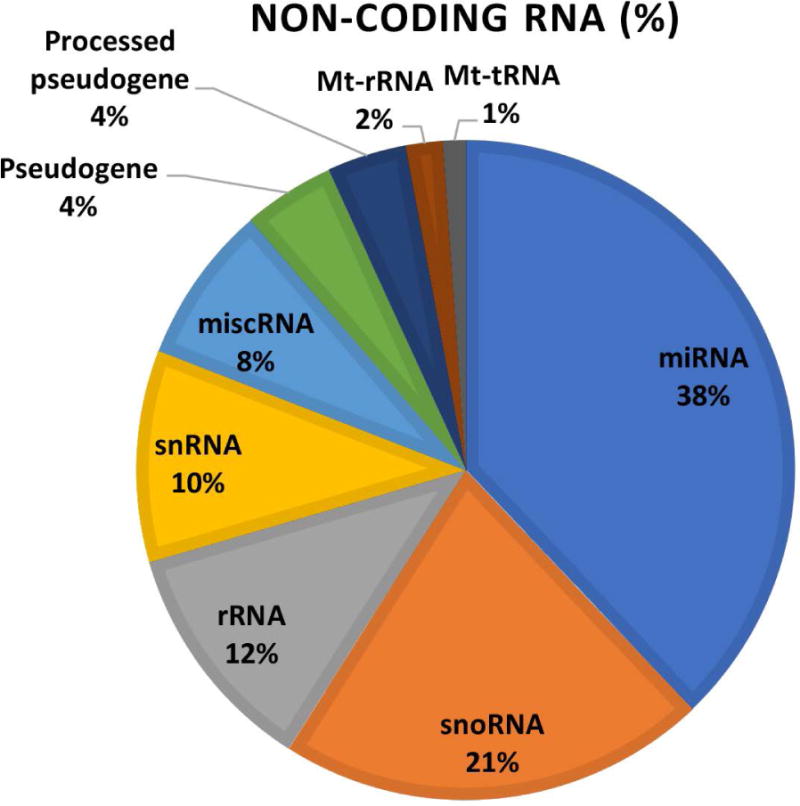
Percentage of small non-coding RNAs obtained from circulating extracellular vesicles. These data were aggregated from all cows, and are based on mapping criteria.
Deep sequencing of these small RNAs resulted in 7.5 and 9.2 million reads per sample, of which 5–7 million reads mapped to the genome. The miRNAs were identified using a systematic filtering process beginning with a length filter that selected for RNAs between 18 and 30 bases long. Alignment and mapping of the Day-17 and -24 samples yielded a total of 214 miRNAs across all groups, of which 40 were potential novel miRNAs (Table 1). The majority of these miRNAs (129/214) were represented in all samples; 166 miRNAs were found in 5 of 6 groups; and 178 miRNAs were in 4 of 6 groups (Table 1). Very few miRNA were present in only 1 group: 14 miRNAs fit this category, and 8 of those were specific to the Day-24 pregnant animals. However, these specific miRNA were in rather low abundance within these samples.
Table 1.
Summary of miRNA sequencing across all treatment groups at day 17 and 24.
| Control | EM | Pregnant | # Known | # Novel | |||
|---|---|---|---|---|---|---|---|
| day 17 | day 24 | day 17 | day 24 | day 17 | day 24 | miRNA | miRNA |
| ✓ | ✓ | ✓ | ✓ | ✓ | ✓ | 116 | 13 |
| ✓ | ✓ | ✓ | ✓ | ✕ | ✓ | 27 | 2 |
| ✓ | ✕ | ✓ | ✓ | ✕ | ✓ | 6 | 0 |
| ✕ | ✕ | ✕ | ✕ | ✕ | ✓ | 4 | 4 |
| ✕ | ✕ | ✓ | ✕ | ✕ | ✓ | 4 | 2 |
| ✓ | ✕ | ✕ | ✓ | ✕ | ✓ | 4 | 0 |
| ✕ | ✕ | ✕ | ✓ | ✕ | ✕ | 2 | 1 |
| ✓ | ✓ | ✕ | ✕ | ✕ | ✓ | 2 | 1 |
| ✓ | ✓ | ✕ | ✓ | ✕ | ✓ | 2 | 1 |
| ✕ | ✕ | ✕ | ✓ | ✕ | ✓ | 2 | 0 |
| ✓ | ✕ | ✓ | ✓ | ✕ | ✕ | 1 | 1 |
| ✕ | ✕ | ✓ | ✓ | ✕ | ✕ | 1 | 0 |
| ✕ | ✕ | ✓ | ✓ | ✓ | ✓ | 1 | 0 |
| ✓ | ✕ | ✕ | ✓ | ✕ | ✕ | 1 | 0 |
| ✓ | ✕ | ✓ | ✕ | ✕ | ✓ | 1 | 0 |
| ✓ | ✓ | ✓ | ✕ | ✓ | ✓ | 0 | 7 |
| ✕ | ✕ | ✓ | ✕ | ✕ | ✕ | 0 | 1 |
| ✕ | ✓ | ✕ | ✕ | ✕ | ✓ | 0 | 1 |
| ✕ | ✓ | ✕ | ✕ | ✓ | ✕ | 0 | 1 |
| ✕ | ✓ | ✕ | ✓ | ✓ | ✓ | 0 | 1 |
| ✓ | ✕ | ✕ | ✕ | ✕ | ✕ | 0 | 1 |
| ✓ | ✓ | ✕ | ✕ | ✕ | ✕ | 0 | 1 |
| ✓ | ✓ | ✕ | ✓ | ✓ | ✓ | 0 | 1 |
| ✓ | ✓ | ✓ | ✕ | ✕ | ✓ | 0 | 1 |
✓= miRNA were present in that specific group
✕= miRNA were not present in that specific group
Analysis using differential-abundance parameters for miRNAs (i.e. the miRNA had to have a count per million reads ≥10 in all 4 replicates from at least one of the two samples being compared) allowed us to identify 32 differentially abundant loci, representing 27 differentially abundant mature miRNA. The majority (27/32) of these differentially abundant miRNAs were elevated in the Day-17 embryonic mortality versus pregnant cows; one of these novel miRNAs was also significantly increased in the control compared to the pregnant group (Table 2). One miRNA was significantly increased between the embryonic-mortality and control group (Table 2), but no other differences were detected on Day 24 of gestation. The differential abundance of 3 of 4 mature miRNAs (miR-16a/b, -25, and -3596; not -100) at Day 17 of gestation was confirmed using reverse-transcription quantitative PCR, with all 3 present at lower levels in the pregnant cows versus those with embryonic mortality (Figure 4).
Table 2.
Extracellular vesicle derived miRNA with differential abundance in day 17 and 24 cows.*
| Day 17 - Pregnant vs EM | Counts per million (cpm) | ||||||||||
|---|---|---|---|---|---|---|---|---|---|---|---|
| Day 17 - Preg vs EM | EM-d17 | Pregnant-d17 | |||||||||
| Locus | miRNA | FC | FDR | 744D17 | 818D17 | 839D17 | 9614D17 | 2834D17 | 775D17 | 806D17 | 817D17 |
| chr1:19930511-19930532 | let-7c | −4.38 | 0.08 | 345.1 | 39.6 | 106.4 | 60.2 | 7.4 | 31.6 | 20.3 | 61.5 |
| chr15:33353437-33353458 | mir-100 | −4.41 | 0.07 | 110.8 | 23.4 | 118.5 | 27.9 | 7.6 | 14.6 | 15.6 | 24.0 |
| chr3:80666467-80666486 | mir-101-1 | −5.50 | 0.09 | 1199.8 | 176.3 | 2884.4 | 624.4 | 49.8 | 253.7 | 186.2 | 409.4 |
| chr8:39940843-39940862 | mir-101-2 | −5.46 | 0.09 | 1161.8 | 173.5 | 2913.8 | 643.1 | 54.8 | 257.5 | 186.0 | 409.0 |
| chr25:36892095-36892116 | mir-106b | −3.66 | 0.06 | 129.8 | 49.4 | 185.9 | 66.9 | 10.9 | 28.4 | 19.0 | 58.5 |
| chr1:19881359-19881380 | mir-125b-2 | −3.84 | 0.06 | 117.3 | 30.7 | 108.1 | 25.9 | 13.3 | 13.0 | 9.8 | 34.2 |
| chr21:67429798-67429819 | mir-127 | −4.68 | 0.06 | 435.1 | 99.4 | 183.9 | 52.8 | 23.6 | 34.9 | 41.7 | 54.8 |
| chr5:103859017-103859037 | mir-141 | −7.26 | 0.07 | 71.9 | 16.3 | 959.6 | 99.2 | 12.3 | 20.5 | 46.8 | 86.7 |
| chr7:62809359-62809379 | mir-143 | −5.19 | 0.08 | 6032.7 | 1139.5 | 3956.0 | 723.5 | 291.2 | 431.6 | 520.1 | 959.2 |
| chr4:70414256-70414277 | mir-148a | −4.16 | 0.09 | 39.3 | 10.9 | 104.4 | 54.1 | 5.1 | 4.0 | 8.7 | 32.8 |
| chr12:19596395-19596415 | mir-15a | −4.85 | 0.08 | 518.5 | 239.5 | 1153.4 | 245.4 | 17.0 | 162.9 | 88.8 | 177.9 |
| chr1:107923436-107923457 | mir-15b | −4.50 | 0.06 | 66.5 | 22.9 | 175.1 | 58.8 | 3.8 | 15.4 | 10.0 | 44.0 |
| chr12:19596254-19596275 | mir-16a | −4.94 | 0.07 | 633.6 | 184.7 | 1242.2 | 322.0 | 32.0 | 136.5 | 82.2 | 234.0 |
| chr1:107923291-107923312 | mir-16b | −4.86 | 0.08 | 4052.6 | 1424.3 | 7512.0 | 1767.8 | 214.9 | 965.2 | 439.0 | 1417.3 |
| chr14:1883889-1883911 | miR-1839 | −3.74 | 0.08 | 68.5 | 24.4 | 170.3 | 56.7 | 6.2 | 17.7 | 14.3 | 48.6 |
| chr16:40491616-40491636 | mir-199a-1 | −5.57 | 0.05 | 273.1 | 38.9 | 133.5 | 29.2 | 3.7 | 30.0 | 17.4 | 30.9 |
| chr11:98867682-98867702 | mir-199b | −5.01 | 0.06 | 264.8 | 38.6 | 140.0 | 28.2 | 4.1 | 34.5 | 18.8 | 33.4 |
| chr3:102923816-102923837 | mir-2415 | −4.20 | 0.06 | 40.0 | 85.0 | 83.7 | 23.0 | 3.8 | 27.7 | 4.5 | 17.4 |
| chr25:36892500-36892521 | mir-25 | −4.49 | 0.08 | 8499.1 | 8014.2 | 10757.4 | 2340.1 | 442.0 | 2448.6 | 1123.2 | 2448.4 |
| chr5:25109081-25109103 | mir-331 | −3.82 | 0.05 | 36.4 | 30.3 | 56.6 | 15.7 | 2.7 | 11.7 | 7.9 | 13.2 |
| chr7:18380018-18380037 | mir-339b | −4.17 | 0.09 | 147.6 | 233.1 | 215.0 | 47.0 | 4.2 | 71.0 | 22.2 | 53.9 |
| chr5:117120190-117120211 | mir-3596 | −4.49 | 0.08 | 445.9 | 61.7 | 403.1 | 175.3 | 18.5 | 42.3 | 53.4 | 124.7 |
| chr7:16508930-16508950 | mir-3604-1 | −5.26 | 0.05 | 278.8 | 42.9 | 153.9 | 30.2 | 4.4 | 38.2 | 18.5 | 31.3 |
| chr21:67603292-67603313 | mir-409b | −3.77 | 0.07 | 58.4 | 26.7 | 47.8 | 12.1 | 4.3 | 9.4 | 12.4 | 10.8 |
| chr19:20796893-20796915 | mir-451 | −5.89 | 0.06 | 7211.2 | 2283.3 | 7187.3 | 1688.8 | 171.8 | 1281.1 | 588.5 | 997.1 |
| chrX:62939343-62939363 | mir-652 | −3.50 | 0.09 | 52.5 | 21.6 | 121.4 | 51.8 | 5.0 | 11.5 | 17.7 | 37.0 |
| chr1:19931232-19931253 | mir-99a | −4.68 | 0.05 | 182.0 | 34.2 | 138.9 | 37.7 | 12.1 | 15.1 | 14.3 | 39.5 |
| chr3:94548627-94548648 | novel | −5.31 | 0.04 | 78.2 | 53.4 | 53.2 | 15.4 | 2.0 | 16.3 | 4.8 | 13.1 |
| chr6:113889878-113889895 | novel | −6.09 | 0.05 | 501.3 | 169.9 | 1396.4 | 389.1 | 52.1 | 111.2 | 113.9 | 119.5 |
| chr20:10975305-10975327 | novel | −6.52 | 0.06 | 99.0 | 13.1 | 578.5 | 29.9 | 35.4 | 14.3 | 32.8 | 24.7 |
| Day 17 - Pregnant vs Control | Day 17 - Preg vs Cont | Control- d17 | Pregnant-d17 | ||||||||
| Locus | miRNA | FC | FDR | 1163D17 | 8336D17 | 9D17 | BlkD17 | 2834D17 | 775D17 | 806D17 | 817D17 |
| chr6:113889878-113889895 | novel | −5.25 | 0.09 | 215.8 | 486.5 | 1096.7 | 447.2 | 52.1 | 111.2 | 113.9 | 119.5 |
| Day 24 - EM vs Control | Day 24 - EM vs Cont | Control-d24 | EM-d24 | ||||||||
| Locus | miRNA | FC | FDR | 1163D24 | 8336D24 | 9D24 | BlkD24 | 744D24 | 818D24 | 839D24 | 9614D24 |
| chr13:55227306-55227328 | mir-133a-1 | −18.59 | 0.10 | 6.3 | 220.3 | 2278.1 | 7.0 | 29.5 | 32.3 | 71.6 | 13.2 |
| chr24:34844466-34844488 | mir-133a-2 | −20.16 | 0.09 | 7.8 | 206.5 | 2272.4 | 8.0 | 26.1 | 34.0 | 61.5 | 12.9 |
Normalized sample counts (counts per million) ≥ 10 in all four samples in at least one of the two groups. Fold Change (FC) and False discovery rates (FDR) are shown for each miRNA as are the individual read counts for the four cows in each treatment group. Shading of samples represents the quantity of reads (red = increased quantity, light tan = decrease quantity).
Figure 4.
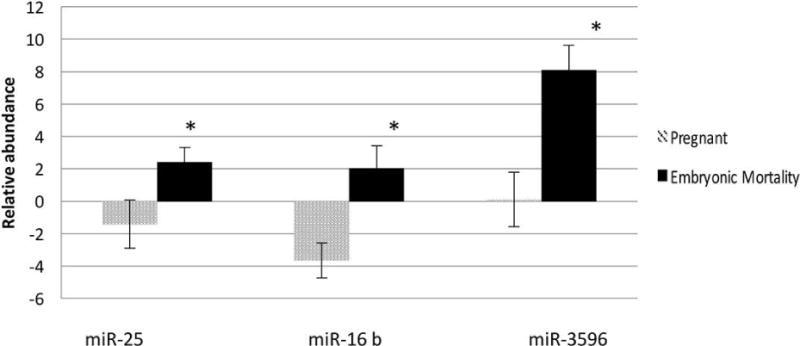
Detection of known extracellular vesicle-derived miRNA by reverse-transcription quantitative PCR in pregnant and embryonic-mortality cow. Four miRNAs identified by deep sequencing were tested at Day 17 of gestation. Three miRNAs (miR-16b, -25, and -3596) were significantly different in relative abundance between embryonic-mortality and pregnant cows (P<0.05); one (miR-100) was not validated by reverse-transcription quantitative PCR (data not shown).
The greatest difference existed between the embryonic mortality and pregnant groups, so we focused our Ingenuity Pathway Analysis (IPA) on the 27 known miRNA that were more abundant in the embryonic-mortality compared to pregnant group which were linked to the IPA classifications of Cancer, Connective Tissue Disorders, Organismal Injury and Abnormalities, Reproductive System Disease, and Endocrine Disorders (the top 5 network functions). These specifically included miRNAs associated with inflammation, cell proliferation, endometriosis, cell cycle progression, contraction, infection, late-onset preeclampsia, apoptosis, differentiation, uterine leiomyoma, ovarian endometriosis, and cell viability (Figure 5a). Specific gene networks related to these 27 miRNAs were also identified, including PTGS2 (Prostaglandin-endoperoxide Synthase 2), SLC38A1 (Solute carrier family 38 member 1/Amino acid transporter A1), IGF1R (Insulin-like growth factor 1 receptor), AKT (Protein kinase B), TRMT1 (tRNA methyltransferase 1), SNAI1 (Snail family transcriptional repressor 1), CG (Cathepsin G), CAMTA1 (Calmodulin-binding transcription activator 1), MAP2K1/2 (Mitogen-activated protein kinase 1), BCL6 (B-cell CLL/lymphoma 6), and TP53 (Tumor protein 53) (Figure 5b).
Figure 5.
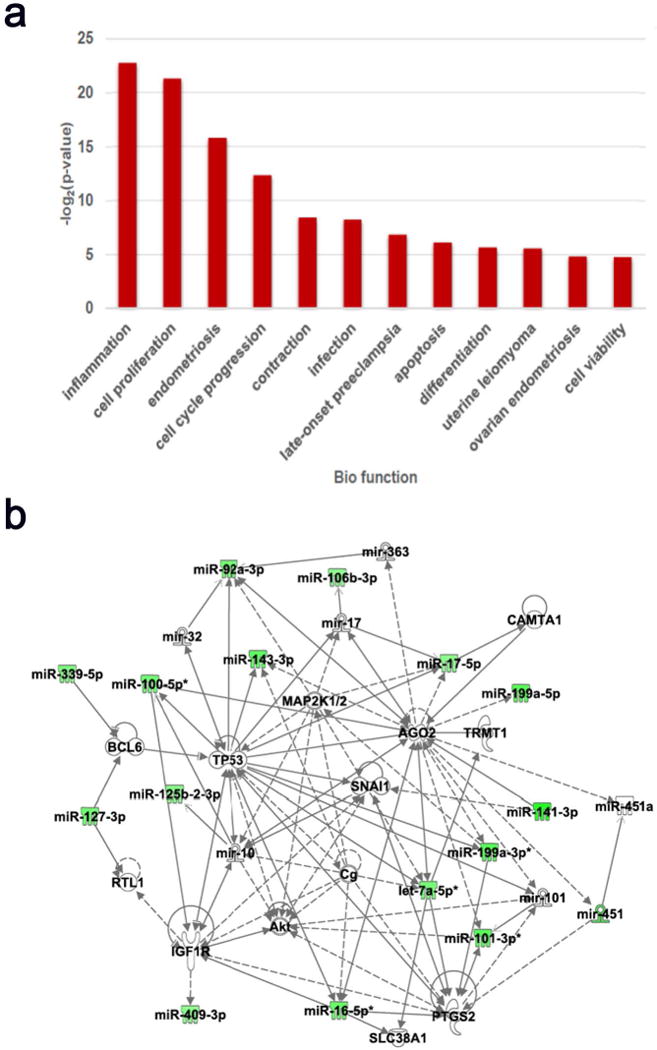
Biological function analysis of the 27 known miRNA that were differentially abundant between the embryonic-mortality and pregnant groups. (a) The differentially abundant miRNAs between the embryonic-mortality and pregnant groups are associated with significant up-regulation of the 12 listed functions on Day 17. (b) Network analysis showing the relationship of these differentially abundant miRNAs in relation to their significant targets
Discussion
During early pregnancy, the elongating bovine conceptus produces copious amounts of interferon-τau (IFN-τ) (Robinson et al. 2008), which is critical for maintaining or preventing the corpus luteum from undergoing regression, extending luteal concentrations of progesterone that are critical for pregnancy establishment (Godkin et al. 1984; Roberts et al. 1989). Many genes are regulated by IFN-τ (Spencer et al. 2008), including the products of interferon-stimulated genes expressed in peripheral leukocytes by Day 16 to 20 of gestation (Gifford et al. 2007; Stevenson et al. 2007; Green et al. 2010). The timing of leukocyte expression of interferon-stimulated genes, just after the bovine embryo begins to elongate into a filamentous conceptus at Day 15 (Spencer et al. 2008), was proposed as a marker of early pregnancy; however, the overall accuracy of for such gene expression is handicapped by the viral responsive nature of IFNs.
In this study, only pregnant, non-pregnant, and control cows that had specific interferon-stimulated responses between Days 0 and 17 of gestation were used. Pregnant and embryonic-mortality cows had to have increased expression of interferon-stimulated genes on Day 17 compared to Day 0, which indicated that both groups possessed an embryo capable of secreting IFN-τ on Day 17 of gestation. Conversely, interferon-stimulated gene expression in control animals had to remain low or decrease on Day 17 compared to Day 0, as a proxy for the absence of an embryo on Day 17 of gestation. We believe that selecting animals based on these specific profiles was a key factor for the results obtained, and justified the direct comparison of Day-17 pregnant and embryonic-mortality animals.
Circulating miRNAs are used as biomarkers for a number of human diseases and physiological states (reviewed by Reid et al. 2011). Furthermore, specific miRNAs were detected in serum and plasma collected from pregnant women during gestation (Gilad et al. 2008), many of which were derived from human villous trophoblasts (e.g. miRNA 512-3p, 517-a, 517-b, 518-b and 519-a) and circulate in maternal blood within or associated with extracellular vesicles (Luo et al. 2009; Miura et al. 2010; Kotlabova et al. 2011). Such circulating, extracellular vesicle-derived miRNAs in maternal serum that are specific to pregnancy were also reported in the mare (Cameron et al. 2011; Klohonatz et al. 2016). In addition, miRNA populations extracted from whole blood appear to differ between pregnant and non-pregnant heifers as early as Day 16 of gestation – although whether or not these miRNAs originated from extracellular vesicles is not known (Ioannidis and Donadeu 2016). Burns and colleagues reported the differential abundance of miRNAs and protein in microvesicles of uterine flushes from pregnant and cycling ewes on Day 14 of gestation (Burns et al., 2014). These authors did not specifically designate these ovine microvesicles as true extracellular vesicles, although their size and protein profile support such a hypothesis. Indeed, a follow up study provided evidence that extracellular vesicles produced from the trophectoderm and uterine epithelia in the pregnant ewe are involved in intercellular communication (Burns et al. 2016).
In the current study, differences in the abundance of circulating extracellular vesicle-derived miRNAs were identified between pregnant and embryonic-mortality cows. A total of 194 and 211 miRNAs from Days 17 and 24 of gestation, respectively, were mapped to the reference genome. A notable number of miRNAs were present in higher abundance from either control or embryonic-mortality cows compared to pregnant animals on Day 17. By comparison, 27 miRNAs were specific to cycling (non-pregnant) ewes compared to one unique miRNA in the uterine flushings of pregnant ewes on Day 14 (Burns et al. 2014), which correlates with what we observed in circulation. Given that placental products or pregnancy-specific products, such as pregnancy-associated glycoproteins, are detectable in maternal circulation quite early during pregnancy (Pohler et al. 2013; Pohler et al. 2016), we hypothesized that circulating, pregnancy-specific miRNAs would also be evident at Day 17 or Day 24. This was not the case for circulating, extracellular vesicle-derived miRNAs in cattle.
Extracellular vesicles can act as intercellular transfer vehicles for miRNAs (Valadi et al. 2007; Raposo and Stoorvogel 2013). Chevillet and colleagues demonstrated that, on average, most extracellular vesicles actually carry less than a single copy of miRNA (0.00825±0.02 miRNAs per extracellular vesicle) (Chevillet et al. 2014), indicating that multiple extracellular vesicles, with the same miRNA cargo, would be required to influence the biological function of target cells. This stoichiometry highlights a model that novel miRNAs for the detection of pregnancy or embryonic mortality may actually decrease instead of increase in abundance due to how the miRNAs are utilized. If each extracellular vesicle indeed carries less than a single miRNA, then the large differences we observed in miRNA between the pregnant, embryonic-mortality, and control samples suggest that these particular miRNAs are biologically relevant. Three miRNAs (miR-25, -16a/b, and -3596) were more abundant in the Day-17 embryonic-mortality group compared to both the pregnant and control groups. Specifically, miR-25 was previously shown to be highly expressed in fetal tissue (Coutinho et al. 2007), but the relevance of this observation is unclear because its ability to traverse the fetal/maternal interface is unknown. The biological significant of an increase in miR-25 abundance in embryonic-mortality cows could indicate early embryonic death or a systemic response to pregnancy loss. Pathway analysis indicated that the changes to specific miRNAs in embryonic-mortality versus pregnant animals could affect the up-regulation of a pathway involving Prostaglandin-endoperoxide synthase 2, which is the rate-limiting enzyme for prostaglandin production (Bazer 2013). Thus, we hypothesize that these embryonic mortality-specific miRNAs may be dispersed to increase prostaglandin production, leading to corpus luteum regression. Identifying the source of these miRNA-containing extracellular vesicles as well as understanding how they are packaged and shuttled within circulating need to be closely examined to clarify the biological significance of extracellular vesicle-mediated transfer of miRNA, as reported for biologically active extracellular vesicles carrying functional miRNA, mRNA, and proteins in cancers and viral-resistant placentas (Skog et al. 2008; Delorme-Axford et al. 2013; Morello et al. 2013).
The bovine extracellular vesicles that we harvested from each experimental group contained a large number of small RNA species (< 200 nt) across treatment groups. These data are consistent with evidence in humans that synctiotrophoblast cells produce extracellular vesicles containing miRNAs that are found in maternal circulation (Luo et al. 2009) as well as extracellular vesicles containing miRNAs in ovine uterine flushings (Burns et al. 2014). Profiles of microvesicles clearly indicate that miRNAs are not the sole small RNAs present in extracellular vesicles or microvesicles (Burns et al., 2014). Other small RNAs (all <200 nt in length) – such as Piwi-interacting RNAs, small-interfering RNAs, and repeat-associated RNAs – were shown to associate with spermatogenesis and to function in early embryonic development (He et al. 2009; Krawetz et al. 2011). Such small RNAs can direct protein binding at specific nucleotide bases, thereby providing sequence-specific regulation at the transcriptional, chromatin, or post-transcriptional levels (Pillai 2005; Carthew 2006; Ambros and Chen 2007).
The roles of miRNAs in biological systems are the most clearly defined, especially in regards to the epigenetic modification of gene transcription (Kim et al. 2008; Valeri et al. 2009; Khraiwesh et al. 2010). miRNAs are highly conserved across species, and thus the function of a miRNA in one species can often be applied to another (Massirer and Pasquinelli 2006). Although the present study identified specific miRNAs that differed in abundance between pregnant and non-pregnant groups, their exact function and/or source remain unclear. One model we hypothesize is that these specific miRNAs result from processes leading to pregnancy establishment or embryonic mortality, including inflammation, a maternal immune response, or maternal recognition of pregnancy. Expression of interferon-stimulated genes in white blood cells increases up from Days 16 to 20 (Gifford et al. 2007; Stevenson et al. 2007; Green et al. 2010), and extracellular vesicle-derived miRNA can be produced and released from white blood cells (Marques-Rocha et al. 2016; Pugholm et al. 2016). Therefore, one potential source of the extracellular vesicle-derived miRNAs identified in this study is the population of inflammatory white blood cells present on Days 17 and 24 of gestation.
Results of this study support the idea that extracellular vesicle-derived miRNAs may provide a useful biomarker for reproduction related fields. Validation of the identified, differentially abundant miRNAs needs to be evaluated in larger cohorts to determine the robustness of the biomarkers and to move the technology to a high throughput platform for the diagnosis of early pregnancy success or embryonic mortality. Achieving such an assay that allows for detection of individual miRNA and that distinguishes between pregnant and embryonic-mortality animals will greatly advance our understanding of early pregnancy establishment and embryonic mortality.
Materials and Methods
Treatment
The University of Missouri Institutional Animal and Care and Use Committee approved all animal experimental procedures. Estrous cycles of post-partum, suckled beef cows (n=44), from the University of Missouri Beef Research and Teaching Farm, were synchronized with the 7-day CO-synch plus controlled internal drug release (CIDR) synchronization protocol (Figure 6): 100 μg of Gonadotropin-releasing hormone in 2 ml (Cystorelin) (Merial, Duluth, GA, USA), injected intramuscularly, and an Eazi-Breed CIDR insert containing 1.38 g progesterone (Zoetis, New York, NY, USA) on Day -9; 25 mg Prostaglandin F2α in 5 ml (Lutalyse) (Zoetis, New York, NY, USA), injected intramuscularly; CIDR removal on Day -2; a second injection of 100 μg Gonadotropin-releasing hormone in 2 ml (Cystorelin) (Merial, Duluth, GA, USA), 66 h after Prostaglandin F2α; and finally artificial insemination on Day 0. The same sire was used to inseminate all cows; 36 cows were inseminated with live sperm and 8 control cows were inseminated with dead sperm. Control cows received dead semen (motility was no longer present) to ensure that all animals were exposed to the same seminal plasma and sperm, since both are known to contain miRNAs.
Figure 6.
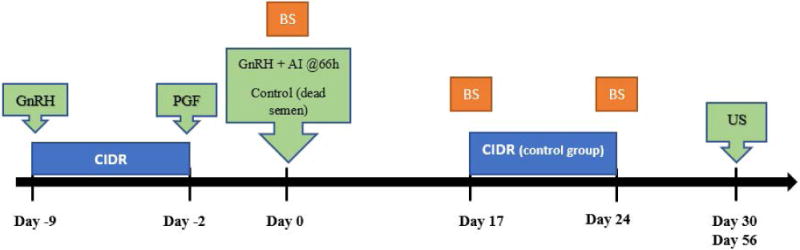
Experimental design. Lactating beef cows (n =44) were synchronized with the Co-synch + controlled internal drug release (CIDR) protocol. Administration of gonadotropin-releasing hormone (GnRH) and CIDR on Day -9; prostaglandin F2α (PGF) on Day -2; and fixed timed artificial insemination and GnRH administration on Day 0. Cows were divided into two groups: those artificially inseminated (AI) with live sperm (n=36) or receiving dead sperm (n=8). Control cows received a CIDR from Day 17 until Day 24 of gestation to maintain elevated circulating concentrations of progesterone. Blood (BS) was collected on Days 0, 17, and 24. Pregnancy status was determined by transrectal ultrasound (US) on Days 30 and 56 of gestation.
Control cows received a CIDR on Day 17 to maintain a similar level of progesterone as in the cows that established pregnancy; this insert was present from Days 17 to 30, the period of pregnancy diagnosis, to maintain a similar level of progesterone as the cows that established pregnancy from Days 17 to 30. This was done because the control cows would normally regress the functional corpus luteum around Day 17 of the estrous cycle. Cows in the live-sperm artificial insemination group were subsequently divided into two groups following the Day 30 pregnancy diagnosis: pregnant group (pregnancy established and maintained to Day 30; n=17) and embryonic-mortality group (pregnancy established, but not maintained to Day 30; n=19). Embryo mortality was distinguished from failure to conceive by the positive detection of increased expression of interferon-stimulated genes (ISG15 [Interferon-stimulated protein, 15 kDa], MX2 [Myxovirus resistance 2], or OAS1 [2′-5′-Oligoadenylate Synthetase 1]) (Green et al., 2010) on Day 17 compared to Day 0, but no embryo was present on Day 30. Embryos were detected on Day 30 by transrectal ultrasound, and were deemed alive by visualization of an embryonic/fetal heartbeat. Control cows included in the experiment exhibited either a decrease or no change in transcript abundance of interferon-stimulated genes from Days 0 to 17 of gestation. This specific control group was included to compare the circulating extracellular vesicle-derived miRNAs in cows that could not have conceived with the pregnant or embryonic-mortality groups (Figure 5).
Blood Collection
All cows were bled at the time of artificial insemination (Day 0), Day 17, and Day 24. Blood serum and plasma samples were harvested by venipuncture into a 10-ml vacutainer tube (Becton, Dickinson, and Company, Franklin Lakes, New Jersey, USA) and a 10-ml ethylene diamine triacetic acid (EDTA)-treated vacutainer tube (Becton, Dickinson, and Company), respectively. The serum tube was allowed to clot at room temperature for 1 hour before being placed in a 4°C refrigerator for approximately 24 hours. Serum was collected following centrifugation, and stored at −80°C until measurement of progesterone or extracellular vesicle extraction. The plasma sample was immediately placed on ice, where it remained until centrifugation. Plasma was decanted, and white blood cells were collected by buffy coat extraction (Stevenson et al. 2007). White blood cells were harvested on Days 0 and 17.
Progesterone Assays
Serum progesterone concentrations were quantified by radioimmunoassay with a Coat-a-Count RIA kit (Diagnostic Products Corporation, Los Angeles, CA), as described previously by Kirby et al. (1997). Intra-assay coefficients of variations were 4.82%, and the assay sensitivity was 0.08 ng/ml for the progesterone assay. Serum concentrations were analyzed using SAS 9.4 PROC GLM package.
White blood cell RNA extraction and cDNA synthesis
White blood cell buffy coats were extracted for RNA using Trizol reagent (Life Technologies, Carlsbad, CA, USA) according to the manufacturer’s recommendations. Complementary DNA was synthesized from 2 μg of RNA using the PrimeScript™ First Strand cDNA Synthesis Kit (item 6110A; lot: AK3101) from Takara Bio Inc. (Shiga, Japan), based on the manufacturer’s recommendations.
PCR for interferon-stimulated gene expression
Leukocyte RNA was prepared for PCR with AccuPrime™ Taq: 2.5 μl of AccuPrime™ Buffer, 0.5 μl of 60 ng/μl forward and reverse primers (Table 3), 0.5 μl AccuPrime™ Taq DNA Polymerase, 21 μl of water, and 0.5 μl of cDNA were used per reaction, as previously described (Green et al. 2010). PCR reaction conditions were: 95°C for 2 minutes; 40 cycles of 95°C for 30 seconds, 54°C for 20 seconds; 68°C for 4 minutes; and then a hold at 4°C. PCR reactions were separated on a 1% agarose gel containing 1 μg/ml ethidium bromide to visualize the products. Interferon-stimulated gene expression was then determined by the presence or absence of product (ISG15 [Interferon-stimulated protein, 15 kDa], MX2 [Myxovirus resistance 2], or OAS1 [2′-5′-Oligoadenylate Synthetase 1]). RPL7 (Ribosome protein L7) was used as a positive control for all samples.
Table 3.
Gene, GeneBank Number, primer sequence (forward and reverse primer; 5′ to 3′) and location of the primer within the Genebank sequence for genes amplified during PCR and qPCR.
| Gene | GeneBank | Primer | Primer Sequence | Primer location |
|---|---|---|---|---|
| ISG15 | 174366 | Forward | 5′-CAGCCAACCAGTGTCTGCAGAGA-3′ | 14–36 |
| Reverse | 5′-CCAGGATGGAGATGCAGTTCTGC-3′ | 284–306 | ||
| MX2 | 173941 | Forward | 5′-CTTCAGAGACGCCTCAGTCG-3′ | 2071–90 |
| Reverse | 5′-TGAAGCAGCCAGGAATAGTG-3′ | 2283–02 | ||
| OAS1 | 001040606 | Forward | 5′-ACCCTCTCCAGGAATCCAGT-3′ | 1157–76 |
| Reverse | 5′-GATTCTGGTCCCAGGTCTGA-3′ | 1336–55 | ||
| RPL7 | 001014928 | Forward | 5′-AGGATGGCACGAAAAGCCGGT-3′ | |
| Reverse | 5′-TCGAACCTTTGGGCTCACACCA-3′ |
Extracellular vesicle isolation
Extracellular vesicles were isolated from 2 ml of serum on Days 17 and 24, following a modified protocol (Théry et al. 2006; Hung and Leonard 2015). Samples from each cow and time point were handled individually and never pooled. Each 2-ml sample was centrifuged for 10 min at 300×g to remove any cellular debris. Cleared supernatant was added to ultracentrifuge tubes (Beckman Coulter 347357), and an additional 2.5 ml of phosphate-buffered saline (PBS) was added to each sample. Samples were subsequently spun at 2000×g for 20 minutes at 4°C, and the resultant supernatant was transferred into fresh ultra-centrifuge tubes, and spun again at 18,000×g for 45 minutes at 4°C. Supernatant from this spin was filtered through a Millex GP 0.22-μm filter into a new ultra-centrifuge tube using a 5-ml insulin syringe. The filter was rinsed with PBS, and the tubes were balanced with PBS. Samples were centrifuged at 110,000×g for 3 h at 4°C. A visible white pellet could be seen for each of the samples in the tubes after this 3-h spin. Pellets were rinsed with PBS and spun for an additional 90 min at 110,000×g. Cleaned pellets were suspended in 50 μl of PBS; 5 μl was saved for Western blot analysis and nanoparticle tracking while the remainder was used for RNA extraction, as described below.
Western Blot Analysis
Purified extracellular vesicles were suspended in 40 μl of M-PER (Thermo Scientific) with HALT protease inhibitor cocktail (Thermo Scientific) for 15 minutes on a tube rotator at room temperature. Lysates were mixed with Laemmli sample buffer (31.5 mM Tris-HCl, pH 6.8; 10% glycerol; 5% β-mercaptoethanol; 1% SDS; 0.01% bromophenol blue), denatured at 95°C for 5 min, and separated by denaturing gel electrophoresis on 12% polyacrylamide gels at a constant voltage of 150 V for approximately 60 minutes in 1× running buffer (25 mM Tris, 192 mM glycine, 0.1% SDS). Protein was transferred at 100 V for 60 minutes to 0.45 μm Protran BA 85 nitrocellulose membrane (GE Healthcare, Buckinghamshire, UK) in Towbin transfer buffer (25 mM Tris, 192 mM glycine, 20% methanol). Membranes were placed for 1 hour at room temperature in blocking buffer (Tris-buffered saline, 5% non-fat dry milk, 0.1% Tween 20) before incubation for 1 hour at 4°C with primary anti-CD81 antibody (Santa Cruz Biotechnology, Dallas, TX, USA) diluted 1:20,000 in blocking buffer (Mathivanan et al. 2010). Membranes were washed with TBS containing 0.1% Tween 20 (TBST) before incubation for 1 hour at room temperature with horseradish peroxidase-conjugated goat anti-rabbit secondary antibody (Santa Cruz Biotechnology, Dallas, TX, USA), diluted 1:10,000 dilution. Membranes were then washed with excess TBST, and incubated with SuperSignal West Pico Chemiluminescent Substrate (Thermo Scientific) for 3 minutes prior to imaging with a ChemiDoc MP system and Image Lab 4.1 software (BioRad, Hercules, CA).
Nanoparticle tracking analysis
Quantification of nanoparticles was conducted according to the method reported by Navakanitworakul et al. (2016). All nanoparticle quantification was performed on a NanoSight LM-10HS (Malvern Instruments Ltd, Worcestershire, UK). Prior to quantification, aliquots were diluted to approximately 1–8×10⁸ per millimeter to conduct the analysis. For quantification purposes, 3 videos were recorded for 60 seconds and subsequently analyzed using the Nanosight NTA 2.4 software (Malvern Instruments Ltd, Worcestershire, UK). All samples were quantified in triplicate. Data were then analyzed using SAS 9.4 PROC GLM package.
MiRNA extraction
Extraction of RNA was performed with Trizol reagent, based on the manufacturer’s recommendations. The quantity and quality of small RNAs were evaluated on a small RNA Labchip kit (Agilent Technologies) using an Agilent 2100 Bioanalyzer, according to the manufacture’s recommendations.
miRNA sequencing
All miRNA sequencing was performed on the Illumina HiSeq2500 system at the University of Kansas Medical Center - Genomics Core (Kansas City, KS). Extracellular vesicle RNA (ranging from 1.8–100 ng) was used to initiate the TruSeq Small RNA library preparation protocol (Illumina#RS200-0012 kit A). The extracellular vesicle RNA was ligated with 3ʹ and 5ʹ RNA adapters, followed by a modified reverse-transcription reaction and PCR amplification. Due to low starting quantities of RNA, reversed transcription of the RNA adapter-ligated samples performed in duplicate reactions each containing 6 μl of the 3ʹ- or 5ʹ-ligated RNA. The 12.5 μl yield of each duplicate reverse transcription reaction was pooled to obtain 25 μl of homogeneous cDNA. The subsequent PCR amplification, with index adapter incorporation, was modified by replacing 8.5 μl of ultra-pure water in the PCR master mix with 8.5 μl of the pooled cDNA (21 μl total). The modified PCR reaction was performed with 15 cycles of amplification.
Size selection and purification of the cDNA libraries were conducted using 3% marker H gel cassettes on the Pippin Prep size fractionation system (Sage Science). The Agilent 2100 Bioanalyzer was used with the High Sensitivity DNA kit (Agilent #5067-4626) or the DNA1000 kit (Agilent #5067-1504) to validate the purified libraries. Libraries were quantified on the Illumina ECO Real-Time PCR System using KAPA SYBR Universal Library Quant kit - Illumina (KAPA Biosystems KK4824). Quantified libraries were then adjusted to a 2 nM concentration, and pooled for multiplex sequencing. Libraries were denatured and diluted to the appropriate picomolar concentration (based on quantitative PCR results), followed by clonal clustering onto the sequencing flow cell using the TruSeq Rapid Single Read Cluster Kit-HS (Illumina GD402-4001). Clonal clustering was performed using the automated Illumina cBOT Cluster Station. The clustered flow cell was sequenced on an Illumina HiSeq 2500 Sequencing System in Rapid Read mode, with a 1×50 cycle read and index read, using the TruSeq Rapid SBS kit-HS (Illumina FC402-4002). Sequencing was performed to obtain an unbiased global profile of small RNA in the three groups (control, embryonic-mortality, and pregnant) on Days 17 and 24. The groups were analyzed in biological quadruplicates, giving 24 samples in total. High-throughput sequencing was performed at 50-bp, single-end resolution. Following collection, sequence data was converted from .bcl file format to FASTQ files, and sorted based on the particular index sequence present for further downstream analysis. All sequence data was deposited into Gene Expression Omnibus for public access (SRP110030).
Processing of Small RNA Data
The strategy for mapping and identification of known and novel miRNAs was previously validated (Navakanitworakul et al. 2016). After 3′ adapter removal, the sequencing reads were mapped using Bowtie2 software (Langmead and Salzberg 2012), in the local-sensitive mode, to the bovine genome (assembly UMD3.1). The mapped reads were further processed as follows: The reads from all 24 samples were merged and scanned for high-density regions, defined as a contiguous region whose read count at each base is not less than 20% of the highest base read count for the locus. These high-density regions formed the effective region of the locus, and its length was its effective length. Loci with an effective length ≥18 bp were retained. The number of reads mapped to the effective region in each sample formed the effective read counts. Loci were further filtered on their normalized effective read counts (normalized to the number of counts per million reads [cpm]), retaining only those loci with a cpm ≥10 in all 4 replicate samples in at least one of the six biological conditions. The distribution of these loci (miRNA) across the different biological conditions is shown in Table 1. These loci were used for down-stream analysis.
The effective regions were annotated for genomic features from the Ensemble gene annotation file for bovine (release 70) and miRBase (release 21). Effective regions that mapped to annotated bovine mature miRNAs were first identified; the remaining effective regions were compared to known miRNAs from both bovine and other species found in miRBase (release 21). A region was labeled as a miRNA by homology if it passed the following criteria: a gapless alignment of the effective region to the mature reference miRNA with at most 2 mismatches in the core, at most 1 gap per mismatch at the 5′ and 3′ ends, and less than 10% mismatches in the alignment of the reference hair-pin sequence to the extended locus region in the genome. Novel, computationally identified miRNAs were validated based on the criteria that the extended effective region should have a predicted pre-miRNA-like hairpin structure (Jiang et al. 2007) with the effective region falling in the stem region with at least 80% pairing (Navakanitworakul et al. 2016).
Generalized linear models developed for multi-group experiments, available from the edgeR software package (Robinson et al. 2010), were used to determine significantly differently expressed miRNA between the different conditions. For differential expression analysis, miRNA had to have a cpm ≥10 in all 4 replicate samples in at least one of the two groups being compared. The edgeR package employs advance empirical Bayes methods to estimate miRNA-specific biological variation under minimal levels of biological replication. The RNA composition in each sample was normalized in edgeR using the trimmed mean of M-values method. The associated p-values were corrected for multiple-hypothesis testing (false-discovery rate) by the Benjamini and Hochberg method (Benjamini and Hochberg 1995). Absolute expression differences ≥1.5 with a false-discovery rate ≤ 0.1 were considered significant.
Biological Functional Analysis
The biological functions associated with differentially abundant miRNA in Day-17 pregnant versus embryonic-mortality samples were obtained using Ingenuity Systems Pathway analysis (www.ingenuity.com) software. Ingenuity Pathway Analysis (IPA) consists of a comprehensive knowledge base of known molecular interactions, including miRNAs, and computes an enrichment score for different biological functions based on the uploaded genes. Knowledge base of IPA is confined to information on gene and gene products of human, mouse, or rat, so the bovine miRNA references were converted to their best-match human or mouse homologs before uploading to IPA. Enriched biological functions for a set of miRNA is inferred by the p-value of the measure of likelihood of the overlap of target miRNA and the genes in the relevant biological function calculated using the right tailed Fisher’s exact test. Biological functions with an associated p-value ≤0.05 were considered enriched for the target miRNA.
Quantitative PCR
Small RNAs isolated, as described above and previously used for Illumina sequencing, was polyadenylated, followed by cDNA synthesis using a poly-T primer with a 3′ degenerate anchor and a 5′ universal tag (Exiqon miRCURY LNA™ System), according to manufacturer’s recommendations. The cDNA template was then amplified using miRNA-specific and Locked nucleic acid (LNA)™- enhanced forward and reverse primers using SYBR Green detection in an ABI 7300 real time PCR machine. Exiqon LNA miRNA primer sets were used to amplify miRNA sequences (Catalog # 204306, 2114063, 204361, 206037); reactions without template were used as negative controls. Threshold measurements were set in the linear region of the amplification plot above the baseline, and quantification cycles were determined based on the cycle number in which the threshold line intersected the amplification line (Ambros and Chen 2007). The LNA-specific control primer SNORD 49A (#203904) was used as the reference gene in all reactions for data normalization. This specific control primer was also screened in the sequenced data and confirmed to not change across all samples. Abundance values were calculated using the mean (2−ΔΔCt) of the SNORD 49A reference in the control samples, which were considered as baseline, and the mean Ct values of the target miRNAs. Quantitative PCR results were analyzed using SAS 9.4 PROC GLM package.
Acknowledgments
Funding: AFRI Grant no. 2013-67015-21076 from the USDA National Institute of Food and Agriculture. Hatch/Multistate Project W3112-TEN00506 Reproduction from the USDA National Institute of Food and Agriculture. HD061580 and HD082484 from the Kansas Intellectual and Developmental Disability Research Center (National Institute of Child Health and Human Development-HD02528) and COBRE P20 RR024214.
Abbreviations
- CD81
Cluster of differentiation 81
- IFN-τ
Interferon-τau
- miRNA
microRNA
References
- Ahmad N, Schrick FN, Butcher RL, Inskeep EK. Effect of persistent follicles on early embryonic losses in beef cows. Biol Reprod. 1995;52:1129–1135. doi: 10.1095/biolreprod52.5.1129. [DOI] [PubMed] [Google Scholar]
- Ambros V, Chen X. The regulation of genes and genomes by small RNAs. Development. 2007;134:1635–1641. doi: 10.1242/dev.002006. [DOI] [PubMed] [Google Scholar]
- Bazer FW. Pregnancy recognition signaling mechanisms in ruminants and pigs. J Animal Sci and Biotech. 2013;4:1. doi: 10.1186/2049-1891-4-23. [DOI] [PMC free article] [PubMed] [Google Scholar]
- Benjamini Y, Hochberg Y. Controlling the false discovery rate: a practical and powerful approach to multiple testing. J Royal Stats Society Series B (Methodological) 1995:289–300. [Google Scholar]
- Burns G, Brooks K, Wildung M, Navakanitworakul R, Christenson LK, Spencer TE. Extracellular Vesicles in Luminal Fluid of the Ovine Uterus. PLoS One. 2014;9:1–11. doi: 10.1371/journal.pone.0090913. [DOI] [PMC free article] [PubMed] [Google Scholar]
- Burns GW, Brooks KE, Spencer TE. Extracellular Vesicles Originate from the Conceptus and Uterus During Early Pregnancy in Sheep. Biol Reprod. 2016;115:134973. doi: 10.1095/biolreprod.115.134973. [DOI] [PubMed] [Google Scholar]
- Cameron A, da Silveira J, Bouma G, Bruemmer J. Evaluation of exosomes containing miRNA as an indicator of pregnancy status in the mare. J Equine Vet Sci. 2011;31:314–315. [Google Scholar]
- Camussi G, Deregibus MC, Bruno S, Cantaluppi V, Biancone L. Exosomes/microvesicles as a mechanism of cell-to-cell communication. Kidney Int. 2010;78:838–848. doi: 10.1038/ki.2010.278. [DOI] [PubMed] [Google Scholar]
- Carthew RW. A new RNA dimension to genome control. Science. 2006;313:305–306. doi: 10.1126/science.1131186. [DOI] [PubMed] [Google Scholar]
- Chevillet JR, Kang Q, Ruf IK, Briggs HA, Vojtech LN, Hughes SM, Cheng HH, Arroyo JD, Meredith EK, Gallichotte EN. Quantitative and stoichiometric analysis of the microRNA content of exosomes. Proc Natl Acad Sci U S A. 2014;111:14888–14893. doi: 10.1073/pnas.1408301111. [DOI] [PMC free article] [PubMed] [Google Scholar]
- Coutinho LL, Matukumalli LK, Sonstegard TS, Van Tassell CP, Gasbarre LC, Capuco AV, Smith TP. Discovery and profiling of bovine microRNAs from immune-related and embryonic tissues. Physiol Genomics. 2007;29:35–43. doi: 10.1152/physiolgenomics.00081.2006. [DOI] [PubMed] [Google Scholar]
- Delorme-Axford E, Donker RB, Mouillet J-F, Chu T, Bayer A, Ouyang Y, Wang T, Stolz DB, Sarkar SN, Morelli AE. Human placental trophoblasts confer viral resistance to recipient cells. Proc Natl Acad Sci U S A. 2013;110:12048–12053. doi: 10.1073/pnas.1304718110. [DOI] [PMC free article] [PubMed] [Google Scholar]
- Diskin MG, Morris DG. Embryonic and early foetal losses in cattle and other ruminants. Reprod Domest Anim. 2008;43(Suppl 2):260–267. doi: 10.1111/j.1439-0531.2008.01171.x. [DOI] [PubMed] [Google Scholar]
- Diskin MG, Murphy JJ, Sreenan JM. Embryo survival in dairy cows managed under pastoral conditions. Anim Reprod Sci. 2006;96:297–311. doi: 10.1016/j.anireprosci.2006.08.008. [DOI] [PubMed] [Google Scholar]
- Dunne L, Diskin M, Sreenan J. Embryo and foetal loss in beef heifers between day 14 of gestation and full term. Anim Reprod Sci. 2000;58:39–44. doi: 10.1016/s0378-4320(99)00088-3. [DOI] [PubMed] [Google Scholar]
- Etheridge A, Lee I, Hood L, Galas D, Wang K. Extracellular microRNA: a new source of biomarkers. Mutation Research/Fundamental and Molecular Mechanisms of Mutagenesis. 2011;717:85–90. doi: 10.1016/j.mrfmmm.2011.03.004. [DOI] [PMC free article] [PubMed] [Google Scholar]
- Fricke P. Scanning the future—Ultrasonography as a reproductive management tool for dairy cattle. J Dairy Sci. 2002;85:1918–1926. doi: 10.3168/jds.S0022-0302(02)74268-9. [DOI] [PubMed] [Google Scholar]
- Gallo A, Tandon M, Alevizos I, Illei GG. The Majority of MicroRNAs Detectable in Serum and Saliva Is Concentrated in Exosomes. PLoS ONE. 2012;7 doi: 10.1371/journal.pone.0030679. [DOI] [PMC free article] [PubMed] [Google Scholar]
- Gifford C, Racicot K, Clark D, Austin K, Hansen T, Lucy M, Davies C, Ott T. Regulation of interferon-stimulated genes in peripheral blood leukocytes in pregnant and bred, nonpregnant dairy cows. J Dairy Sci. 2007;90:274–280. doi: 10.3168/jds.S0022-0302(07)72628-0. [DOI] [PubMed] [Google Scholar]
- Gilad S, Meiri E, Yogev Y, Benjamin S, Lebanony D, Yerushalmi N, Benjamin H, Kushnir M, Cholakh H, Melamed N. Serum microRNAs are promising novel biomarkers. PLoS One. 2008;3:e3148. doi: 10.1371/journal.pone.0003148. [DOI] [PMC free article] [PubMed] [Google Scholar]
- Godkin J, Bazer F, Thatcher W, Roberts R. Proteins released by cultured day 15–16 conceptuses prolong luteal maintenance when introduced into the uterine lumen of cyclic ewes. J Reprod Fertil. 1984;71:57–64. doi: 10.1530/jrf.0.0710057. [DOI] [PubMed] [Google Scholar]
- Gould SJ, Raposo G. As we wait: coping with an imperfect nomenclature for extracellular vesicles. J Extracellular Vesicles. 2013;2 doi: 10.3402/jev.v2i0.20389. [DOI] [PMC free article] [PubMed] [Google Scholar]
- Green J, Okamura C, Poock S, Lucy M. Measurement of interferon-tau (IFN-τ) stimulated gene expression in blood leukocytes for pregnancy diagnosis within 18–20d after insemination in dairy cattle. Anim Reprod Sci. 2010;121:24–33. doi: 10.1016/j.anireprosci.2010.05.010. [DOI] [PubMed] [Google Scholar]
- He Z, Kokkinaki M, Pant D, Gallicano GI, Dym M. Small RNA molecules in the regulation of spermatogenesis. Reproduction. 2009;137:901–911. doi: 10.1530/REP-08-0494. [DOI] [PubMed] [Google Scholar]
- Hung ME, Leonard JN. Stabilization of exosome-targeting peptides via engineered glycosylation. J Biol Chem. 2015;290:8166–8172. doi: 10.1074/jbc.M114.621383. [DOI] [PMC free article] [PubMed] [Google Scholar]
- Iguchi H, Kosaka N, Ochiya T. Secretory microRNAs as a versatile communication tool. Commun Integr Biol. 2010;3:478–481. doi: 10.4161/cib.3.5.12693. [DOI] [PMC free article] [PubMed] [Google Scholar]
- Ioannidis J, Donadeu FX. Circulating miRNA signatures of early pregnancy in cattle. BMC Genomics. 2016;17:1. doi: 10.1186/s12864-016-2529-1. [DOI] [PMC free article] [PubMed] [Google Scholar]
- Jiang P, Wu H, Wang W, Ma W, Sun X, Lu Z. MiPred: classification of real and pseudo microRNA precursors using random forest prediction model with combined features. Nucleic Acids Res. 2007;35:W339–344. doi: 10.1093/nar/gkm368. [DOI] [PMC free article] [PubMed] [Google Scholar]
- Khraiwesh B, Arif MA, Seumel GI, Ossowski S, Weigel D, Reski R, Frank W. Transcriptional control of gene expression by microRNAs. Cell. 2010;140:111–122. doi: 10.1016/j.cell.2009.12.023. [DOI] [PubMed] [Google Scholar]
- Kim DH, Sætrom P, Snøve O, Rossi JJ. MicroRNA-directed transcriptional gene silencing in mammalian cells. Proc Natl Acad Sci U S A. 2008;105:16230–16235. doi: 10.1073/pnas.0808830105. [DOI] [PMC free article] [PubMed] [Google Scholar]
- Kirby CJ, Wilson SJ, Lucy MC. Response of dairy cows treated with bovine somatotropin to a luteolytic dose of prostaglandin F 2α. J Dairy Sci. 1997;80:286–294. doi: 10.3168/jds.S0022-0302(97)75936-8. [DOI] [PubMed] [Google Scholar]
- Klohonatz KM, Cameron AD, Hergenreder JR, da Silveira JC, Belk AD, Veeramachaneni DN, Bouma GJ, Bruemmer JE. Circulating miRNAs as Potential Alternative Cell Signaling Associated with Maternal Recognition of Pregnancy in the Mare. Biol Reprod. 2016;95:124. doi: 10.1095/biolreprod.116.142935. [DOI] [PubMed] [Google Scholar]
- Kotlabova K, Doucha J, Hromadnikova I. Placental-specific microRNA in maternal circulation–identification of appropriate pregnancy-associated microRNAs with diagnostic potential. J Reprod Immunol. 2011;89:185–191. doi: 10.1016/j.jri.2011.02.006. [DOI] [PubMed] [Google Scholar]
- Krawetz SA, Kruger A, Lalancette C, Tagett R, Anton E, Draghici S, Diamond MP. A survey of small RNAs in human sperm. Hum Reprod. 2011 doi: 10.1093/humrep/der329. der329. [DOI] [PMC free article] [PubMed] [Google Scholar]
- Langmead B, Salzberg SL. Fast gapped-read alignment with Bowtie 2. Nat Methods. 2012;9:357–359. doi: 10.1038/nmeth.1923. [DOI] [PMC free article] [PubMed] [Google Scholar]
- Luo S-S, Ishibashi O, Ishikawa G, Ishikawa T, Katayama A, Mishima T, Takizawa T, Shigihara T, Goto T, Izumi A. Human villous trophoblasts express and secrete placenta-specific microRNAs into maternal circulation via exosomes. Biol Reprod. 2009;81:717–729. doi: 10.1095/biolreprod.108.075481. [DOI] [PubMed] [Google Scholar]
- Marques-Rocha JL, Milagro FI, Mansego ML, Zulet MA, Bressan J, Martinez JA. Expression of inflammation-related miRNAs in white blood cells from subjects with metabolic syndrome after 8 wk of following a Mediterranean diet-based weight loss program. Nutrition. 2016;32(1):48–55. doi: 10.1016/j.nut.2015.06.008. [DOI] [PubMed] [Google Scholar]
- Massirer KB, Pasquinelli AE. The evolving role of microRNAs in animal gene expression. Bioessays. 2006;28:449–452. doi: 10.1002/bies.20406. [DOI] [PubMed] [Google Scholar]
- Mathivanan S, Lim JW, Tauro BJ, Ji H, Moritz RL, Simpson RJ. Proteomics analysis of A33 immunoaffinity-purified exosomes released from the human colon tumor cell line LIM1215 reveals a tissue-specific protein signature. Mol Cell Proteomics. 2010;9:197–208. doi: 10.1074/mcp.M900152-MCP200. [DOI] [PMC free article] [PubMed] [Google Scholar]
- Maurer R, Chenault J. Fertilization failure and embryonic mortality in parous and nonparous beef cattle. J Anim Sci. 1983;56:1186–1189. doi: 10.2527/jas1983.5651186x. [DOI] [PubMed] [Google Scholar]
- Miura K, Miura S, Yamasaki K, Higashijima A, Kinoshita A, Yoshiura K-i, Masuzaki H. Identification of pregnancy-associated microRNAs in maternal plasma. Clin Chem. 2010;56:1767–1771. doi: 10.1373/clinchem.2010.147660. [DOI] [PubMed] [Google Scholar]
- Morello M, Minciacchi V, de Candia P, Yang J, Posadas E, Kim H, Griffiths D, Bhowmick N, Chung L, Gandellini P. Large oncosomes mediate intercellular transfer of functional microRNA. Cell cycle. 2013;12:3526–3536. doi: 10.4161/cc.26539. [DOI] [PMC free article] [PubMed] [Google Scholar]
- Navakanitworakul R, Hung W-T, Gunewardena S, Davis JS, Chotigeat W, Christenson LK. Characterization and Small RNA Content of Extracellular Vesicles in Follicular Fluid of Developing Bovine Antral Follicles. Sci Rep. 2016;6 doi: 10.1038/srep25486. [DOI] [PMC free article] [PubMed] [Google Scholar]
- Perry GA, Smith MF, Lucy MC, Green JA, Parks TE, MacNeil MD, Roberts AJ, Geary TW. Relationship between follicle size at insemination and pregnancy success. Proc Natl Acad Sci U S A. 2005;102:5268–5273. doi: 10.1073/pnas.0501700102. [DOI] [PMC free article] [PubMed] [Google Scholar]
- Pillai RS. MicroRNA function: multiple mechanisms for a tiny RNA? RNA. 2005;11:1753–1761. doi: 10.1261/rna.2248605. [DOI] [PMC free article] [PubMed] [Google Scholar]
- Pohler K, Geary T, Johnson C, Atkins J, Jinks E, Busch D, Green J, MacNeil M, Smith M. Circulating bovine pregnancy associated glycoproteins are associated with late embryonic/fetal survival but not ovulatory follicle size in suckled beef cows. J Anim Sci. 2013;91:4158–4167. doi: 10.2527/jas.2013-6348. [DOI] [PubMed] [Google Scholar]
- Pohler K, Pereira M, Lopes F, Lawrence J, Keisler D, Smith M, Vasconcelos J, Green J. Circulating concentrations of bovine pregnancy-associated glycoproteins and late embryonic mortality in lactating dairy herds. J Dairy Sci. 2016;99:1584–1594. doi: 10.3168/jds.2015-10192. [DOI] [PubMed] [Google Scholar]
- Pohler KG, Green JA, Geary TW, Peres RF, Pereira MH, Vasconcelos JL, Smith MF. Predicting Embryo Presence and Viability. Adv Anat Embryol Cell Biol. 2015;216:253–270. doi: 10.1007/978-3-319-15856-3_13. [DOI] [PubMed] [Google Scholar]
- Pugholm LH, Baek R, Sondergaard EK, Revenfeld AL, Jorgensen MM, Varming K. Phenotyping of Leukocytes and Leukocyte-Derived Extracellular Vesicles. J Immunol Res. 2016;2016:6391264. doi: 10.1155/2016/6391264. [DOI] [PMC free article] [PubMed] [Google Scholar]
- Raposo G, Stoorvogel W. Extracellular vesicles: exosomes, microvesicles, and friends. J Cell Biol. 2013;200:373–383. doi: 10.1083/jcb.201211138. [DOI] [PMC free article] [PubMed] [Google Scholar]
- Reid G, Kirschner MB, van Zandwijk N. Circulating microRNAs: Association with disease and potential use as biomarkers. Crit Rev Oncol Hematol. 2011;80:193–208. doi: 10.1016/j.critrevonc.2010.11.004. [DOI] [PubMed] [Google Scholar]
- Roberts R, Imakawa K, Niwano Y, Kazemi M, Malathy P-V, Hansen T, Glass A, Kronenberg L. Interferon production by the preimplantation sheep embryo. J Interferon Res. 1989;9:175–187. doi: 10.1089/jir.1989.9.175. [DOI] [PubMed] [Google Scholar]
- Robinson MD, McCarthy DJ, Smyth GK. edgeR: a Bioconductor package for differential expression analysis of digital gene expression data. Bioinformatics. 2010;26:139–140. doi: 10.1093/bioinformatics/btp616. [DOI] [PMC free article] [PubMed] [Google Scholar]
- Robinson RS, Hammond AJ, Wathes DC, Hunter MG, Mann GE. Corpus luteum-endometrium-embryo interactions in the dairy cow: Underlying mechanisms and clinical relevance. Reprod Domest Anim. 2008;43:104–112. doi: 10.1111/j.1439-0531.2008.01149.x. [DOI] [PubMed] [Google Scholar]
- Skog J, Würdinger T, van Rijn S, Meijer DH, Gainche L, Curry WT, Carter BS, Krichevsky AM, Breakefield XO. Glioblastoma microvesicles transport RNA and proteins that promote tumour growth and provide diagnostic biomarkers. Nat Cell Biol. 2008;10:1470–1476. doi: 10.1038/ncb1800. [DOI] [PMC free article] [PubMed] [Google Scholar]
- Spencer TE, Sandra O, Wolf E. Genes involved in conceptus-endometrial interactions in ruminants: insights from reductionism and thoughts on holistic approaches. Reproduction. 2008;135:165–179. doi: 10.1530/REP-07-0327. [DOI] [PubMed] [Google Scholar]
- Stevenson J, Dalton J, Ott T, Racicot K, Chebel R. Correlation between reproductive status and steady-state messenger ribonucleic acid levels of the resistance gene, MX2, in peripheral blood leukocytes of dairy heifers. J Anim Sci. 2007;85:2163–2172. doi: 10.2527/jas.2007-0014. [DOI] [PubMed] [Google Scholar]
- Théry C, Amigorena S, Raposo G, Clayton A. Isolation and characterization of exosomes from cell culture supernatants and biological fluids. Curr Protoc Cell Biol. 2006;322:22, 21–23, 29. doi: 10.1002/0471143030.cb0322s30. [DOI] [PubMed] [Google Scholar]
- Thind A, Wilson C. Exosomal miRNAs as cancer biomarkers and therapeutic targets. J Extracellular Vesicles. 2016;5 doi: 10.3402/jev.v5.31292. [DOI] [PMC free article] [PubMed] [Google Scholar]
- Valadi H, Ekstrom K, Bossios A, Sjostrand M, Lee JJ, Lotvall JO. Exosome-mediated transfer of mRNAs and microRNAs is a novel mechanism of genetic exchange between cells. Nat Cell Biol. 2007;9:654–U672. doi: 10.1038/ncb1596. [DOI] [PubMed] [Google Scholar]
- Valeri N, Vannini I, Fanini F, Calore F, Adair B, Fabbri M. Epigenetics, miRNAs, and human cancer: a new chapter in human gene regulation. Mamm Genome. 2009;20:573–580. doi: 10.1007/s00335-009-9206-5. [DOI] [PubMed] [Google Scholar]
- Wang K, Zhang S, Weber J, Baxter D, Galas DJ. Export of microRNAs and microRNA-protective protein by mammalian cells. Nucleic Acids Res. 2010 doi: 10.1093/nar/gkq601. gkq601. [DOI] [PMC free article] [PubMed] [Google Scholar]
- Wiltbank MC, Baez GM, Garcia-Guerra A, Toledo MZ, Monteiro PL, Melo LF, Ochoa JC, Santos JE, Sartori R. Pivotal periods for pregnancy loss during the first trimester of gestation in lactating dairy cows. Theriogenology. 2016;86:239–253. doi: 10.1016/j.theriogenology.2016.04.037. [DOI] [PubMed] [Google Scholar]