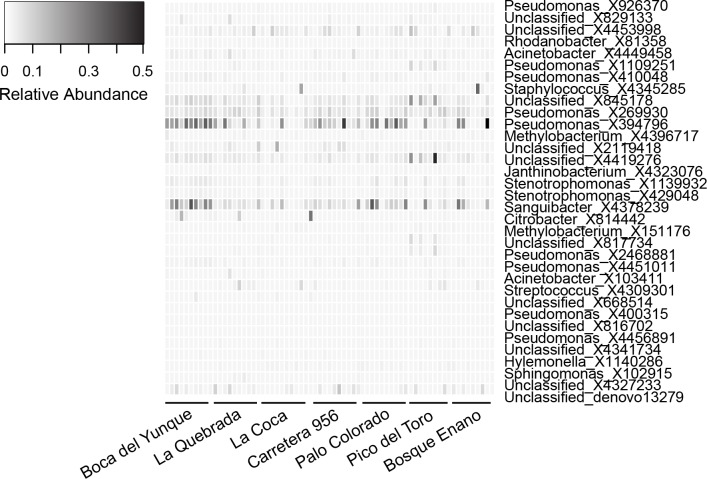
Figure 3. Relative abundance of OTUs (N = 34) representing the core microbiota for Eleutherodactylus coqui.
To be considered part of the core, OTUs had to be present on ≥95% of individuals. OTU relative abundances ranged from 0 to 0.496. Lighter shades indicate lower relative abundances (white relative abundance = 0) and darker shades indicate higher relative abundances (darkest relative abundance = 0.496). Individuals from each site that we sampled are grouped from left to right. See Table 6 for additional details regarding each OTU.

