

SUMMARY
While maintaining the integrity of the genome and sustaining bioenergetics are both fundamental functions of the cell, potential crosstalk between metabolic and DNA repair pathways is poorly understood. Since histone acetylation plays important roles in DNA repair and is sensitive to the availability of acetyl-CoA, we investigated a role for metabolic regulation of histone acetylation during the DNA damage response. In this study, we report that nuclear ATP-citrate lyase (ACLY) is phosphorylated at S455 downstream of ATM and AKT following DNA damage. ACLY facilitates histone acetylation at double strand break (DSB) sites, impairing 53BP1 localization and enabling BRCA1 recruitment and DNA repair by homologous recombination. ACLY phosphorylation and nuclear localization are necessary for its role in promoting BRCA1 recruitment. Upon PARP inhibition, ACLY silencing promotes genomic instability and cell death. Thus, the spatial and temporal control of acetyl-CoA production by ACLY participates in the mechanism of DNA repair pathway choice.
eTOC BLURB
Sivanand et al. demonstrate that ACLY is phosphorylated at S455 within the nucleus following DNA damage in a cell cycle-dependent manner. ACLY promotes histone acetylation near double strand breaks and facilitates BRCA1 recruitment and homologous recombination. ACLY phosphorylation and nuclear localization are required for its role in regulating BRCA1 recruitment.
INTRODUCTION
Metabolic reprogramming and genomic instability are considered hallmark features of cancer cells (Hanahan and Weinberg, 2011). Nutrient uptake and utilization are altered in cancer cells in response to oncogenic signaling to promote macromolecular biosynthesis, survival, growth, and proliferation (DeBerardinis and Chandel, 2016; Pavlova and Thompson, 2016). DNA damage also stimulates extensive signaling responses, which direct repair of lesions or, if damage is too extensive, induce cell death (Ciccia and Elledge, 2010; Jackson and Bartek, 2009; Lazzerini-Denchi and Sfeir, 2016). Although the impact of DNA damage signaling on cell metabolism has been less extensively studied than that of growth factor- or oncogene-induced signaling, it is nevertheless clear that metabolism plays key roles in facilitating DNA repair. Specifically, the kinase ataxia telangiectasia mutated (ATM) promotes pentose phosphate pathway (PPP) flux in response to DNA damage, stimulating biosynthesis of nucleotides needed for repair (Cosentino et al., 2011). Conversely, phosphoinositide 3-kinase (PI3K) inhibition suppresses the non-oxidative arm of the PPP, resulting in low nucleotide levels and accumulation of DNA damage (Juvekar et al., 2016). Chemotherapy treatment also activates the de novo pyrimidine synthesis pathway, and inhibiting pyrimidine synthesis improves chemotherapeutic efficacy in triple negative breast cancer xenograft tumors (Brown et al., 2017). In addition to effects on nucleotide synthesis, DNA damage signaling also suppresses glutamine metabolism, triggering cell cycle arrest to enable repair (Jeong et al., 2013).
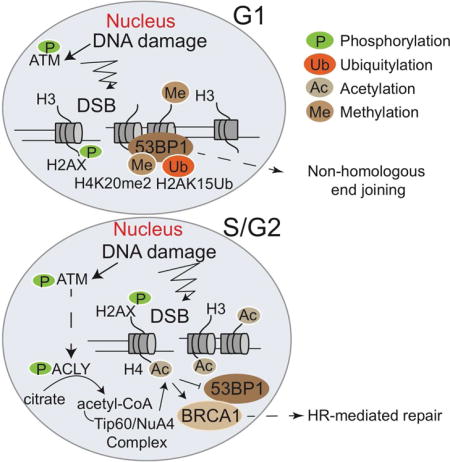
Accurate repair of DNA damage is critical for maintaining genomic integrity. If repaired incorrectly, double strand breaks (DSBs) can either be cytotoxic or pro-tumorigenic by promoting genomic instability due to loss of genetic material or chromosomal rearrangements. DSBs are repaired through two main pathways, homologous recombination (HR), which is preferentially used during S and G2 phases of the cell cycle when a sister chromatid is available as a template, and non-homologous end joining (NHEJ), which directly ligates the broken DNA ends and can be employed throughout the cell cycle. Breast cancer early onset 1 (BRCA1) and p53 binding protein 1 (53BP1) are key upstream factors that determine DNA repair pathway choice, and these factors mutually inhibit one another’s binding at nucleosomes flanking DSB sites (Aly and Ganesan, 2011; Panier and Boulton, 2014; Zimmermann and de Lange, 2014). 53BP1 is a nucleosome binding protein that promotes NHEJ by inhibiting DNA end-resection. HR is initiated following extensive 5’ to 3’ end-resection at damage sites by the Mre11-Rad50-Nbs1 (MRN) complex and CtIP, which promotes Rad51 dependent strand invasion and homology-search. Regulation of end resection and delivery of Rad51 is critically regulated by cell cycle dependent phosphorylation and ubiquitylation, as well as by competition for binding to damaged chromatin between BRCA1 and 53BP1 (Bunting et al., 2010; Escribano-Diaz et al., 2013; Huertas et al., 2008; Huertas and Jackson, 2009; Hustedt and Durocher, 2016; Ira et al., 2004; Orthwein et al., 2015).
Chromatin modifications (acetylation, methylation, phosphorylation, and ubiquitination) are integral factors in mediating efficient and effective DNA repair. Histone acetylation is involved in allowing repair machinery access to DSB sites and in the recruitment of specific repair proteins (Gong and Miller, 2013). DNA damage stimulates dynamic regulation of acetylation of multiple histone lysines, including histone H3 lysine 9 (H3K9) and lysine 56 (H3K56) (Tjeertes et al., 2009), H4 lysine 16 (H4K16) (Hsiao and Mizzen, 2013; Tang et al., 2013), and H2A(X) lysine 15 (H2AK15) (Jacquet et al., 2016). 53BP1 is recruited to DSB sites by binding to two chromatin modifications, H4K20me2 and H2AK15Ub; TIP60-dependent histone acetylation limits persistent 53BP1 DSB localization, enabling recruitment of BRCA1 (Clarke et al., 2017; Fradet-Turcotte et al., 2013; Hsiao and Mizzen, 2013; Jacquet et al., 2016; Tang et al., 2013). Thus, dynamic histone acetylation impacts recruitment of DNA repair proteins and the choice between HR and NHEJ in response to DSBs.
Numerous studies have demonstrated that histone acetylation is sensitive to the availability of the acetyl-group donor, acetyl-CoA (Cai and Tu, 2011; Etchegaray and Mostoslavsky, 2016; Kinnaird et al., 2016; Pietrocola et al., 2015). ATP-citrate lyase (ACLY), a nuclear-cytosolic enzyme that generates acetyl-CoA from citrate, plays an important role in determining overall levels of histone acetylation in mammalian cells (Wellen et al., 2009; Zhao et al., 2016). AKT-mediated phosphorylation of ACLY promotes histone acetylation in both cancer and immune cells in response to oncogenic and cytokine-induced signaling (Covarrubias et al., 2016; Lee et al., 2014; Osinalde et al., 2016). AKT is also activated in response to DNA damage (Bozulic et al., 2008; Fraser et al., 2011; Viniegra et al., 2005), although a role for ACLY downstream of AKT in the DNA damage response has not been previously reported.
In this study, we present evidence that ACLY participates in histone acetylation dynamics in response to DNA damage and promotes DSB repair by HR. Nuclear ACLY is phosphorylated at serine 455 (S455) upon exposure to ionizing radiation, downstream of ATM and AKT. ACLY deficiency results in impaired BRCA1 recruitment to sites of DSBs and suppression of HR. ACLY’s role in promoting BRCA1 recruitment requires ACLY nuclear localization, its catalytic activity, and its S455 phosphorylation. ACLY levels in the nucleus are highest during S and G2 phases of the cell cycle, enabling ACLY to be phosphorylated when repair by HR is preferred. When treated with a PARP inhibitor, ACLY-deficient cells demonstrate increased genomic instability and decreased viability. This study identifies ACLY as a molecular player in the DNA damage response and suggests that DNA damage signaling orchestrates the spatial and temporal production of acetyl-CoA by ACLY within the nucleus to promote HR and genomic integrity.
RESULTS
ACLY facilitates DNA-damage induced histone acetylation dynamics
We postulated that ACLY might participate in maintaining acetyl-CoA pools to enable proper histone acetylation dynamics during the DNA damage response. Global levels of histone H3 lysine 56 acetylation (H3K56ac) and lysine 9 acetylation (H3K9ac) are dynamic following exposure of cells to DNA-damaging agents (Tjeertes et al., 2009; Vempati et al., 2010). Therefore, to gain initial insight into whether ACLY impacts dynamic histone acetylation following DNA-damage, HeLa cells were exposed to a high dose of ionizing radiation (IR). Time-dependent regulation of both modifications was observed, with increased levels detected several hours after IR exposure, coinciding with resolution of γH2AX (Figure 1A, Figure S1A). This is consistent with a role in chromatin reestablishment after repair (Das et al., 2009). RNAi-mediated silencing of ACLY suppressed dynamic global acetylation after IR exposure, although γH2AX was still resolved (Figure 1A). Of note, ACLY levels within the nucleus also rose at the 6-hour time point, coinciding with the increase in histone acetylation (Figure 1B). ACLY silencing did not alter induction of ATM (S1981) phosphorylation by IR or perturb cell-cycle progression in this context, as assessed by nuclear levels of cyclin A (Figure 1B). These data provided initial insight that ACLY may impact the regulation of damage-induced histone acetylation, prompting us to further investigate whether ACLY has specific functions in DSB repair.
Figure 1. ACLY participates in recruitment of BRCA1 to sites of DNA double strand breaks (DSBs).

(A) After transfection with indicated siRNA SMARTpools, cells were treated +/− 10 Gy IR and harvested at 1 h or 6 h post-IR, along with unirradiated controls. Acid-extracted histones and corresponding cytoplasmic fractions were analyzed by Western blot. Quantification of three independent replicates is depicted and significance determined using paired t-test following normalization to siControl UT 1h, mean +/− SEM *, p<0.05. (B) Cells were treated as in (A); cytoplasmic and nuclear fractions were prepared and analyzed by Western blot. (C) Control and ACLY-silenced cells were treated with 2 Gy IR, and 4 h later immunofluorescence imaging was performed for BRCA1, 53BP1, or γH2AX, scale bar- 200 M. Representative experiment from n=2 per cell line and condition with quantification of 10 fields/experiment, mean +/− SEM, *, p<0.05, **, p<0.01. (D) Control and ACLY-silenced cells were treated with 2 Gy IR imaged for cyclin A and BRCA1 after 4 h, scale bar-200 M. Representative experiment from n=2. Quantification of BRCA1 foci in cyclin A+ cells in 10 fields, mean +/−SEM, *, p<0.05. See also Figure S1.
ACLY promotes BRCA1 recruitment to DSB sites
To investigate this, we tested whether ACLY silencing altered the recruitment of DNA repair proteins BRCA1 and 53BP1 to DSB sites in response to IR. ACLY silencing by siRNA in HeLa and A549 cells decreased BRCA1 foci and concomitantly increased 53BP1 foci (Figure 1C). Similar results were also obtained using two different shRNA targeting ACLY (Figure S1B). The intensity and number of γH2AX foci were comparable or slightly higher upon ACLY silencing (Figure S1C). In many cell types, ACLY silencing can significantly impair proliferation and stall cell-cycle progression (Hatzivassiliou et al., 2005). Given that HR and NHEJ are regulated in a cell-cycle dependent manner (Hustedt and Durocher, 2016), we used a level and timing of ACLY silencing in these experiments that neither caused G1 arrest nor significantly impaired proliferation (Figure S1D). Furthermore, co-staining with cyclin A confirmed that BRCA1 recruitment was impaired in S/G2 phase cells upon ACLY silencing (Figure 1D). CRISPR/Cas9-mediated ACLY deletion in LN229 glioblastoma cells similarly impaired IR-induced BRCA1 foci formation (Figure S1E).
To introduce and visualize DSBs at a single specific genomic locus, we employed a U2OS DSB reporter cell line engineered to express a mCherry-LacI-Fok1 nuclease fusion protein (Shanbhag et al., 2010; Tang et al., 2013) (Figure 2A). Similar to that observed with ionizing radiation, ACLY silencing impaired BRCA1 recruitment and increased 53BP1 levels at DSB sites (Figure 2A). The effect of ACLY silencing mirrored that of TIP60 silencing, albeit not to the same extent (Figure 2A). Total BRCA1 protein levels were unaltered by ACLY silencing (Figure S2A).
Figure 2. ACLY promotes histone acetylation at sites of DSBs.
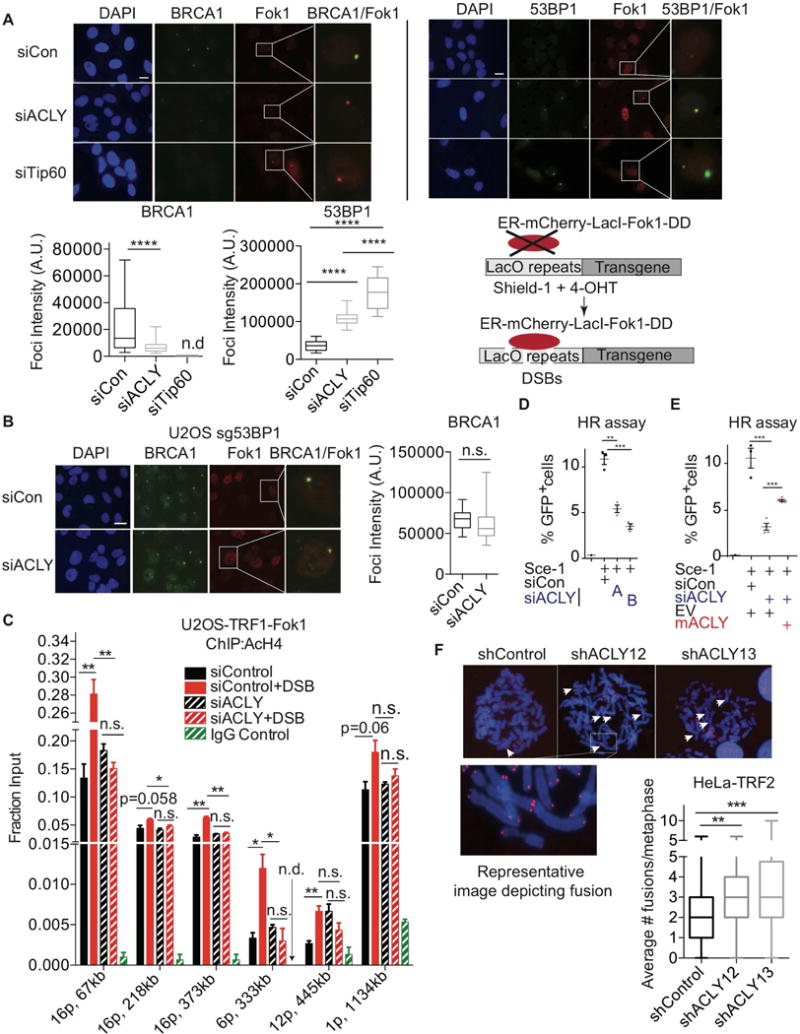
(A) U2OS reporter cell line transfected with indicated siRNA SMARTpools was treated with Shield-1 and 4-OHT for 5 h to induce DSBs by mCherry-Lac1-Fok1. Colocalization of BRCA1 or 53BP1 with Fok1 was imaged by IF, scale, 200 M. Representative experiment from n=3 each for 53BP1 and BRCA1. Quantitation of 15–20 fields from each sample is depicted, ****, p<0.0001, n.d.- not detected (lower left panel); A.U.- Arbitrary units. Re-drawn schematic of the reporter assay, previously published (Tang et al., 2013) is depicted (lower right panel) (B) BRCA1 colocalization with Fok1 was examined in 53BP1-deficient U2OS reporter cells. (See also Figure S2B.) n.s.- not significant; A.U.- Arbitrary units. (C) AcH4 ChIP using different primer sets for endogenous loci was performed in a U2OS-TRF1-Fok1 reporter cell line that induces DSBs within telomeres (Tang et al., 2013). DSBs were induced by treatment with 4-OHT for 5 h; mean +/− SEM for 5 h, *, p<0.05, **, p<0.01, n.s.- not significant, n.d.- not detected. See Figure S3 for primer locations. (D) HR assay performed in the DR-GFP U2OS reporter line (Pierce et al., 2001). Cells were transfected with individual siRNAs for 24 hours (siACLY A or siACLY B), followed by transfection of the endonuclease Sce-1 for an additional 48 h. GFP positivity, indicating HR efficiency, was analyzed by flow cytometer, mean +/− SEM, **, p<0.01; ***, p<0.001. (E) To assay HR, cells were transduced with EV or ACLY-expressing lentivirus. Cells were transfected with siRNA SMARTpools, followed by Sce-1 as in (D). Data is representative of 2 independent experiments. Mean +/− SEM is graphed, ***, p<0.001. (F) ACLY was silenced using two independent shRNAs in HeLa cells expressing TRF2ΔB/ΔM. NHEJ was assessed by scoring end-to-end chromosomal fusions. Mean +/− SEM **, p<0.01, ***,p<0.001. See also Figure S2 and Figure S3.
ACLY promotes histone acetylation at sites of DSBs
Histone acetylation can promote BRCA1 recruitment by interfering with 53BP1 localization at DSB sites (Hsiao and Mizzen, 2013; Jacquet et al., 2016; Tang et al., 2013). We therefore asked whether reduced BRCA1 foci formation observed upon ACLY silencing depends on the presence of 53BP1. Using 53BP1-deficient clones of U2OS-DSB reporter cell line (U2OS sg53BP1) (Figure S2B), we found that silencing of ACLY failed to suppress BRCA1 recruitment when 53BP1 was absent (Figure 2B). These data indicate that ACLY promotes BRCA1 recruitment in a manner dependent on 53BP1 exclusion.
We next investigated whether ACLY impacts specific histone modifications known to limit 53BP1 binding. For this, we utilized a reporter cell line in which the Fok1 nuclease is tethered to the telomere binding protein TRF1. Upon induction of DSBs by TRF1-Fok1, γH2AX spreads several hundred kilobases into subtelomeric chromatin (Tang et al., 2013). We confirmed that Fok1 localization corresponded to the induction of γH2AX in cells with and without ACLY knockdown (Figure S2C). BRCA1 foci formation in response to TRF1-Fok1-induced DSBs was also verified to be impaired upon ACLY silencing (Figure S2D). We performed chromatin immunoprecipitation (ChIP)-QPCR experiments to test histone H4 acetylation on chromatin near sites of DSBs with primer sets designed at telomeric ends (Figure S3). Multiple loci on one chromosome (chromosome 16), as well as additional loci on different chromosomes, were tested. While DSBs led to elevated histone acetylation at many of these loci in control cells, this response was markedly impaired upon ACLY silencing (Figure 2C).
To determine whether ACLY silencing functionally favors HR at the expense of NHEJ, we first employed the direct repeat green fluorescent protein (DR-GFP) assay, which reports on HR efficiency (Pierce et al., 2001). Silencing ACLY using individual siRNAs or an siRNA SMARTpool targeting ACLY potently suppressed HR efficiency (Figure 2D, Figure 2E). Expression of WT mACLY, which was not silenced by the siRNA pool, significantly rescued HR (Figure 2E, Figure S2E). To specifically assay NHEJ, we took advantage of the fact that deprotected telomeres engage in 53BP1-dependent NHEJ, resulting in end-to-end chromosomal fusions (Dimitrova et al., 2008; van Steensel et al., 1998). Upon expression of a mutant dominant negative version of the shelterin complex component TRF2 (TRF2ΔB/ΔM) (van Steensel et al., 1998), chromosomal fusions were observed (Figure 2F). Significantly higher numbers of fusions were observed upon ACLY silencing, indicating elevated engagement of NHEJ (Figure 2F). These data indicate that ACLY promotes HR at the expense of NHEJ.
A second major source of acetyl-CoA in the nucleus and cytosol is acyl-CoA synthetase short chain family member 2 (ACSS2), which generates acetyl-CoA from acetate. Acetate can rescue global histone acetylation in the absence of ACLY (Wellen et al., 2009; Zhao et al., 2016), though use of exogenous acetate for histone acetylation is somewhat inefficient (Bulusu et al., 2017; Zhao et al., 2016), suggesting that ACLY- and ACSS2-generated acetyl-CoA might be differentially used in specific contexts. Silencing of ACSS2 had no significant impact on BRCA1 foci formation (Figure S2F). Moreover, supplementation of acetate produced only very modest, if any, rescue of HR in the absence of ACLY, suggesting a dominant and specific role for ACLY in regulating HR (Figure S2G).
Reprogramming of glucose metabolism does not account for ACLY’s role in DNA repair
Both glucose and glutamine can support acetyl-CoA production via ACLY, with glucose being the primary carbon source supplying acetyl-CoA for histone acetylation in proliferating cancer cells and fibroblasts (Evertts et al., 2013; Zhao et al., 2016). We hypothesized that DNA damage signaling might induce reprogramming of metabolism to facilitate ACLY-dependent acetyl-CoA production. However, in 6 hours following IR exposure, neither glucose nor glutamine consumption increased; the rate of glucose consumption from the media was unchanged, while glutamine consumption showed a strong trend towards suppression (Figure 3A), consistent with a prior study (Jeong et al., 2013). Since changes in glucose consumption might occur more acutely, we also tested 3H-2-deoxyglucose uptake at 0.5, 1, and 2 hours post-IR, but observed no difference between mock and IR-treated cells (Figure 3B). IR exposure also did not significantly alter glucose oxidation in the TCA cycle (Figure 3C) or glucose-dependent fatty acid synthesis (Figure 3D, Figure S4A). These data suggest that a global reprogramming glucose metabolism is unlikely to account for ACLY’s role in DNA repair.
Figure 3. DNA damage signaling does not stimulate ACLY-dependent global reprogramming of glucose metabolism.
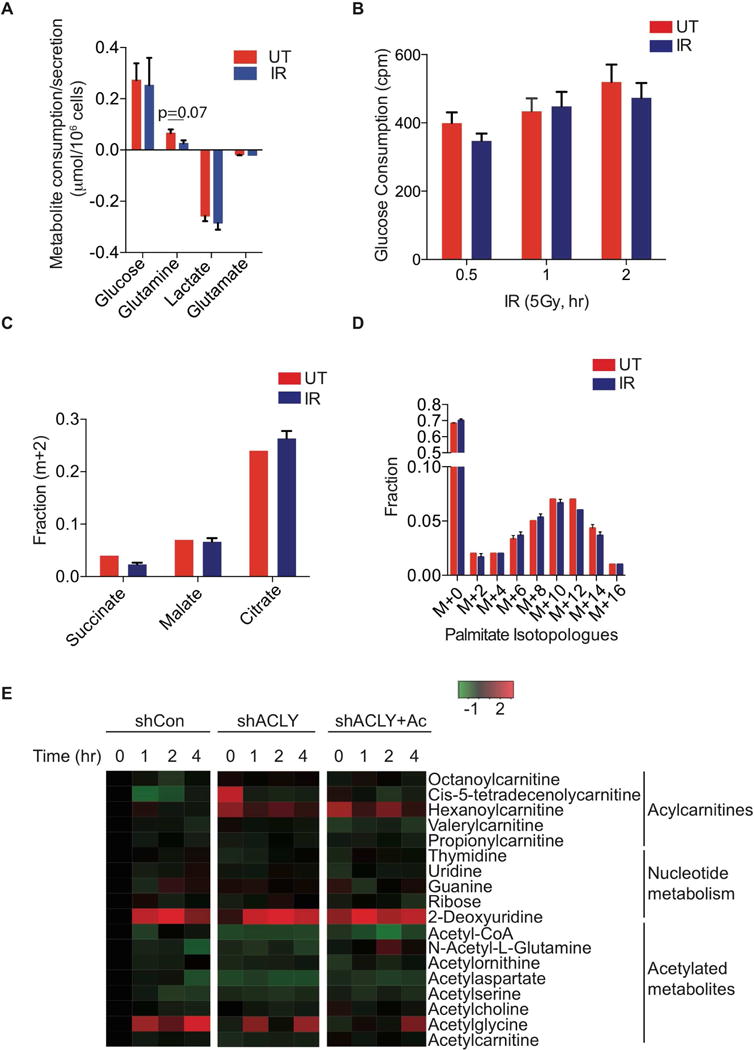
(A) Metabolite consumption/production over 6 hours in U2OS Cells treated +/− 5 Gy IR, mean +/− SEM of triplicates (B) A549 cells were treated with 5 Gy IR and 3H-2-deoxyglucose uptake monitored at indicated time points, mean +/− SEM of triplicates. Cpm- counts per minute. (C) A549 cells were treated with 5Gy IR and media replaced containing [U-13C]-glucose for 6 h. Enrichment of TCA cycle intermediates was examined using GC-MS, mean +/− SEM of triplicates. (D) A549 cells were treated with IR and then media replaced with that containing [U-13C]-glucose for 24 h. Palmitate enrichment was examined by fatty-acid methyl-ester analysis by GC-MS, mean +/− SEM of triplicates. (E) U2OS cells were transduced with indicated shRNAs targeting either control or ACLY, +/− 5 mM acetate, and treated with 5 Gy IR. Metabolites were extracted and analyzed by LC-MS at indicated time points. Each point on the heat map represents the mean of triplicate samples for each condition and time point. Full panel of metabolites and biological replicates are included in Supplementary Table 1. See also Figure S4.
We next conducted a metabolomic profiling experiment to attempt to identify other metabolic pathways regulated by IR exposure in an ACLY-dependent manner (Supplementary Table 1). Differences in metabolite levels were observed upon silencing of ACLY. Acetyl-CoA abundance was suppressed by ACLY knockdown, independent of IR treatment (Figure 3E and Figure S4B). Acetyl-aspartate was also notably reduced in ACLY-silenced cells and rescued by acetate supplementation (Figure 3E and S4C), and acylcarnitine profiles were also altered upon ACLY silencing (Figure 3E and Figure S4D). Levels of these acetylated metabolites and acylcarnitines were not significantly altered by IR exposure, however. IR-induced changes in metabolite levels were also detected; for example, levels of 2-deoxyuridine and acetylglycine/guanidineacetate increased following IR, both in the presence and absence of ACLY (Figure 3E and Figure S4E). Thus, in both targeted and untargeted whole cell analyses, we failed to identify IR-induced metabolic alterations that might explain the HR deficit observed upon ACLY silencing.
Nuclear ACLY is phosphorylated upon DNA damage
Emerging evidence suggests that local production of metabolites can be important in mediating chromatin modifications that are directed to specific loci, for example for transcriptional regulation, although validated methods for measuring nuclear metabolite levels are lacking (Kinnaird et al., 2016; Meier, 2013). ACLY is present within the nucleus (Wellen et al., 2009; Zhao et al., 2016), but no functions of ACLY have yet been specifically demonstrated to depend on its nuclear localization. ACLY-dependent acetyl-CoA production can be regulated by AKT, which phosphorylates ACLY at S455 (Berwick et al., 2002). Biochemical analysis has shown that phosphorylation at S455 increases the enzyme’s Vmax and converts its citrate dependence from sigmoidal with negative cooperativity to hyperbolic (Potapova et al., 2000). AKT is activated not only in response to growth factor signal transduction, but also in response to DNA damage signaling downstream of ATM or DNA-PK (Bozulic et al., 2008; Fraser et al., 2011; Viniegra et al., 2005).
We therefore asked whether ACLY is phosphorylated in response to DNA damage. In whole cell lysates, minimal change in pACLY (S455) was detected upon exposure of cells to ionizing radiation (IR) (Figure S5A). Although ACLY is present in both the nucleus and the cytosol, it is more abundant in the cytosol, potentially obscuring changes in ACLY phosphorylation within the nucleus. Indeed, biochemical fractionation of cells into nuclear and cytoplasmic fractions revealed that ACLY phosphorylation increased specifically in the nucleus following IR exposure (Figures 4A and S5B). Nuclear ACLY (S455) phosphorylation was enhanced within 30 minutes of exposure of cells to IR, paralleling increases in pAKT (S473) and pATM (S1981) (Figures 4A and S5B). Of note, a prior phospho-proteomics dataset also detected pACLY (S455) within nuclei of irradiated cells (Figure S5C) (Bennetzen et al., 2010). To determine whether ACLY phosphorylation occurs in response to DNA damage in vivo, ACLY phosphorylation was examined in irradiated subcutaneous tumors and non-irradiated counterpart tumors grown on the opposite flank. Similar to that observed in vitro in the same cell line (Figure S5B), increased ACLY phosphorylation was detected upon IR exposure of tumors in vivo (Figure 4B).
Figure 4. Nuclear ACLY is phosphorylated following DNA damage in a cell cycle dependent manner.

(A) HeLa cells subjected to 5 Gy IR were fractionated at indicated time points. Nuclear and cytoplasmic levels of indicated proteins determined by Western blot. (B) Subcutaneous B16 tumors were grown on both flanks of female C57Bl/6 mice. One tumor on each mouse was treated with 20 Gy IR, while the other tumor received no treatment. Both tumors were harvested in parallel and immunohistochemistry was performed for pACLY. The number of positive nuclei/field were scored for 20 fields per section, mean +/−SEM, ***, p<0.001; ****, p<0.0001. Representative images and quantification from one mouse per time point (0.5 and 1 h) is depicted. Reproducible data was observed from a total of n=3 mice for 0.5 h time point and a total of n=2 mice for the 1 h time point. (C) HeLa cells were pre-treated with an ATM inhibitor for 15 min, then exposed to IR, fractionated, and analyzed by Western blot. (D) A549 cells were pre-treated with an AKT inhibitor for 1 h, followed by IR treatment, fractionation, and western blotting of lysates. (E) HeLa cells were synchronized to S-phase using a double thymidine block and released into G2 and G1 at 4 and 10 h, respectively. 30 min prior to harvest in each cell cycle phase, cells were irradiated, fractionated, and lysates subjected to western blot analysis. Colored boxes around the time points correspond to the color of the PI profile representing a distinct stage of the cell cycle (right panel). See also Figure S5.
We next sought to determine whether DNA damage signaling is responsible for promoting ACLY S455 phosphorylation. Indeed, inhibition of ATM with KU55933, a selective ATM kinase inhibitor that does not target other PI3 kinases (Hickson et al., 2004), ablated damage-induced ACLY phosphorylation (Figure 4C). However, it is unlikely that ACLY is a direct ATM substrate since it lacks the consensus motif and has not been identified in prior proteomics analysis of ATM/ATR substrates (Matsuoka et al., 2007). AKT is also activated downstream of ATM (Fraser et al., 2011; Viniegra et al., 2005), and IR-induced nuclear AKT phosphorylation was suppressed by ATM inhibition (Figure 4C). Moreover, the AKT1/2/3 inhibitor MK-2206 reduced damage-induced ACLY phosphorylation within nuclei without impacting ATM phosphorylation, indicating that AKT acts downstream of ATM to regulate ACLY (Figure 4D, Figure S5D). Thus, DNA damage promotes rapid activation of a signaling cascade that promotes nuclear ACLY phosphorylation downstream of ATM and AKT.
ATM is important in mediating both HR and NHEJ, and the choice between these pathways is intimately tied to the cell cycle (Hustedt and Durocher, 2016). Notably, DSB-induced histone acetylation has been shown to be specific to S/G2 phases of the cell cycle, consistent with its role in HR (Jacquet et al., 2016). We noted that ACLY levels increase in concert with cyclin A several hours after exposure to a high dose of IR (Figure 1B), prompting us to ask if there is a relationship between nuclear ACLY levels and the cell cycle. To test this, cells were synchronized using a double thymidine block, and nuclear ACLY levels were analyzed over the cell cycle. While cytosolic ACLY levels were constant, nuclear ACLY levels were higher in S/G2 phase and lower in G1 (Figure 4E, S5E, and S5F). These data suggest that ACLY may be available to supply acetyl-CoA at the point in the cell cycle in which HR is preferred. Indeed, in synchronized cells, IR exposure induced ACLY phosphorylation in S and G2 phase cells, but not in G1 phase cells, despite equivalent ATM phosphorylation (Figure 4E).
The role of ACLY in BRCA1 recruitment depends on its phosphorylation and nuclear localization
The data indicate that ACLY is phosphorylated within the nucleus upon DNA damage, that it regulates histone acetylation at DSB sites, and that it favors BRCA1 recruitment over 53BP1 recruitment, enabling repair by HR. To test whether ACLY catalytic activity to produce acetyl-CoA is required to promote BRCA1 recruitment, ACLY-deficient LN229 cells (Figure S1E) were reconstituted with either myc-ACLY-WT or myc-ACLY-H760A. Whereas IR-induced BRCA1 foci formation increased upon expression of ACLY-WT, the catalytically inactive ACLY (H760A) failed to rescue, indicating that ACLY catalytic activity is required for its role in promoting BRCA1 recruitment (Figure 5A). Reciprocally, ACLY-WT but not ACLY-H760A reduced 53BP1 foci (Figure 5B). We next investigated whether phosphorylation of ACLY at S455 is crucial for its role in BRCA1 recruitment. To do this, ACLY-deficient LN229 cells were reconstituted with either myc-ACLY-WT or myc-ACLY in which Ser455 is mutated to Ala (and thus cannot be phosphorylated) or to Asp (mimicking phosphorylation). Expression of ACLY-WT or ACLY-S455D restored IR-induced BRCA1 foci, while ACLY-S455A failed to rescue (Figure 5C). Similar results validating the importance ACLY phosphorylation were also obtained in cells stably expressing myc-tagged mouse ACLY (WT, S455D, or S455A) in which endogenous ACLY was silenced by RNAi (Figure S6A). Each of the ACLY mutants expressed to a similar level and exhibited similar nuclear-cytoplasmic distribution as WT-ACLY (Figures S6B).
Figure 5. Phosphorylation and nuclear localization of ACLY promote BRCA1 recruitment to DSB sites.
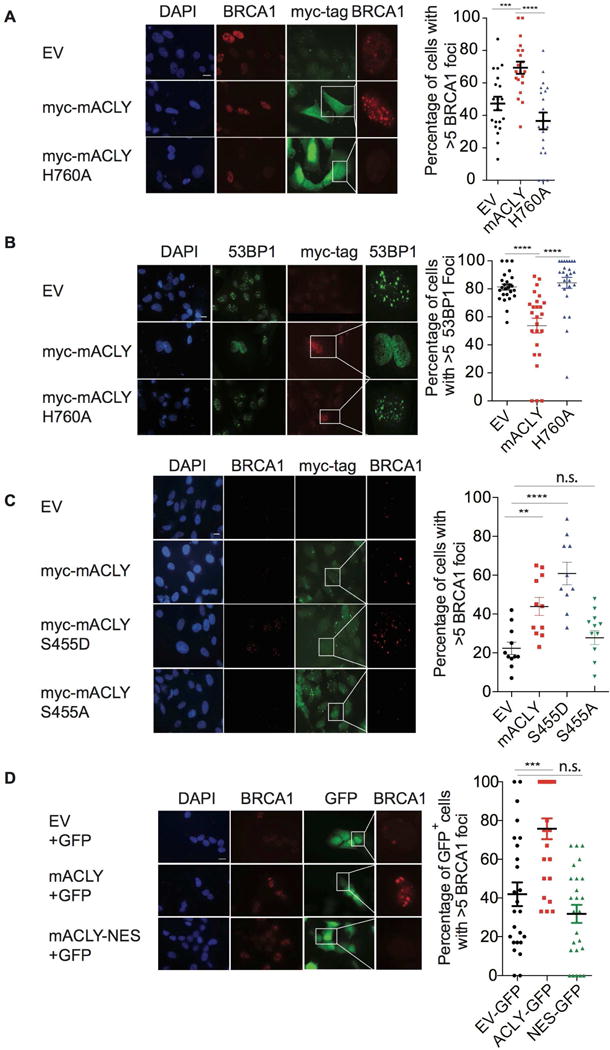
(A) EV or myc-tagged mACLY constructs (WT or H760A) were transfected in LN229 sgACLY (clone 3.8) cells, followed by irradiation with 2 Gy IR. Cells were fixed after 4 h and co-stained for myc-tag (representing ACLY) and BRCA1. Quantification on myc-tag+ cells (or all nuclei for EV controls) was performed from 25 different fields per sample using ImageJ, mean +/−SEM, **, p<0.01, ****, p<0.0001;, n.s.-not significant. Scale bar-200 M. (B) Experiment was conducted as in (A), with analysis of 53BP1 and myc-tag. (C) Experiment was conducted as in (A), using myc-tagged mACLY constructs (WT, S455A, or S455D). (D) ACLY null LN229 cells were co-transfected with empty vector and GFP, WT mACLY and GFP, or with mACLY-NES and GFP for 48 h, and fixed 4 h after 2Gy IR treatment. IF was performed for BRCA1; GFP and BRCA1 was imaged. Quantification was performed with at least 25 fields per sample using ImageJ scoring GFP positive cells, mean +/−SEM. ***, p<0.001, n.s.- not significant. See also Figure S6.
Finally, we tested whether the presence of ACLY in the nucleus promotes BRCA1 recruitment to sites of DSBs. ACLY-deficient LN229 cells were co-transfected with GFP and either empty vector (EV), ACLY-WT, or ACLY tagged with a nuclear export signal (NES) (Figure S5D). When reconstituted into ACLY KO LN229 cells, NES-tagged ACLY, in contrast to WT ACLY, failed to rescue BRCA1 foci levels above that in the empty vector controls (Figure 5D). Together, these data indicate that ACLY-dependent promotion of BRCA1 recruitment requires it to be present in the nucleus, phosphorylated at S455, and catalytically active.
ACLY silencing increases sensitivity to PARP inhibition
When inhibited, PARP becomes trapped at sites of single strand breaks, causing formation of DSBs in replicating cells that necessitate repair by HR. As such, BRCA1 mutation or deficiency in HR sensitizes cells to PARP inhibition (Farmer et al., 2005; O’Connor, 2015). We therefore tested whether ACLY silencing impacts genome stability and PARPi sensitivity. In combination with olaparib treatment, ACLY silencing caused a significant reduction in cell viability at higher doses, consistent with a defect in HR (Figure 6A). Since the impairment of BRCA1 recruitment upon ACLY silencing was 53BP1 dependent (Figure 2B), we investigated whether the observed sensitivity to PARP inhibitors would be diminished in cells lacking 53BP1. Indeed, ACLY silencing had minimal effect on PARPi sensitivity in the absence of 53BP1 (Figure 6B, Figure S7A), consistent with the model that ACLY promotes HR by interfering with 53BP1 localization. HR deficient cells are also sensitive to mitomycin C (Yun et al., 2005), and similarly, enhanced cell death was observed upon ACLY silencing following mitomycin C treatment (Figure S7B). Further supporting a role for ACLY in maintaining genomic stability, enhanced incidence of radial chromosomes occurred when cells were treated with PARPi in conjunction with ACLY silencing, relative to control shRNA (Figure 6C). Together, these data indicate that ACLY plays a key role in enabling DNA repair by HR.
Figure 6. ACLY deficiency enhances PARP inhibitor-induced genomic instability and cytotoxicity.
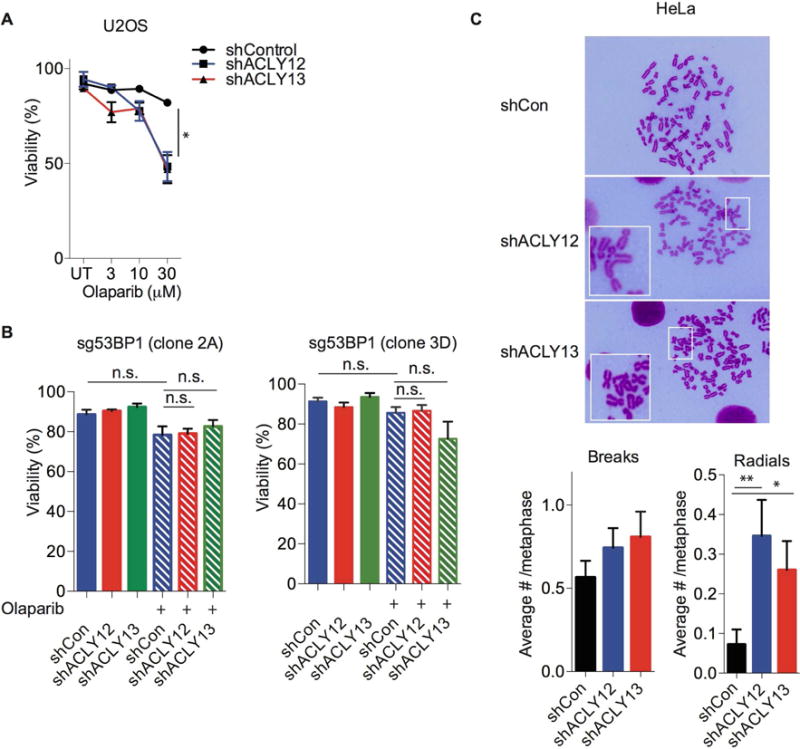
(A) U2OS cells were treated with olaparib at indicated doses for 72 h following ACLY silencing for 24 h. Viability was assessed using trypan-blue exclusion assay, mean +/− SEM, *, p<0.05. (B) Two independent U2OS reporter clones lacking 53BP1 (sg53BP1-clone 2A and clone 3D) were treated without (solid bars) or with (striped bars) olaparib at 30 M final concentration for 72 h following ACLY silencing for 24 h. Viability was assessed using trypan-blue exclusion assay. n.s.- not significant. (C) ACLY was silenced in HeLa cells, and cells were treated with olaparib for 24 h. Samples were collected following colcemid treatment for 1.5 h and metaphases were examined for chromosomal abnormalities. Quantification was performed manually on 70–80 total metaphases from 2 different experiments which were pooled together, mean +/− SEM; *, p<0.05, **, p<0.01. See also Figure S7.
DISCUSSION
In this study, we report that nuclear ACLY is phosphorylated in response to DNA damage in an ATM- and AKT-dependent manner. ACLY silencing impairs induction of histone acetylation at DSB sites, promoting 53BP1 binding and suppressing BRCA1 recruitment and HR. ACLY’s role in promoting BRCA1 recruitment is dependent on ACLY catalytic activity, phosphorylation at S455, and nuclear localization (Figure 7). Nuclear levels of ACLY are highest in S/G2 phases, pointing to a role for ACLY in enabling DSB-induced histone acetylation to promote HR in a cell cycle-dependent manner. ACLY silencing increases chromosomal abnormalities and cell death upon PARP inhibition. In summary, these data provide evidence that DNA damage signaling stimulates production of acetyl-CoA by ACLY within the nucleus and that this participates in cell cycle-appropriate DSB repair pathway choice and maintenance of genome stability.
Figure 7. Acetyl-CoA production by ATP-citrate lyase facilitates homologous recombination during S/G2 phases of the cell cycle.
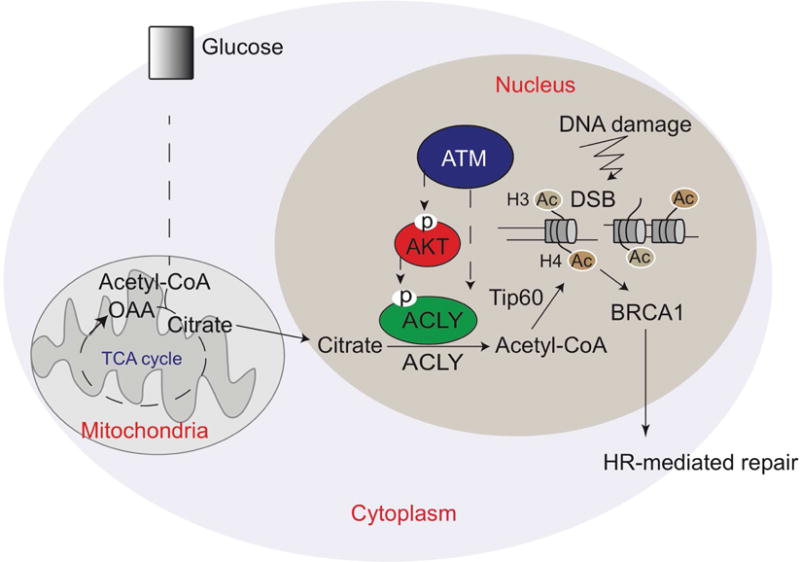
ACLY is phosphorylated at Ser455 within the nucleus in response to DNA damage in a cell cycle-dependent manner. This enables appropriate spatial and temporal control of acetyl-CoA production, enabling histone acetylation at DSB sites, BRCA1 recruitment, and DNA repair by HR.
Acetyl-CoA and other metabolites can diffuse through nuclear pores; thus, despite the established localization of ACLY within both cytosol and nucleus (Wellen et al., 2009), whether it has specific functions that require its nuclear localization has not been clear. This study identifies a specific function that requires ACLY nuclear localization. The DNA damage response must be precisely coordinated, and rapid production of acetyl-CoA within the nucleus may promote its availability to lysine acetyl-transferases (KATs) in this context. Moreover, acetyl-CoA levels are known to fluctuate in response to changes in glucose availability or glycolytic flux (Cluntun et al., 2015; Lee et al., 2014), and ensuring a nuclear pool of acetyl-CoA may buffer the ability to repair DNA damage from being impacted by nutritional deficiencies in the cell’s microenvironment. Notably, a recent study demonstrated that nuclear fumarate production plays a key role in regulating KDM2B histone demethylase activity during DSB repair (Jiang et al., 2015), aligning with the concept that local metabolite production may be broadly important for ensuring substrate availability to chromatin modifying enzymes during the repair of DNA damage.
More work is needed to define the precise mechanisms through which DNA damage signaling activates ACLY. While ACLY has been established as a direct substrate of AKT (Berwick et al., 2002), the mechanisms of AKT activation by DNA damage signaling are less clear. Both ATM and DNA-PK have been reported to promote AKT-Ser473 phosphorylation (Bozulic et al., 2008; Fraser et al., 2011; Viniegra et al., 2005). While AKT1 can interact with ATM, it is reportedly not a direct substrate, but rather is activated downstream of RNF168 (Fraser et al., 2011). Several components of the PI3K-AKT network have been identified as ATM or ATR substrates, and it has been proposed that PI3K-AKT signaling and DNA damage signaling likely intersect at multiple levels (Matsuoka et al., 2007).
In addition, the mechanisms of cell cycle regulation of nuclear ACLY levels will be important to define in future work. Cyclin-dependent kinases (CDKs) are crucial for cell cycle-dependent control of DNA damage repair, via phosphorylating of CtIP and other substrates (Hustedt and Durocher, 2016). Although ACLY is not known to be regulated by CDKs, intriguingly, one study of human cytomegalovirus identified ACLY and TIP60 as proteins that interact with a viral CDK orthologue (Reitsma et al., 2011). ACLY has never been shown to directly interact with TIP60 to our knowledge, and we also tested but failed to identify a definitive interaction between the two proteins (data not shown). However, it may well be that ACLY presence in the nucleus is sufficient to enable production of acetyl-CoA in the vicinity of TIP60, without a requirement for their physical interaction.
Prior studies have shown that PI3K inhibition sensitizes both BRCA1-deficient and BRCA1-proficient cells to PARP inhibition (Ibrahim et al., 2012; Juvekar et al., 2012). In BRCA1-deficient cells, PI3K regulates aldolase association with the actin cytoskeleton, and PI3K inhibition results in impaired pentose phosphate pathway flux and nucleotide synthesis (Hu et al., 2016; Juvekar et al., 2016). Our data suggest that AKT also influences BRCA1 function, at least in part through promoting ACLY phosphorylation within the nucleus and BRCA1 recruitment to DSB sites to enable HR. Thus, in BRCA1 proficient cells, strategies such as AKT or ACLY inhibition could be further explored in conjunction with PARP inhibition. Such a strategy might be less effective if BRCA1 is already mutated. In the case of ACLY inhibition, it is likely that any such strategy would need to uncouple the anti-proliferative effects of potent ACLY inhibition from its effects on HR.
In summary these data identify a role for the metabolic enzyme ACLY within the nucleus in regulating the mechanism of DNA DSB repair. DNA damage repair is tightly regulated both spatially and temporally. Based on the findings of this study, regulation of nuclear metabolic processes appears to be a component of the cellular response to DSBs, in that the KAT substrate acetyl-CoA must be made locally available at the right time and place to facilitate the accurate regulation of histone acetylation during repair. Key questions for the future include delineating the mechanisms through which ACLY is activated in response to DSBs and the mechanisms that regulate ACLY nuclear levels.
EXPERIMENTAL PROCEDURES
STAR METHODS
KEY RESOURCES TABLE
| REAGENT or RESOURCE | SOURCE | IDENTIFIER |
|---|---|---|
| Antibodies | ||
| Mouse monoclonal anti-phospho ATM (S1981) | Millipore | clone 10H11.E12, Cat. No. 05-740 |
| Rabbit monoclonal anti-phospho AKT (S473 and T308) | Cell Signaling | S473-(D9E) XP Cat. No. 4060 T308-(244F9) Cat. No. 4056 |
| Rabbit polyclonal anti-phospho ACLY | Cell Signaling Sigma | Cat. No. 4331 (Western blot) Cat. No. #SAB4504020 (Immunohistochemistry) |
| Rabbit monoclonal anti-ACLY | Cell Signaling | Cell Signaling-(D1X6P)- Cat. No. 13390 |
| Rabbit monoclonal anti-ACLY | Hatzivassiliou et. al., 2005 | PMID: 16226706 |
| Rabbit polyclonal anti-ACLY | ProteinTech | Cat. No. 15421-1-AP |
| Rabbit polyclonal anti-AKT | Cell Signaling | Cat. No. 9272 |
| Mouse monoclonal anti-BRCA1 | Santa Cruz Biotechnology | (D-9) Cat. No. sc-6954 |
| Rabbit polyclonal anti-53BP1 | Novus Biologicals | NB100-904SS |
| Mouse monoclonal anti-γH2AX (S139) Rabbit anti-γH2AX |
Millipore Cell Signaling |
Millipore- clone JBW301- Cat. No. 05-636 Cell Signaling-Cat. No. 2577 |
| Rabbit polyclonal anti-Lamin A/C | Cell Signaling | Cat. No. 2032 |
| Rabbit polyclonal anti-DNMT1 | Active Motif | Cat. No. 33905 |
| Rabbit polyclonal anti-acetyl-histone H4 | Millipore | Cat. No. 06-866 |
| Chemicals, Peptides, and Recombinant Proteins | ||
| AKT 1/2/3 inhibitor MK-2206 | Selleckchem | Cat. No. S1078 |
| ATM inhibitor KU55933 | Tocris Biosciences | Cat. No. 3544 |
| The Deoxy-D-Glucose, 2-[1,2-3H (N)] | Perkin Elmer NET | 328A250UC-lot 1914291 |
| D-GLUCOSE (U-13C6, 99%) | Cambridge Isotope laboratories | CLM-1396-PK |
| Formamide | Amresco | Cat. No. 0606 |
| Mitomycin C | Millipore | Cat. No. 475820 |
| Olaparib (AZD2281) | ChemieTek | Cat. No. CT-A2281 |
| Shield-1 | Clontech | Cat. No. 632189 |
| 4-Hydroxytamoxifen | Sigma-Aldrich | Cat. No. T176 |
| Experimental Models: Cell Lines | ||
| HeLa, A549, LN229, HCT116, B16-F10 (B16) | ATCC | |
| LN229 clones expressing ACLY mutants | Lee et. al., 2014 | PMID: 24998913 |
| LN229 cells with CRISPR-mediated ACLY deletion | Zhao, et. al., 2016 | PMID: 27760311 |
| U2OS DSB reporter cell line U2OS-TRF1-Fok1 DSB reporter line |
Tang et. al., 2013 Shanbhag et. al., 2010 |
PMID: 23377543 PMID: 20550933 |
| DR-GFP cells | Pierce et. al., 2001; kindly provided by M. Jasin | PMID: 11751629 |
| U2OS cells with CRISPR-mediated 53BP1 deletion | This study | |
| Experimental Models: Organisms/Strains | ||
| C56BL/6 mice | Jackson Laboratory (Bar Harbor, ME) | Stock # 000664 |
| Oligonucleotides | ||
| siRNA smartpools for human ACLY, ACSS2, Tip60 and a non-silencing control | Dharmacon |
ACLY (Cat. No. L-004915) ACSS2 (Cat. No. L-010396) Tip60 (Cat. No. L-006301) Non-silencing control (Cat. No. D-001810-10-20) |
| siRNA targeting hACLY (includes control hairpin) | Origene | Cat. No. SR300035 |
| TelC-Cy3 probe | Panagene | Cat No. F1002-5 |
| Recombinant DNA | ||
| Human ACLY shRNA in pGIPZ lentiviral vector | Dharmacon | |
| NES Fusion construct PKI NES (LALKLAGLDI) |
Wen et. al., 1995 | PMID: 7634336 |
| mACLY constructs (mACLY-WT, mACLY-S455A, mACLY-S455D, and mACLY-H760A) |
Lee et. al., 2014 Zhao et. al., 2016 |
PMID: 24998913 PMID: 27760311 |
| pLPC TRF2 deltaB delta M | Addgene | Plasmid #18008 |
| Software and Algorithms | ||
| ImageJ |
https://imagej.nih.gov/ij/ https://github.com/imagej/imagej1 |
|
| Fiji | https://fiji.sc | |
| GraphPad Prism 6 | Graph Pad | N/A |
CONTACT FOR REAGENT AND RESOURCE SHARING
Further information and requests for resources and reagents should be directed to and will be fulfilled by the Lead Contact, Kathryn E. Wellen (wellenk@upenn.edu).
EXPERIMENTAL MODEL AND SUBJECT DETAILS
Generation of cell lines
HeLa, A549, LN229, HCT116, and B16-F10 (B16) cells were obtained from ATCC. LN229 cells expressing ACLY mutants have been previously described(Lee et al., 2014). LN229 cells with CRISPR-mediated ACLY deletion have been described previously(Zhao et al., 2016).
The U2OS DSB reporter cell line was previously reported(Tang et al., 2013). The DR-GFP cells, previously described(Pierce et al., 2001), were kindly provided by M. Jasin. 53BP1 was deleted in U2OS cells using the following approach: sgRNA sequences targeting different genomic regions of 53BP1 (53BP1_Top: CACCGTTGACTCTGCCTGATTGTA and 53BP1_Bottom: AAACTACAATCAGGCAGAGTCAAC) were cloned into LentiCrispr v2 vector(Shalem et al., 2014). Colony PCR was performed with positive sgRNA insertion. Production of lentiviral vectors was performed according to standard protocol. U2OS cells were then infected with viral particles carrying different sgRNA sequences targeting 53BP1 and selected with Puromycin. Single clones were selected and expanded before gene disruption was screened by western blotting and quantitative qPCR. Two different clonal lines (sg53BP1 2A and sg53BP1 3D) were used for subsequent analysis and experiments.
pEF6, pEF6-mACLY, pEF6-mACLY-S455A, pEF6-mACLY-S455D, and pEF6-mACLY- H760A have been previously described(Lee et al., 2014; Zhao et al., 2016). mACLY-NES fusion construct was generated using primers encoding for the PKI NES (LALKLAGLDI)(Wen et al., 1995). Forward (AATTCAGATCTGTCGACCTGGCGCTGAAACTGGCGGGCCTGGATATTTAAC) and reverse (TCGAGTTAAATATCCAGGCCCGCCAGTTTCAGCGCCAGGTCGACAGATCTG) primers were annealed, and cloned into pBabe-puro by restriction digest with EcoRI and SalI. mACLY was then cloned into pBabe-puro-NES by PCR amplification using forward (GGAATTCATGTCAGCCAAGGCAATTTCAGAGC) and reverse (ACGCGTCGACCATGCTCATGTGTTCTGGAAGAAC) primers, followed by restriction digest using EcoRI and SalI, and ligation. To generate pEF6-mACLY-NES, mACLY-NES was subcloned from pBabe-puro into pEF6 by PCR amplification using forward (GGAATTCATGTCAGCCAAGGCAATTTCAGAGC) and reverse (ATAAGAATGCGGCCGCTTAAATATCCAGGCCCGCCAGTTTC) primers, followed by restriction digest using EcoRI and NotI, and ligation. Constructs were validated by sequencing.
Cell culture conditions
All cell lines were cultured in DMEM supplemented with 10% calf-serum (CS) and L-glutamine and were routinely monitored for mycoplasma. Cell lines were authenticated by short tandem repeat (STR) profiling using the Geneprint® 10 System (Promega). Data were matched against the ATCC reference database (https://www.atcc.org/STR_Database.aspx).
Generation of tumor xenograft model
For examining pACLY (S455) levels in vivo, 50,000 B16 cells were mixed with an equal volume of Matrigel (BD Biosciences) and injected subcutaneously into the left and right flanks of 6–8 week old female C57BL/6 mice. Animals were maintained under standard housing conditions in accordance with the University of Pennsylvania and the Institutional Animal Care and Use Committee (IACUC) guidelines.
METHOD DETAILS
Antibodies and inhibitors
Inhibitors used were as follows: AKT1/2/3 inhibitor MK-2206 (1 M), ATM inhibitor KU 55933 (Tocris Biosciences, 10 M). Antibodies used for western blots include: pATM S1981 (Millipore), pAKT S473 and T308, pACLY S455 (Cell Signaling), tubulin (Sigma), ACLY (either as previously described(Hatzivassiliou et al., 2005) or from Cell Signaling or Proteintech), total Akt (1:1000, Cell Signaling), DNMT1 (Active Motif), Lamin A/C (Cell Signaling). All antibodies for western blot was diluted 1:1000 in 3% BSA. Antibody used for ChIP: acetylated histone H4 (Millipore). pACLY (S455) antibody used for IHC (1:100, #SAB4504020, Sigma). Antibodies used for immunofluorescence (IF): BRCA1 (1:100, Santa-Cruz Biotechnology), 53BP1 (1:300, Novus Biologicals), γH2AX S139 (1:500, Millipore or Cell Signaling).
RNA interference
siRNA smartpools targeting human ACLY, ACSS2, TIP60, and a non-silencing control were obtained for Dharmacon. Briefly, cells were seeded at 60–70% confluency and siRNA was mixed with the RNAiMax (ThermoFisher) according to standard publicly available protocol. Experiments were performed 48–72h after transfection. Human ACLY shRNA in pGIPZ lentiviral was obtained from Dharmacon; shACLY#12 (V2LHS_94212), shACLY#13 (V2LHS_94213). Lentiviral production in 293T cells was done using standard protocols. Briefly, transfection mix containing viral variant, pMD2G, and psPAX vectors were combined with TE buffer, H2O, CaCl2, and HeBS, incubated for 5 min and added to subconfluent 293T cells in 15 cm plates and incubated for 16 h. Media was replaced next day and incubated 8 h. 8 h later, media was collected and the fresh media was added to the cells. This process was repeated 1×, combined, filtered using a 0.45 μM filter, aliquoted in eppendorf tubes and frozen. For the knockdown experiments, desired cells were seeded for 16 h and viral supernatant was combined with 8 μg/ml of polybrene with serum free media. Media was changed after 6 h and cells were analyzed 48–72 h after knockdown.
Whole cell lysate, sub-cellular fractionation and western blotting
Cells were grown to 80–90% confluency prior to treatment with 5Gy IR in 6 cm plates. Whole cell lysates were obtained by rinsing cells in cold-PBS and lifting cells of plate in RIPA buffer, incubating on ice, and clarifying lysate with a high-speed spin. Cells were either pre-treated with 20 M Akt inhibitor for 1h prior to IR or 10 M ATM inhibitor for 15 min prior to IR. Cells were washed once with ice-cold 1× PBS and lifted off the dish with a cell-lifter in buffer A (10mM Hepes, pH7.4, 10mM KCl, 1.5mM MgCl2, 0.5mM EDTA, 0.5mM EGTA) supplemented with fresh protease inhibitors and phosphatase inhibitor and 0.1% NP-40. The lysates were kept on ice for 15 min to isolate the cytoplasmic fraction. The nuclei pellet was washed 2× in buffer A (without NP-40) and resuspended in buffer B (10mM Hepes pH7.4, 0.42M NaCl, 2.5% ultra-pure glycerol, 1.5mM MgCl2, 0.5mM EDTA, 0.5mM EGTA) supplemented with fresh protease and phosphatase inhibitors and 1mM DTT. The nuclear fraction was kept on ice for 30 min, before high-speed spin and quantification by BSA (Thermo Scientific). Samples were prepared for western blot analysis using 4×-gel loading dye (Invitrogen) and either NuPAGE or BOLT gel systems (Invitrogen). Proteins were transferred onto nitrocellulose membranes and subsequent analysis was performed using standard protocols. Following secondary antibody incubation (Li-Cor), membranes were scanned using the Li-Cor blot scanner using ImageStudioLite software.
Tumor irradiation and immunohistochemistry
Fourteen days after injection of 50,000 B16 cells into C57BL/6 mice, the tumor on one flank of the mouse was irradiated at 20Gy IR. IR with the Small Animal Radiation Research Platform (Xstrahl) using a 5mm × 5mm collimator. Radiation was delivered perpendicular to the plane of the mouse to ensure only one tumor received radiation. The tumors were harvested either 0.5 h or 1 h after IR. The resected tumor was fixed in formalin overnight. Immunohistochemistry was performed on paraffin-embedded sections. Tissue sections were dewaxed and rehydrated using standard protocol. Antigen retrieval was performed by boiling samples in the microwave in citrate buffer (pH6) at 30% power for 40 min. Endogenous peroxidase activity was inhibited by using 3% hydrogen peroxidase. Sections were blocked in 2–5% BSA in PBS and incubated in primary antibody for pACLY (S455) overnight. Sections were rinsed in PBS and developed using Vector NovaRED Peroxidase (HRP) substrate kit (Vector Laboratories). Sections were counterstained with hematoxylin. Quantification of nuclear pACLY staining was performed using ImageJ software. All animal studies were approved by the University of Pennsylvania and the Institutional Animal Care and Use Committee (IACUC).
Glucose uptake assay and YSI
At 30 min, 1 hr, and 2 hrs following IR treatment, cells were washed in warm KRH buffer pH 7.4 (115mM NaCl, 5mM KCl, 1mM KH2PO4, 25mM HEPES, 1mM CaCl2) and incubated for 10 min at 37°C. 0.5uCi Deoxy-D-Glucos e, 2-[1,2-3H (N)] was then added to each well and cells were incubated fro 30min at 37C. Care was taken to ensure that each well got exposed to the glucose for the exact amount of time. After 30 min, cells were washed with cold KRH to stop the reaction. All the solution was aspirated and the 500 l of 0.1% SDS was added to each well to lyse the cells. 400 l of the solution was transferred to a small scintillation vial for counting. No radioisotope control was used as a negative control. The Deoxy-D-Glucose, 2-[1,2-3H (N)] was from Perkin Elmer NET 328A250UC-lot 1914291). All experiments were done and materials were disposed in accordance with the radioactive safety guidelines established by the University of Pennsylvania.
YSI experiments were done in the following manner. Cells were seeded at low density in a 12 well plate in regular DMEM (10%CS+1% L-glutamine). The next day, medium was changed (to DMEM + 10% CS), and cells were treated +/− 5 Gy IR. 6 h later, the media was collected and the cells were counted. Media was then spun down at 1000 rpm for 5 min, to remove debris, and analyzed on the YSI 7100 analyzer, following calibration of the instrument and verification of the precision of the instrument using a standard with known levels of glucose and glutamine. Each condition was plated for biological triplicates, and each media sample was measured twice for analytical replicates. Average of the analytic replicates was used for final analysis of biological triplicates, and standard t-test was used to determine significance between the variables.
13C-glucose tracer analysis
For TCA cycle analysis, A549 cells were grown in uniformly labeled 10mM glucose (D-GLUCOSE (U-13C6, 99%) from Cambridge Isotope laboratories) for at least 6 h following IR treatment. Media was removed and the cells were rinsed quickly with PBS, trypsinized, transferred to a 15ml conical tube and spun at 1000rpm for 3 min. The cells were resuspended in 2.5 ml of glass-distilled H2O (pH 1–2). The samples were transferred to a glass tube and 2.5 ml of ethyl-acetate was added and vortexed for 20 sec at high speed. Samples were then spin at 3000g for 5 min and the upper organic phase was transferred to a glass vial. Ethyl-acetate extraction was repeated and the samples were pooled and dried under a stream of nitrogen at RT. 0.5 ml of MeOH and 0.5 ml of methylene chloride was added and vortexed well and dried under a stream of nitrogen at RT. 150 l of ethyl acetate and 150 l of BSTFA/TMCS was added and the samples were capped and heated at 70°C for 30 min. Cooled samples were transferred to the auto-injector vial for analysis by mass-spectrometry. One microliter of the trimethylsilyl-derivatized preparation was injected splitless into an Agilent 6890N series gas chromatograph (Agilent Technologies, Santa Clara, CA) and separated on an Agilent HP-5MS column (30m × 250μM) cross-linked with 5% phenylmethylsiloxane. The oven was set at 70°C for two min, ramped at 5°C until 250°C and baked off at 300°C for 10 min giving a total run time of 53 min. The data was analyzed in full scan mode in an Agilent 5973 mass selective detector ranged from m/z 50–550. Compounds were positively identified from authentic standards. Isotopic enrichments were measured as atom percent excess above a baseline spectrum for all compounds of interest.
Long chain fatty acids were analyzed by GC/MS using fatty acid methyl-ester (FAME) approach. Cells were grown to a level of 5×10⁶ cells in a 15 cm plate. Cells were labeled with 13C glucose and treated simultaneously for 24 h. After 24 h, the media was removed and cells were washed with 10 ml ice cold PBS. Cells were washed a second time with 10 ml PBS containing 1% fatty acid free albumin (Sigma) to remove extracellular traces of lipids. Cells were washed again with 10 ml PBS. Trypsinized cells were collected and trypsin was quenched with 5ml PBS containing 1% fatty acid free albumin. Cells were counted, spun at 1000 rpm for 5 min at 4°C, and pellet was washed with 5ml ice-cold PBS. 1 ml ice-cold methanol (MeOH) was added to the pellet and sample was transferred to a 15 ml round-bottom glass centrifuge tube. Original tube was rinsed with 1ml ice-cold methanol and combined. 1ml of chloroform was added to the methanol and samples were sonicated for 30 s (30 cycles) using a probe sonicator. 0.7 ml of chloroform and 0.7 ml of glass distilled water was added to the sample resulting in two immiscible phases. 1mM heptadecanoic acid in MeOH was added as an internal standard. Samples were sonicated and spun at 8000 rpm for 10 min at 4°C. Bottom fraction containing lipids was transferred to a new 15 ml centrifuge tube. Cell pellet was re-extracted a second time and fractions were combined. 0.1 ml of glass distilled was added to the chloroform fraction and sonicated briefly. The samples were spun at 8000 rpm for 10 min at 4°C. The chloroform fraction was transferred to a thick wall sealable glass FAME tube. Chloroform was evaporated by blowing nitrogen over the top of its surface. 2 ml of IS mix containing MeOH, toluene and butylated hydroxytoluene was added to the dried lipids. 2 μl of acetyl chloride was added, tube was sealed with a butyl rubber cap, secured, and heated at 95°C for 1 h to convert fatty acids to methyl esters. The methyl ester/MeOH solution was transferred to a glass centrifuge tube containing 5 ml of 6% potassium carbonate in H2O. The top layer was transferred to an eppendorf tube and spun at 8000 rpm for 3–5 min. The organic phase was transferred to a GC/MS glass insert and then inserted into a standard 1.5 ml GC/MS vial and sealed with Teflon lined cap. The sample was analyzed with the Agilent GC/MS system and the IsoCor software.
Propidium Iodide Staining
1−1.5×10⁶ cells were plated onto 10 cm plates. 24 h later cells were trypsinized and washed 1× in 5–10 ml of PBS to remove residual serum. Cells were counted and 1×10⁶ cells were spun at 300 g for 5 min at 4°C, washed i n 5–10 ml of 1× PBS. Cell pellet was resuspended in 0.5 ml of 1× PBS. While vortexing, 4.5 ml of ice-cold 70% EtOH was added to the resuspended cells (dropwise). Samples were incubated either in 4°C for a few hours or frozen in −20°C until staining with pr opidium iodide. Prior to analysis, cells were spun at 300 g for 5 min at 4°C. The supernatan t was removed and cells were washed 2× in 5–10 ml of 1× PBS. Cells were pelleted at 300 g for 5 min at 4°C. The supernatant was removed and the cells were resuspended in 0.5 ml of PI staining solution (1× PBS, 100 g/ml RNAse A, 40 g/ml propidium iodide). Samples were subsequently analyzed using the Attune NxT flow cytometer (Thermo Scientific).
Immunofluorescence
Cells were grown at 25,000 cells on coverslips in a 24 well plate and transfected with smartpool siRNA against either control sequence or ACLY (Dharmacon). 48 h after siRNA knockdown, damage was induced with either 2 Gy IR (HeLa, A549) for 4 h or Shield-1/4-OHT (U2OS reporter lines) for 5 h. Cells were rinsed in ice-cold PBS and fixed in a formaldehyde/sucrose solution for 10 min at RT. Cells were washed 2× in PBS and permeabilized in 0.1% Triton-X solution for 5 min on ice or in 4°C and washed 3× with PBS. Primary antibody was added and the coverslips were incubated at 37°C for 20 min. Coverslips were washed with PBST 3× and incubated with Alexa Fluor 488 dye or Alexa Fluor 555 dye (Thermo Fisher Scientific) or FITC-conjugated secondary antibody (BD Biosciences) for 20 min at 37°C. The c overslips were then washed 4× in PBST and mounted with DAPI nuclear stain on coverslips. For ACLY overexpression studies in LN229 sg3.8 cells, 70,000 cells were plated on coverslips in 24 well plate and transfected with mACLY constructs using lipofectamine 2000 or lipofectamine 3000 (Invitrogen) 24h later. 48 h after transfection, cells were treated with 2Gy IR for 4h and processed as above. For ACLY overexpression studies with transient ACLY knockdown, ACLY was silenced as above in LN229 cells stably expressing mACLY constructs.
Chromatin immunoprecipitation
Chromatin immunoprecipitation (ChIP) was performed using a U2OS TRF1-Fok1 reporter line as described previously (Tang et al., 2013). Briefly, 48 h after transfection with control or ACLY-targeting siRNA pools, cells were grown to 80% confluency and treated with Shield-1 and 4-OHT for 5 h. 150 g of protein was used for each IP with 20 l of protein G magnetic beads (Millipore 16-662) and incubated with antibody against AcH4 (Millipore 06-866) overnight at 4°C.
Quantitative PCR
ChIP samples were diluted 1:20 and used as template with Power Sybr Master Mix (AB1 4367659). DNA was amplified using ViiA-7 Real-Time PCR system using PCR primers previously described and generated (Tang et al., 2013).
HR assay
To examine HR, DR-GFP reporter cells were plated at 30,000–50,000 cells/well in a 12 well plate and reverse transfected with either control hairpin or individual siRNAs targeting ACLY (Origene) with RNAiMax (Thermo Fischer Scientific) using standard protocol. 24 h later, cells were transfected with Sce-1 (0.4 g/well) and lipofectamine 2000 (Thermo Fischer Scientific). Cells were assayed by flow cytometry 48 h after transfection. For ACLY knockdown and rescue experiments, DR-GFP cells were seeded in 6 well plate and transduced with EV or mACLY constructs with polybrene (8 g/ml). 24 h later, cells were re-seeded in a 12 well plate and reverse transfected with siRNA SMARTpool against ACLY (Dharmacon) and re-transfected with Sce-1 (0.4 g/ml) 24 h following siRNA transfection. Cells were subsequently harvested 48 h after Sce-1 transfection and GFP+ cells examined 48 h-72 h later using Attune NxT flow cytometer (Thermo Scientific).
Metaphase spreads
HeLa cells were plated at low density on 10 cm plates and treated with 5 μM olaparib for 24 h. Colcemid at a final concentration 100ng/ml was added to each 10 cm dish and incubated at 37°C for at least 1.5 h. The media was collected; the cells were rinsed in 1× trypsin and transferred and the trypsin was combined with media. The cells were trypsinized in 37°C for 5 min and the trypsin was q uenched with the collected media. Cells were spun at 1000rpm for 10 min at 4°C. Most of the media was aspirated leaving 500μl behind. 7 ml of hypotonic solution (0.8% sodium citrate, pre-warmed to 37°C) was added dropwise and the sample was mixed by gentle flicking of the tube. Samples were incubated at RT for 10 min, followed by spin at 1000 rpm for 10 min at 4°C. Solution was aspirated, leaving 500μl behind. The cells were resuspended in the 500μl and 7ml of Carnoy’s Fixative (75% Methanol, 25% Acetic Acid; made fresh) was added to the tube while mixing. Samples were incubated for 10 min at RT and spun at 1000 rpm for 10 min at 4°C. This was repeated 2×. Most of the su pernatant was aspirated and the final pellet was resuspended in 300–500μl of the Carnoy’s Fixative. The samples were dropped onto slides in a 37°C water bath and once d ried, stained with 1:20 diluted Giemsa stain (Sigma), rinsed 2× in ddH2O, air-dried, and sealed with mounting media and cover-slips.
FISH
pLPC TRF2 deltaB delta M vector (addgene plasmid #18008) was obtained and viral supernatant was generated using standard protocol with PhxA cells. HeLa cells were infected with the virus and selected for one week with puromycin. Following a 48 h transient knockdown of ACLY using shRNA, samples were processed to generate metaphase spreads as outlined above in HeLa cells stably overexpressing mutant TRF2. Once metaphases were dropped on the slides and dried, the slides were rehydrated with PBS (pH7–7.5) 3× for 5 min each. Slides were dehydrated in EtOH series: 5 min each in 70%, 90%, 100% at RT. Hybridization solution was prepared fresh (10mM Tris-HCl pH7.5, 70% deiodized formamide (Millipore), 0.5% blocking reagent (Roche)). PNA probe (TelC-Cy3 probe, Panagene) was added to the hybridization solution and incubated for 3 min at 75°C. The PNA/h ybridization mix was added to the slide and topped with a coverslip and the entire slide was placed on a 75°C heat block for 3 min. Slides were removed and allowed to cool for ~5 min. The slides were then placed in a humidified chamber in the dark overnight. The slides were then washed with RT wash buffer (70% formamide (Amresco), 10mM Tris, pH 7.4) 3–4 times 5 min each. Slides were then washed with PBST 1× 5min, PBST+DAPI 1× 5min, followed by PBST wash for 5 min. Metaphases were then mounted with coverslips using vecta shield and imaged.
Metabolomics
LC-MS/MS was performed on a Waters Acquity UPLC coupled to a Waters TQ-S Micro mass spectrometer (Waters Corporation, Milford, MA, USA). Liquid chromatography conditions and mass spectrometer parameters were based on published methods(Rhoades, 2016), with chromatographic separation of metabolites performed using a Waters BEH Amide (100mm × 2.1mm × 2.5μm) column. Data processing was accomplished using Waters TargetLynx software (version 4.1).
Ion counts were exported from TargetLynx and subsequently processed in R (v3.2.4). Quality control (QC) samples, which consisted of a pooled sample of all cell samples, were injected at the beginning of the batch for LC column equilibration and every 6 injections during the analysis to account for instrumental drift. For every metabolic feature, a best-fit linear regression function was fitted to the QC data, which was then used as a normalization factor for the samples as a function of run order(Dunn et al., 2011). Additionally, metabolic features that appeared in less than 50% of the QC samples and displayed a relative standard deviation (RSD) greater than 30% were dropped from the final dataset. Heatmaps for the metabolomic dataset were generated using the heatmap3 (v1.1.1) package in R. Additionally, metabolic features which appeared in less than 50% of the QC samples and displayed a relative standard deviation (RSD) greater than 30% were dropped from the final dataset. Heatmaps from the metabolomic dataset were generated using the heatmap3 (v1.1.1) package in R. Prior to generating the heatmap, biological replicate values were averaged and normalized row-wise to the Untreated Control. Scaling was then performed column-wise to adjust for differences in metabolite intensities across the samples using a mean-centering approach. Selected metabolites were graphed individually on biological triplicates and statistics was performed using standard t-test for either individual time points or for grouped datasets to assess effect of genetic manipulation.
Quantification and Statistical Analysis
Quantification for the immunofluorescence images was performed using established protocols1,2. Images were first taken by focusing on DAPI staining or on TRF1/Fok1/γH2AX staining in a semi-blinded manner (i.e. fields were chosen without observing criteria to be scored: BRCA1, 53BP1, or γH2AX). All images within each experiment were taken at the same time using the same exposure for each channel. Images were exported onto ImageJ (for IF) or onto Fiji (for FISH). For IF images using the reporter cell line, the images were converted to 16bit format and a pre-defined area was drawn around the foci area, which was kept consistent for all subsequent quantification within the same experiment. The foci intensity with the pre-defined area was quantified. For the IF images using ionizing radiation, the image was converted to 16bit format and the threshold was adjusted for the first image so as to visualize all the foci. This threshold was then used for all subsequent images within the same experiment. Each individual data point (or foci) for each image was then entered into an excel file and the average of all the foci for 10–25 images (depending on the experiment) was calculated and plotted. For the quantification of the foci number, the number of γH2AX was first determined per image. Next, the number of cells that stained positive for BRCA1 (>5 distinct foci) was determined as a percentage of the cells that also stain positive for γH2AX or cyclin A (>5 distinct foci). For the BRCA1 and 53BP1 quantification presented in figure 1, for the 10 fields analyzed, 100–200 γH2AX+ cells were examined per condition. For the cyclin A/BRCA1 data presented in figure 1, between 100–150 cyclin A positive cells were examined per condition. For foci quantification with IR, up to 30,000 individual foci were quantified in each condition. For foci quantification with the U2OS reporter lines, approximately 50 individual cells were examined per condition in each experiment. For the metaphase spreads and FISH analysis, individual metaphases were analyzed and the samples were scored by the number of distinct fusions, radials or breaks observed. For the FISH experiment, samples were scored based on consensus of whether a fusion was observed or not by two independent reviewers (S.S. and Q.J.), who were blinded to the experimental conditions. Each data point was plotted and standard t-test was used to determine significance.
All statistics were done using unpaired, two-tailed Student’s t-test with equal variance, using either Microsoft Excel or Graph Pad (Prism 6). All graphs were generated using Prism 6 Graph Pad software.
Supplementary Material
Table S1. Metabolomics dataset, Related to Figure 3.
HIGHLIGHTS.
ATP-citrate lyase (ACLY) is required for DNA damage-induced histone acetylation.
ACLY silencing suppresses BRCA1 recruitment and homologous recombination.
Nuclear ACLY is phosphorylated at S455 in S/G2 phase cells upon DNA damage.
ACLY phosphorylation and nuclear localization promote BRCA1 recruitment.
Acknowledgments
This work was supported by R21 CA194973 to RAG and KEW and by R01 CA174761 and a Pew Biomedical Scholar Award to KEW. SR is supported by a Pharmacology T32 training grant (T32 GM008076). SZ is supported by a Tumor Virology training grant T32 CA115299. JVL is supported by predoctoral fellowship F31 CA189744.
Footnotes
Publisher's Disclaimer: This is a PDF file of an unedited manuscript that has been accepted for publication. As a service to our customers we are providing this early version of the manuscript. The manuscript will undergo copyediting, typesetting, and review of the resulting proof before it is published in its final citable form. Please note that during the production process errors may be discovered which could affect the content, and all legal disclaimers that apply to the journal pertain.
SUPPLEMENTAL INFORMATION
Supplemental information includes seven figures and one table.
AUTHOR CONTRIBUTIONS
SS, RAG, and KEW conceptualized project and designed research. SS performed the majority of experiments and prepared figures. SR and AMW performed metabolomics profiling. QJ, JVL, SY, IV, and AC performed or assisted with experiments. JZ and SZ generated reagents. MJB performed TCA cycle metabolite analysis. JB and AJM performed xenograft assay and irradiated tumors. SS and KEW wrote manuscript. All authors read and provided feedback/editing on manuscript.
The authors declare no competing financial interests.
References
- Aly A, Ganesan S. BRCA1, PARP, and 53BP1: conditional synthetic lethality and synthetic viability. J Mol Cell Biol. 2011;3:66–74. doi: 10.1093/jmcb/mjq055. [DOI] [PMC free article] [PubMed] [Google Scholar]
- Bennetzen MV, Larsen DH, Bunkenborg J, Bartek J, Lukas J, Andersen JS. Site-specific phosphorylation dynamics of the nuclear proteome during the DNA damage response. Mol Cell Proteomics. 2010;9:1314–1323. doi: 10.1074/mcp.M900616-MCP200. [DOI] [PMC free article] [PubMed] [Google Scholar]
- Berwick DC, Hers I, Heesom KJ, Moule SK, Tavare JM. The identification of ATP-citrate lyase as a protein kinase B (Akt) substrate in primary adipocytes. J Biol Chem. 2002;277:33895–33900. doi: 10.1074/jbc.M204681200. [DOI] [PubMed] [Google Scholar]
- Bozulic L, Surucu B, Hynx D, Hemmings BA. PKBalpha/Akt1 acts downstream of DNA-PK in the DNA double-strand break response and promotes survival. Mol Cell. 2008;30:203–213. doi: 10.1016/j.molcel.2008.02.024. [DOI] [PubMed] [Google Scholar]
- Brown KK, Spinelli JB, Asara JM, Toker A. Adaptive Reprogramming of De Novo Pyrimidine Synthesis Is a Metabolic Vulnerability in Triple-Negative Breast Cancer. Cancer Discov. 2017 doi: 10.1158/2159-8290.CD-16-0611. [DOI] [PMC free article] [PubMed] [Google Scholar]
- Bulusu V, Tumanov S, Michalopoulou E, van den Broek NJ, MacKay G, Nixon C, Dhayade S, Schug ZT, Vande Voorde J, Blyth K, et al. Acetate Recapturing by Nuclear Acetyl-CoA Synthetase 2 Prevents Loss of Histone Acetylation during Oxygen and Serum Limitation. Cell Rep. 2017;18:647–658. doi: 10.1016/j.celrep.2016.12.055. [DOI] [PMC free article] [PubMed] [Google Scholar]
- Bunting SF, Callen E, Wong N, Chen HT, Polato F, Gunn A, Bothmer A, Feldhahn N, Fernandez-Capetillo O, Cao L, et al. 53BP1 inhibits homologous recombination in Brca1-deficient cells by blocking resection of DNA breaks. Cell. 2010;141:243–254. doi: 10.1016/j.cell.2010.03.012. [DOI] [PMC free article] [PubMed] [Google Scholar]
- Cai L, Tu BP. On acetyl-CoA as a gauge of cellular metabolic state. Cold Spring Harb Symp Quant Biol. 2011;76:195–202. doi: 10.1101/sqb.2011.76.010769. [DOI] [PubMed] [Google Scholar]
- Ciccia A, Elledge SJ. The DNA damage response: making it safe to play with knives. Mol Cell. 2010;40:179–204. doi: 10.1016/j.molcel.2010.09.019. [DOI] [PMC free article] [PubMed] [Google Scholar]
- Clarke TL, Sanchez-Bailon MP, Chiang K, Reynolds JJ, Herrero-Ruiz J, Bandeiras TM, Matias PM, Maslen SL, Skehel JM, Stewart GS, et al. PRMT5-Dependent Methylation of the TIP60 Coactivator RUVBL1 Is a Key Regulator of Homologous Recombination. Mol Cell. 2017;65:900–916 e907. doi: 10.1016/j.molcel.2017.01.019. [DOI] [PMC free article] [PubMed] [Google Scholar]
- Cluntun AA, Huang H, Dai L, Liu X, Zhao Y, Locasale JW. The rate of glycolysis quantitatively mediates specific histone acetylation sites. Cancer Metab. 2015;3:10. doi: 10.1186/s40170-015-0135-3. [DOI] [PMC free article] [PubMed] [Google Scholar]
- Cosentino C, Grieco D, Costanzo V. ATM activates the pentose phosphate pathway promoting anti-oxidant defence and DNA repair. Embo J. 2011;30:546–555. doi: 10.1038/emboj.2010.330. [DOI] [PMC free article] [PubMed] [Google Scholar]
- Covarrubias AJ, Aksoylar HI, Yu J, Snyder NW, Worth AJ, Iyer SS, Wang J, Ben-Sahra I, Byles V, Polynne-Stapornkul T, et al. Akt-mTORC1 signaling regulates Acly to integrate metabolic input to control of macrophage activation. Elife. 2016;5 doi: 10.7554/eLife.11612. [DOI] [PMC free article] [PubMed] [Google Scholar]
- Das C, Lucia MS, Hansen KC, Tyler JK. CBP/p300-mediated acetylation of histone H3 on lysine 56. Nature. 2009;459:113–117. doi: 10.1038/nature07861. [DOI] [PMC free article] [PubMed] [Google Scholar]
- DeBerardinis RJ, Chandel NS. Fundamentals of cancer metabolism. Sci Adv. 2016;2:e1600200. doi: 10.1126/sciadv.1600200. [DOI] [PMC free article] [PubMed] [Google Scholar]
- Dimitrova N, Chen YC, Spector DL, de Lange T. 53BP1 promotes non-homologous end joining of telomeres by increasing chromatin mobility. Nature. 2008;456:524–528. doi: 10.1038/nature07433. [DOI] [PMC free article] [PubMed] [Google Scholar]
- Escribano-Diaz C, Orthwein A, Fradet-Turcotte A, Xing M, Young JT, Tkac J, Cook MA, Rosebrock AP, Munro M, Canny MD, et al. A cell cycle-dependent regulatory circuit composed of 53BP1-RIF1 and BRCA1-CtIP controls DNA repair pathway choice. Mol Cell. 2013;49:872–883. doi: 10.1016/j.molcel.2013.01.001. [DOI] [PubMed] [Google Scholar]
- Etchegaray JP, Mostoslavsky R. Interplay between Metabolism and Epigenetics: A Nuclear Adaptation to Environmental Changes. Mol Cell. 2016;62:695–711. doi: 10.1016/j.molcel.2016.05.029. [DOI] [PMC free article] [PubMed] [Google Scholar]
- Evertts AG, Zee BM, Dimaggio PA, Gonzales-Cope M, Coller HA, Garcia BA. Quantitative dynamics of the link between cellular metabolism and histone acetylation. J Biol Chem. 2013;288:12142–12151. doi: 10.1074/jbc.M112.428318. [DOI] [PMC free article] [PubMed] [Google Scholar]
- Farmer H, McCabe N, Lord CJ, Tutt AN, Johnson DA, Richardson TB, Santarosa M, Dillon KJ, Hickson I, Knights C, et al. Targeting the DNA repair defect in BRCA mutant cells as a therapeutic strategy. Nature. 2005;434:917–921. doi: 10.1038/nature03445. [DOI] [PubMed] [Google Scholar]
- Fradet-Turcotte A, Canny MD, Escribano-Diaz C, Orthwein A, Leung CC, Huang H, Landry MC, Kitevski-LeBlanc J, Noordermeer SM, Sicheri F, et al. 53BP1 is a reader of the DNA-damage-induced H2A Lys 15 ubiquitin mark. Nature. 2013;499:50–54. doi: 10.1038/nature12318. [DOI] [PMC free article] [PubMed] [Google Scholar]
- Fraser M, Harding SM, Zhao H, Coackley C, Durocher D, Bristow RG. MRE11 promotes AKT phosphorylation in direct response to DNA double-strand breaks. Cell Cycle. 2011;10:2218–2232. doi: 10.4161/cc.10.13.16305. [DOI] [PubMed] [Google Scholar]
- Gong F, Miller KM. Mammalian DNA repair: HATs and HDACs make their mark through histone acetylation. Mutat Res. 2013;750:23–30. doi: 10.1016/j.mrfmmm.2013.07.002. [DOI] [PubMed] [Google Scholar]
- Hanahan D, Weinberg RA. Hallmarks of cancer: the next generation. Cell. 2011;144:646–674. doi: 10.1016/j.cell.2011.02.013. [DOI] [PubMed] [Google Scholar]
- Hatzivassiliou G, Zhao F, Bauer DE, Andreadis C, Shaw AN, Dhanak D, Hingorani SR, Tuveson DA, Thompson CB. ATP citrate lyase inhibition can suppress tumor cell growth. Cancer Cell. 2005;8:311–321. doi: 10.1016/j.ccr.2005.09.008. [DOI] [PubMed] [Google Scholar]
- Hickson I, Zhao Y, Richardson CJ, Green SJ, Martin NM, Orr AI, Reaper PM, Jackson SP, Curtin NJ, Smith GC. Identification and characterization of a novel and specific inhibitor of the ataxia-telangiectasia mutated kinase ATM. Cancer Res. 2004;64:9152–9159. doi: 10.1158/0008-5472.CAN-04-2727. [DOI] [PubMed] [Google Scholar]
- Hsiao KY, Mizzen CA. Histone H4 deacetylation facilitates 53BP1 DNA damage signaling and double-strand break repair. J Mol Cell Biol. 2013;5:157–165. doi: 10.1093/jmcb/mjs066. [DOI] [PubMed] [Google Scholar]
- Hu H, Juvekar A, Lyssiotis CA, Lien EC, Albeck JG, Oh D, Varma G, Hung YP, Ullas S, Lauring J, et al. Phosphoinositide 3-Kinase Regulates Glycolysis through Mobilization of Aldolase from the Actin Cytoskeleton. Cell. 2016;164:433–446. doi: 10.1016/j.cell.2015.12.042. [DOI] [PMC free article] [PubMed] [Google Scholar]
- Huertas P, Cortes-Ledesma F, Sartori AA, Aguilera A, Jackson SP. CDK targets Sae2 to control DNA-end resection and homologous recombination. Nature. 2008;455:689–692. doi: 10.1038/nature07215. [DOI] [PMC free article] [PubMed] [Google Scholar]
- Huertas P, Jackson SP. Human CtIP mediates cell cycle control of DNA end resection and double strand break repair. J Biol Chem. 2009;284:9558–9565. doi: 10.1074/jbc.M808906200. [DOI] [PMC free article] [PubMed] [Google Scholar]
- Hustedt N, Durocher D. The control of DNA repair by the cell cycle. Nat Cell Biol. 2016;19:1–9. doi: 10.1038/ncb3452. [DOI] [PubMed] [Google Scholar]
- Ibrahim YH, Garcia-Garcia C, Serra V, He L, Torres-Lockhart K, Prat A, Anton P, Cozar P, Guzman M, Grueso J, et al. PI3K inhibition impairs BRCA1/2 expression and sensitizes BRCA-proficient triple-negative breast cancer to PARP inhibition. Cancer Discov. 2012;2:1036–1047. doi: 10.1158/2159-8290.CD-11-0348. [DOI] [PMC free article] [PubMed] [Google Scholar]
- Ira G, Pellicioli A, Balijja A, Wang X, Fiorani S, Carotenuto W, Liberi G, Bressan D, Wan L, Hollingsworth NM, et al. DNA end resection, homologous recombination and DNA damage checkpoint activation require CDK1. Nature. 2004;431:1011–1017. doi: 10.1038/nature02964. [DOI] [PMC free article] [PubMed] [Google Scholar]
- Jackson SP, Bartek J. The DNA-damage response in human biology and disease. Nature. 2009;461:1071–1078. doi: 10.1038/nature08467. [DOI] [PMC free article] [PubMed] [Google Scholar]
- Jacquet K, Fradet-Turcotte A, Avvakumov N, Lambert JP, Roques C, Pandita RK, Paquet E, Herst P, Gingras AC, Pandita TK, et al. The TIP60 Complex Regulates Bivalent Chromatin Recognition by 53BP1 through Direct H4K20me Binding and H2AK15 Acetylation. Mol Cell. 2016;62:409–421. doi: 10.1016/j.molcel.2016.03.031. [DOI] [PMC free article] [PubMed] [Google Scholar]
- Jeong SM, Xiao C, Finley LW, Lahusen T, Souza AL, Pierce K, Li YH, Wang X, Laurent G, German NJ, et al. SIRT4 has tumor-suppressive activity and regulates the cellular metabolic response to DNA damage by inhibiting mitochondrial glutamine metabolism. Cancer Cell. 2013;23:450–463. doi: 10.1016/j.ccr.2013.02.024. [DOI] [PMC free article] [PubMed] [Google Scholar]
- Jiang Y, Qian X, Shen J, Wang Y, Li X, Liu R, Xia Y, Chen Q, Peng G, Lin SY, et al. Local generation of fumarate promotes DNA repair through inhibition of histone H3 demethylation. Nat Cell Biol. 2015;17:1158–1168. doi: 10.1038/ncb3209. [DOI] [PMC free article] [PubMed] [Google Scholar]
- Juvekar A, Burga LN, Hu H, Lunsford EP, Ibrahim YH, Balmana J, Rajendran A, Papa A, Spencer K, Lyssiotis CA, et al. Combining a PI3K inhibitor with a PARP inhibitor provides an effective therapy for BRCA1-related breast cancer. Cancer Discov. 2012;2:1048–1063. doi: 10.1158/2159-8290.CD-11-0336. [DOI] [PMC free article] [PubMed] [Google Scholar]
- Juvekar A, Hu H, Yadegarynia S, Lyssiotis CA, Ullas S, Lien EC, Bellinger G, Son J, Hok RC, Seth P, et al. Phosphoinositide 3-kinase inhibitors induce DNA damage through nucleoside depletion. Proc Natl Acad Sci U S A. 2016;113:E4338–4347. doi: 10.1073/pnas.1522223113. [DOI] [PMC free article] [PubMed] [Google Scholar]
- Kinnaird A, Zhao S, Wellen KE, Michelakis ED. Metabolic control of epigenetics in cancer. Nat Rev Cancer. 2016 doi: 10.1038/nrc.2016.82. [DOI] [PubMed] [Google Scholar]
- Lazzerini-Denchi E, Sfeir A. Stop pulling my strings - what telomeres taught us about the DNA damage response. Nat Rev Mol Cell Biol. 2016;17:364–378. doi: 10.1038/nrm.2016.43. [DOI] [PMC free article] [PubMed] [Google Scholar]
- Lee JV, Carrer A, Shah S, Snyder NW, Wei S, Venneti S, Worth AJ, Yuan ZF, Lim HW, Liu S, et al. Akt-dependent metabolic reprogramming regulates tumor cell histone acetylation. Cell Metab. 2014;20:306–319. doi: 10.1016/j.cmet.2014.06.004. [DOI] [PMC free article] [PubMed] [Google Scholar]
- Matsuoka S, Ballif BA, Smogorzewska A, McDonald ER, 3rd, Hurov KE, Luo J, Bakalarski CE, Zhao Z, Solimini N, Lerenthal Y, et al. ATM and ATR substrate analysis reveals extensive protein networks responsive to DNA damage. Science. 2007;316:1160–1166. doi: 10.1126/science.1140321. [DOI] [PubMed] [Google Scholar]
- Meier JL. Metabolic mechanisms of epigenetic regulation. ACS Chem Biol. 2013;8:2607–2621. doi: 10.1021/cb400689r. [DOI] [PMC free article] [PubMed] [Google Scholar]
- O’Connor MJ. Targeting the DNA Damage Response in Cancer. Mol Cell. 2015;60:547–560. doi: 10.1016/j.molcel.2015.10.040. [DOI] [PubMed] [Google Scholar]
- Orthwein A, Noordermeer SM, Wilson MD, Landry S, Enchev RI, Sherker A, Munro M, Pinder J, Salsman J, Dellaire G, et al. A mechanism for the suppression of homologous recombination in G1 cells. Nature. 2015;528:422–426. doi: 10.1038/nature16142. [DOI] [PMC free article] [PubMed] [Google Scholar] [Retracted]
- Osinalde N, Mitxelena J, Sanchez-Quiles V, Akimov V, Aloria K, Arizmendi JM, Zubiaga AM, Blagoev B, Kratchmarova I. Nuclear Phosphoproteomic Screen Uncovers ACLY as Mediator of IL-2-induced Proliferation of CD4+ T lymphocytes. Mol Cell Proteomics. 2016;15:2076–2092. doi: 10.1074/mcp.M115.057158. [DOI] [PMC free article] [PubMed] [Google Scholar]
- Panier S, Boulton SJ. Double-strand break repair: 53BP1 comes into focus. Nat Rev Mol Cell Biol. 2014;15:7–18. doi: 10.1038/nrm3719. [DOI] [PubMed] [Google Scholar]
- Pavlova NN, Thompson CB. The Emerging Hallmarks of Cancer Metabolism. Cell Metab. 2016;23:27–47. doi: 10.1016/j.cmet.2015.12.006. [DOI] [PMC free article] [PubMed] [Google Scholar]
- Pierce AJ, Hu P, Han M, Ellis N, Jasin M. Ku DNA end-binding protein modulates homologous repair of double-strand breaks in mammalian cells. Genes Dev. 2001;15:3237–3242. doi: 10.1101/gad.946401. [DOI] [PMC free article] [PubMed] [Google Scholar]
- Pietrocola F, Galluzzi L, Bravo-San Pedro JM, Madeo F, Kroemer G. Acetyl Coenzyme A: A Central Metabolite and Second Messenger. Cell Metab. 2015;21:805–821. doi: 10.1016/j.cmet.2015.05.014. [DOI] [PubMed] [Google Scholar]
- Potapova IA, El-Maghrabi MR, Doronin SV, Benjamin WB. Phosphorylation of recombinant human ATP:citrate lyase by cAMP-dependent protein kinase abolishes homotropic allosteric regulation of the enzyme by citrate and increases the enzyme activity. Allosteric activation of ATP:citrate lyase by phosphorylated sugars. Biochemistry. 2000;39:1169–1179. doi: 10.1021/bi992159y. [DOI] [PubMed] [Google Scholar]
- Reitsma JM, Savaryn JP, Faust K, Sato H, Halligan BD, Terhune SS. Antiviral inhibition targeting the HCMV kinase pUL97 requires pUL27-dependent degradation of Tip60 acetyltransferase and cell-cycle arrest. Cell Host Microbe. 2011;9:103–114. doi: 10.1016/j.chom.2011.01.006. [DOI] [PubMed] [Google Scholar]
- Shanbhag NM, Rafalska-Metcalf IU, Balane-Bolivar C, Janicki SM, Greenberg RA. ATM-dependent chromatin changes silence transcription in cis to DNA double-strand breaks. Cell. 2010;141:970–981. doi: 10.1016/j.cell.2010.04.038. [DOI] [PMC free article] [PubMed] [Google Scholar]
- Tang J, Cho NW, Cui G, Manion EM, Shanbhag NM, Botuyan MV, Mer G, Greenberg RA. Acetylation limits 53BP1 association with damaged chromatin to promote homologous recombination. Nat Struct Mol Biol. 2013;20:317–325. doi: 10.1038/nsmb.2499. [DOI] [PMC free article] [PubMed] [Google Scholar]
- Tjeertes JV, Miller KM, Jackson SP. Screen for DNA-damage-responsive histone modifications identifies H3K9Ac and H3K56Ac in human cells. Embo J. 2009;28:1878–1889. doi: 10.1038/emboj.2009.119. [DOI] [PMC free article] [PubMed] [Google Scholar]
- van Steensel B, Smogorzewska A, de Lange T. TRF2 protects human telomeres from end-to-end fusions. Cell. 1998;92:401–413. doi: 10.1016/s0092-8674(00)80932-0. [DOI] [PubMed] [Google Scholar]
- Vempati RK, Jayani RS, Notani D, Sengupta A, Galande S, Haldar D. p300-mediated acetylation of histone H3 lysine 56 functions in DNA damage response in mammals. J Biol Chem. 2010;285:28553–28564. doi: 10.1074/jbc.M110.149393. [DOI] [PMC free article] [PubMed] [Google Scholar]
- Viniegra JG, Martinez N, Modirassari P, Hernandez Losa J, Parada Cobo C, Sanchez-Arevalo Lobo VJ, Aceves Luquero CI, Alvarez-Vallina L, Ramon y Cajal S, Rojas JM, et al. Full activation of PKB/Akt in response to insulin or ionizing radiation is mediated through ATM. J Biol Chem. 2005;280:4029–4036. doi: 10.1074/jbc.M410344200. [DOI] [PubMed] [Google Scholar]
- Wellen KE, Hatzivassiliou G, Sachdeva UM, Bui TV, Cross JR, Thompson CB. ATP-citrate lyase links cellular metabolism to histone acetylation. Science. 2009;324:1076–1080. doi: 10.1126/science.1164097. [DOI] [PMC free article] [PubMed] [Google Scholar]
- Yun J, Zhong Q, Kwak JY, Lee WH. Hypersensitivity of Brca1-deficient MEF to the DNA interstrand crosslinking agent mitomycin C is associated with defect in homologous recombination repair and aberrant S-phase arrest. Oncogene. 2005;24:4009–4016. doi: 10.1038/sj.onc.1208575. [DOI] [PubMed] [Google Scholar]
- Zhao S, Torres A, Henry RA, Trefely S, Wallace M, Lee JV, Carrer A, Sengupta A, Campbell SL, Kuo YM, et al. ATP-Citrate Lyase Controls a Glucose-to-Acetate Metabolic Switch. Cell Rep. 2016;17:1037–1052. doi: 10.1016/j.celrep.2016.09.069. [DOI] [PMC free article] [PubMed] [Google Scholar]
- Zimmermann M, de Lange T. 53BP1: pro choice in DNA repair. Trends Cell Biol. 2014;24:108–117. doi: 10.1016/j.tcb.2013.09.003. [DOI] [PMC free article] [PubMed] [Google Scholar]
Associated Data
This section collects any data citations, data availability statements, or supplementary materials included in this article.
Supplementary Materials
Table S1. Metabolomics dataset, Related to Figure 3.