

Senescence-associated gene knockdown increases carbon exportation toward sink organs, increasing plant yield in Solanum lycopersicum.
Abstract
Senescence is the process that marks the end of a leaf’s lifespan. As it progresses, the massive macromolecular catabolism dismantles the chloroplasts and, consequently, decreases the photosynthetic capacity of these organs. Thus, senescence manipulation is a strategy to improve plant yield by extending the leaf’s photosynthetically active window of time. However, it remains to be addressed if this approach can improve fleshy fruit production and nutritional quality. One way to delay senescence initiation is by regulating key transcription factors (TFs) involved in triggering this process, such as the NAC TF ORESARA1 (ORE1). Here, three senescence-related NAC TFs from tomato (Solanum lycopersicum) were identified, namely SlORE1S02, SlORE1S03, and SlORE1S06. All three genes were shown to be responsive to senescence-inducing stimuli and posttranscriptionally regulated by the microRNA miR164. Moreover, the encoded proteins interacted physically with the chloroplast maintenance-related TF SlGLKs. This characterization led to the selection of a putative tomato ORE1 as target gene for RNA interference knockdown. Transgenic lines showed delayed senescence and enhanced carbon assimilation that, ultimately, increased the number of fruits and their total soluble solid content. Additionally, the fruit nutraceutical composition was enhanced. In conclusion, these data provide robust evidence that the manipulation of leaf senescence is an effective strategy for yield improvement in fleshy fruit-bearing species.
The ever-growing demand for food and biofuels has been a significant driving force behind studies focused on crop yield manipulation. As a complex trait, many strategies can lead to yield improvement, such as manipulation of morphogenetic patterns, source activity, source-to-sink communication, or sink activity (Rossi et al., 2015). Delaying senescence to extend leaf photosynthetic activity is considered one mechanism to strengthen source activity aiming to increase the net carbon availability for sink organs (Thomas and Ougham, 2014; Rossi et al., 2015). The expression of ISOPENTENYL TRANSFERASE, which encodes the enzyme responsible for the rate-limiting step in cytokinin biosynthesis, under the control of the SENESCENCE ASSOCIATED GENE12 (SAG12) promoter has been used extensively to delay leaf senescence (Gregersen et al., 2013). Once the expression is activated during senescence by the SAG12 promoter, the increment in cytokinin levels blocks senescence progression, thereby retaining photosynthetically active leaves. This approach has proven to successfully block or attenuate both age- and stress-related leaf senescence in different crop species like rice (Oryza sativa; Liu et al., 2010), cassava (Manihot esculenta; Zhang et al., 2010), wheat (Triticum aestivum; Sykorová et al., 2008), and tomato (Solanum lycopersicum; Swartzberg et al., 2006).
With the increase in knowledge about the genetic control of senescence, transcription factors (TFs), such as those belonging to the WRKY, MYB, and NAM/ATAF1/CUC2 (NAC) families, stand out as regulators of this process (Balazadeh et al., 2008). The extensive NAC family regulates a diversity of processes along plant development (Mitsuda et al., 2005; Olsen et al., 2005; Puranik et al., 2012). Particularly, the Arabidopsis (Arabidopsis thaliana) ORESARA1 gene (AtORE1) has received special attention for encoding a master regulator of senescence initiation (Oh et al., 1997; He et al., 2005; Kim et al., 2009, 2011; Balazadeh et al., 2010; Rauf et al., 2013), as the Atore1 mutant exhibits a delayed-senescence phenotype (Oh et al., 1997; Kim et al., 2009). Besides being induced by ethylene, salt, darkness, and abscisic acid (Kim et al., 2009, 2011; Balazadeh et al., 2010; Sakuraba et al., 2014; Song et al., 2014) AtORE1 is also posttranscriptionally regulated by the microRNA miR164 (Kim et al., 2009). AtORE1 not only induces senescence-related genes but also interacts physically with and inactivates the chloroplast maintenance-related TF GOLDEN2-LIKE (GLK), shifting the cell from a photosynthetically active program toward senescence (Rauf et al., 2013; Garapati et al., 2015). GLKs have been shown to control chloroplast development in several species, in which usually a pair of paralogs with functional redundancy occurs in the genomes of several species (Fitter et al., 2002; Waters et al., 2008, 2009b). In tomato, the paralogs exhibit organ specificity: while SlGLK1 is expressed mostly in vegetative organs, SlGLK2 is transcribed exclusively in the stylar portion of the fruits (Powell et al., 2012; Nguyen et al., 2014). Interestingly, the Slglk2 mutation, which was fixed in many cultivated varieties, negatively impacts fruit chloroplast differentiation; on the other hand, SlGLK2 overexpression increases fruit starch, soluble sugar, and carotenoid content (Powell et al., 2012).
Although tomato is a model plant for fleshy fruit physiology, its senescence regulatory network and impacts on fruit development and quality remain elusive. Here, putative AtORE1 orthologs, namely SlORE1S02, SlORE1S03, and SlORE1S06, were identified in the tomato genome. The genes were functionally characterized regarding their responsiveness to senescence-inducing treatments, regulation by SlmiR164, and capability to interact physically with SlGLKs and to complement the Atore1 mutant phenotype. Moreover, SlORE1S02 knockdown plants displayed delayed senescence, enhanced carbon assimilation, and altered source-sink sugar partitioning, leading to the development of more fruits with increased soluble sugar content. The results obtained provide robust evidence that the manipulation of leaf senescence is a promising strategy for yield improvement in fleshy fruit-bearing species.
RESULTS
The Tomato Genome Harbors Three Putative Senescence-Related AtORE1 Orthologs
To identify putative tomato AtORE1 orthologs, the protein sequences of all NAC TFs of tomato and Arabidopsis, retrieved from the Plant Transcription Factors Database (http://planttfdb.cbi.pku.edu.cn/), were aligned (Supplemental Table S1). The phylogenetic reconstruction (Supplemental Fig. S1) allowed the selection of three putative NAC domain-containing proteins (Supplemental Fig. S2), named SlORE1S02, SlORE1S03, and SlORE1S06, according to their chromosome localization (Fig. 1). Then, their responsiveness to senescence-inducing treatments was addressed.
Figure 1.

Phylogenetic representation of the NAC transcription factor subfamily that includes AtORE1 and SlORE1s. Shown is a detail of the phylogenetic reconstruction obtained from an alignment of the protein sequences of all NAC transcription factors of Arabidopsis (green) and tomato (red) obtained from the Plant Transcription Factor Database (Supplemental Table S1). Three putative AtORE1 orthologs (in boldface), named SlORE1S02, SlORE1S03, and SlORE1S06 according to their chromosome positions, were identified.
The transcript profiles of SlORE1S02, SlORE1S03, and SlORE1S06 were evaluated upon different in vitro treatments for senescence induction (i.e. treatment with ethylene, darkness, jasmonic acid, salicylic acid, or salt; Fig. 2). Confirming the induction and progression of senescence, all treatments triggered significant reductions in leaf chlorophyll content as well as the down- and up-regulation of SlGLK1 (the chloroplast maintenance-related TF) and SlSAG12 (the senescence-associated gene), respectively (Supplemental Fig. S3). The mRNA profiles of the three SlORE1s were modulated by the various treatments. While SlORE1S03 was induced in all cases, the level of SlORE1S02 mRNA increased upon the application of ethylene, salicylic acid, and salt solution, and SlORE1S06 was up-regulated by ethylene and darkness. Thus, although with differences, all three genes were transcriptionally activated by senescence-inducing stimuli.
Figure 2.
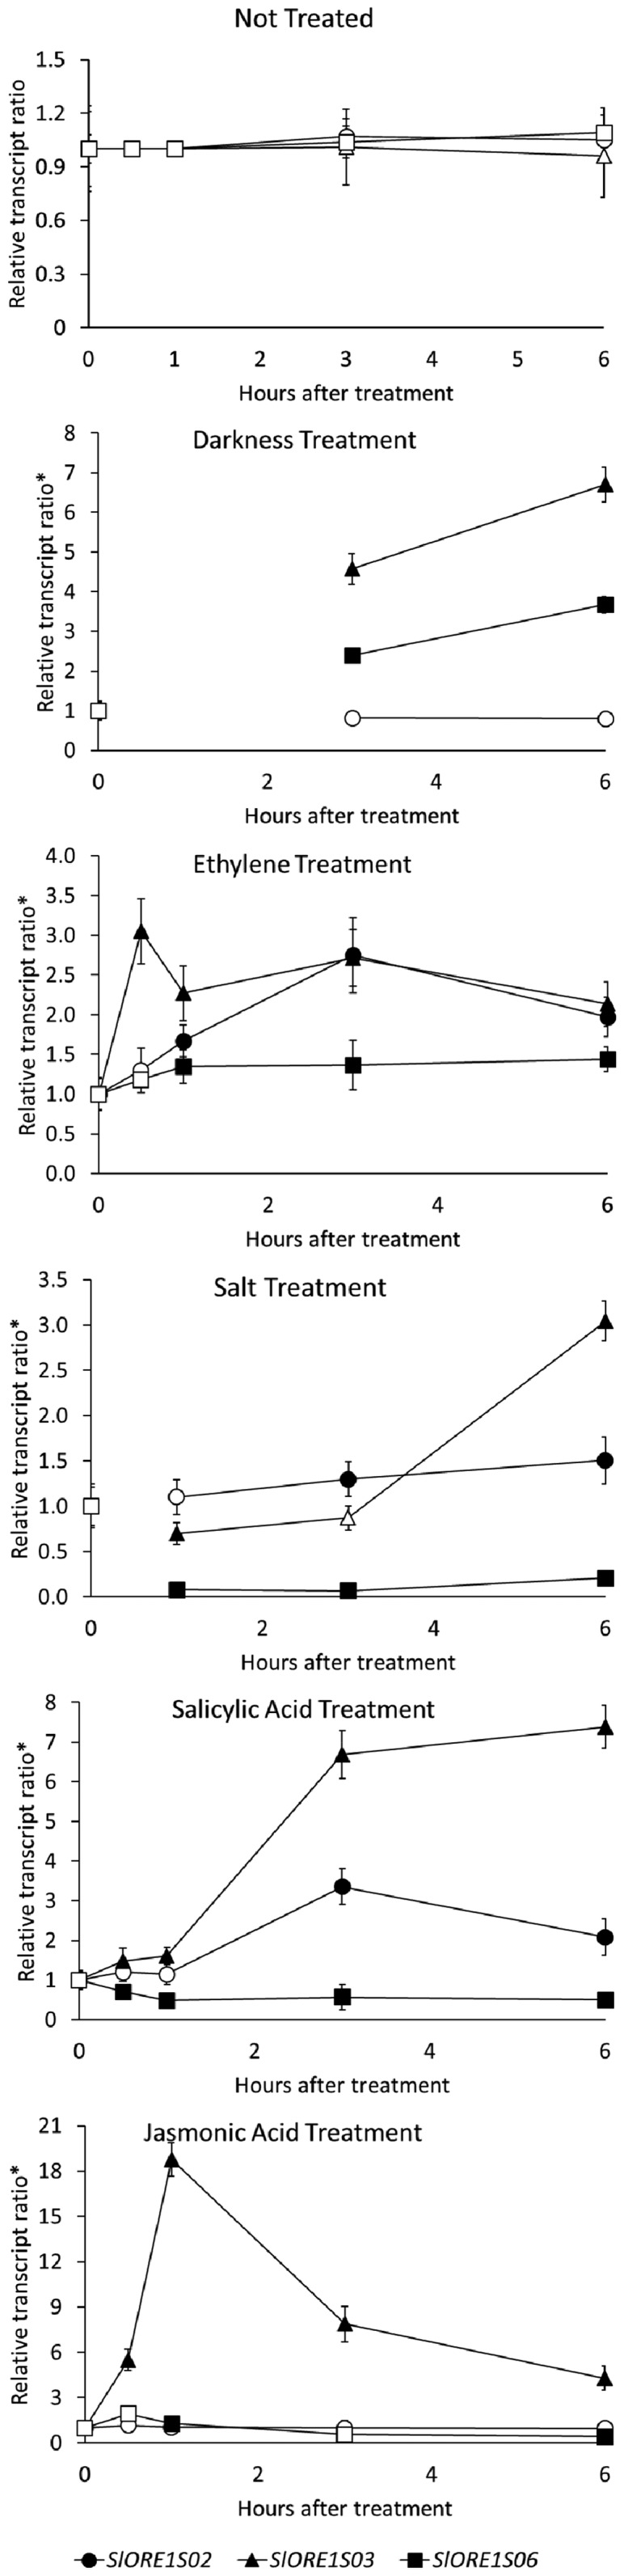
Transcript profiles of SlORE1s in response to senescence-inducing treatments. Transcript profiles are shown for SlORE1s in leaves of 4-week-old in vitro-grown plants after senescence-inducing treatments. Values represent means ± se from at least three biological replicates normalized against the 0-h sample. *, Each treatment relative transcript ratio is expressed as the ratio between the treatment value and the corresponding untreated control. Statistically significant differences relative to the 0-h treatment are represented with black symbols (P < 0.05).
The transcriptional profiles of SlORE1s during fruit development and ripening also were assessed (Fig. 3). For all three SlORE1s, the highest expression levels were identified at early immature stages and declined toward the ripe stage. Thus, although in leaves these genes were induced by ethylene, mRNA accumulation did not coincide with the ripening-associated climacteric peak of ethylene production typically observed at the breaker stage. This result indicates that, although a role in early fruit development cannot be ruled out, a direct function of SlORE1s along fruit ripening seems unlikely, as revealed by the expression pattern in this organ. Moreover, the data suggest an organ-specific ethylene-mediated regulation of SlORE1 genes.
Figure 3.

Transcript profiles of SlORE1s along fruit development and ripening. IG, Immature green stage; MG, mature green stage; BR, breaker stage; BRX, X days after breaker stage. Values represent means ± se from at least three biological replicates normalized to the corresponding IG3 sample. Statistically significant differences are represented with letters (P < 0.05).
SlORE1s Are Regulated by SlmiR164, and Their Encoded Proteins Interact Physically with SlGLKs and Partially Recover the Atore1 Phenotype
In silico analysis of the coding sequences revealed putative binding sites for SlmiR164 in all three SlORE1s. However, this site is disrupted by an insertion of 29 bp in SlORE1S02 (Fig. 4A). To ascertain if this insertion affects SlmiR164 recognition, a modified 5′ RACE was performed to detect cleaved transcripts using RNA extracted from nonsenescing leaves. This allowed the identification of SlmiR164-guided cleavage transcripts of SlORE1S03 and SlORE1S06 but not of SlORE1S02 (Fig. 4A).
Figure 4.

Regulation of SlORE1s by SlmiR164. A, Highlight of the alignment of SlORE1s and SlmiR164 showing the putative binding sites. Validation by a modified 5′ RACE assay identified cleaved transcripts of SlORE1S03 and SlORE1S06. The red arrowheads and the numbers on the right indicate the inferred cleavage sites and the fractions of positive cloned PCR products ending at the site, respectively. The shading threshold of alignment = 75%. B, Heat map representing the transcript profiles of nonsenescent (NS), early-senescing (ES), and late-senescing (LS) leaves of wild-type control (WT) and OEmiR164a (lines miR_2 and miR_3) genotypes. Values represent means of at least three biological replicates normalized against the nonsenescent wild-type sample. Statistically significant differences in comparison with the nonsenescent wild type are represented as colored squares (P < 0.05). The relative transcript values are detailed in Supplemental Table S2. C, Chlorophyll contents in NS, ES, and LS leaves. Values represent means ± se from at least three biological replicates. Asterisks denote statistically significant differences compared with the wild-type control (P < 0.05.) FW, Fresh weight.
To gain further knowledge about the role of SlmiR164 for SlORE1s regulation, the mRNAs of the three genes were profiled in transgenic lines harboring a 35S:AtMIR164a construct (abbreviated as OEmiR164a) in nonsenescent, early-senescing, and late-senescing leaves (Fig. 4B). The mRNA patterns of SlGLK1 and SlSAG12 also were assessed as senescence markers. In wild-type plants, leaf senescence was accompanied by a progressive down-regulation in SlmiR164 and SlGLK1 and up-regulation of SlSAG12, SlORE1S02, SlORE1S03, and SlORE1S06. As expected, OEmiR164a lines displayed high levels of SlmiR164 in both nonsenescent and senescent leaf stages. As a result, a lag in SlGLK1 decrease and SlSAG12 accumulation, together with the increased chlorophyll levels, were indicative of delayed senescence initiation (Fig. 4C). The marked reductions of SlORE1S03 and SlORE1S06 mRNA levels observed in OEmiR164a lines are in agreement with both being regulated directly by SlmiR164. Interestingly, the levels of SlORE1S02 in nonsenescent and senescing leaves were the same as those observed in nonsenescent wild-type leaves, meaning that the maintenance of high levels of SlmiR164 prevented the senescence-associated induction of this gene. Although SlmiR164 is not capable of cleaving SlORE1S02 transcripts, it regulates it by targeting a currently unknown factor that, in turn, drives the senescence-associated mRNA accumulation of this gene. Thus, SlmiR164 directly controls the transcript levels of SlORE1S03 and SlORE1S06 and indirectly regulates the transcript abundance of SlORE1S02, which is in line with the known transcriptional regulation of AtORE1 by AtmiR164 (Kim et al., 2009).
Moreover, AtORE1 is known to interact physically with AtGLKs in the nucleus, preventing the activity of these chloroplast maintenance TFs (Rauf et al., 2013). Then, it was first addressed whether SlORE1s and SlGLKs are nucleus-targeted proteins. Confocal analysis of tobacco (Nicotiana tabacum) leaves transiently expressing TF-GFP fusion proteins revealed that SlORE1S02, SlORE1S03, SlORE1S06, SlGLK1, and SlGLK2 were localized in the nucleus, as the GFP fluorescence in all cases colocalized with the fluorescence of the 4',6-diamidino-2-phenylindole (DAPI) marker (Supplemental Fig. S4). For the latter, the result confirmed that previously reported in tomato protoplasts by Tang et al. (2015). Next, bimolecular fluorescence complementation (BiFC) was used to test the physical interaction. The C-terminal ends of SlORE1s and SlGLKs were fused to the N-terminal (VYNE) and C-terminal (VYCE) ends of the Venus YPF protein, respectively (Fig. 5). The interaction between AtORE1 and AtGLK2 was used as a positive control. In all interactions tested, fluorescence was detected in the nucleus; thus, all SlORE1s interact physically with both SlGLKs. Of note, a strong fluorescence signal was observed in the nucleolus in all SlORE1-SlGLK interactions and also for AtORE1 and AtGLK2.
Figure 5.

Analysis of SlGLK and SlORE1 protein-protein interactions by BiFC. VYNE and VYCE fusion proteins were transiently expressed in tobacco leaves by infiltration with A. tumefaciens. VYNE-Cnx6/VYCE-Cnx6 and AtORE1/AtGLK2 (Gehl et al., 2009) were used as technical and biological positive controls, respectively. VYNE-Cnx6/SlGLK2-VYCE and VYCE-Cnx6/SlORE1S02-VYNE interactions were used as negative controls. SlORE-SlGLK interaction was confirmed as evidenced by the YFP fluorescence detected. YFP, DAPI nuclear marker, bright-field, and merged signals are indicated above the columns. Bars = 20 μm, except in VYNE-Cnx6/VYCE-Cnx6 images, where bars = 40 μm.
It has been suggested that the ubiquitin-proteasome system may be active in the nucleolus, where ubiquitin and proteasome were immunolocalized (Stępiński, 2012). In addition, this compartment provides a site for the transient inactivation of enzymatic or regulatory proteins (Stępiński, 2014). As SlGLK2 was shown to be degraded by the ubiquitin-proteasome system (Tang et al., 2015), one may speculate that the ORE1-GLK complex is transferred to the nucleolus, where GLKs are inactivated by ubiquitination and subsequently degraded.
These results show similarities between SlORE1s and AtORE1 regulation. To address whether SlORE1s were able to recover the Atore1 delayed-senescence phenotype, each SlORE1 was constitutively overexpressed in the Arabidopsis mutant background: Atore1-OE:SlORE1S02, Atore1-OE:SlORE1S03, and Atore1-OE:SlORE1S06. In line with AtORE1 overexpression in the Columbia-0 (Col-0) background (Rauf et al., 2013), no visible phenotype was observed in young plants. Dark-induced senescence was assayed in detached leaves. After 7 d, while Atore1 leaves remained green, the leaves overexpressing any of the SlORE1s acquired a yellowish tone indicative of ongoing senescence, but not to the same extent as the Col-0 genotype (Fig. 6). Thus, all three SlORE1s were able to partially recover the senescence delay in the Atore1 mutant.
Figure 6.

SlORE1s partially recover Atore1 senescence impairment. Detached leaves from 3-month-old Col-0, Atore1 mutant, Atore1-OE:SlORE1S02, Atore1-OE:SlORE1S03, and Atore1-OE:SlORE1S06 plants were kept in darkness for 7 d to induce senescence. While Atore1 displayed no signs of senescence, the yellowish color of the genotypes overexpressing SlORE1s hints at an ongoing senescence program, yet not to the extent observed in the Col-0 genotype. Bar = 1 cm.
SlORE1S02 Knockdown in Tomato Increases Photosynthesis and Delays Dark-Induced Senescence
Among the three SlORE1s, SlORE1S02 was chosen for stable RNA interference (RNAi) knockdown, as this is the closest ortholog to AtORE1 in the phylogenetic reconstruction, its transcript levels are highly modulated along senescence and indirectly regulated by SlmiR164, and the encoded protein interacts physically with SlGLKs and partially complements the Atore1 mutant. Five tomato transgenic lines were obtained, and three lines displaying over 70% silencing (Supplemental Fig. S5), namely L1, L3, and L6, were chosen for further phenotyping.
Interestingly, SlORE1S03 and SlORE1S06 also were reduced in leaves of SlORE1S02 knockdown lines, but not to the same extent as SlORE1S02. Since there is an extremely low degree of similarity among the RNAi target region of SlORE1S02 and the coding sequences of SlORE1S03 and SlORE1S06, the possibility of cross silencing can be ruled out. Instead, it is likely that SlORE1S02 is an upstream positive regulator of SlORE1S03 and SlORE1S06 (Supplemental Fig. S6).
Gas-exchange and chlorophyll fluorescence parameters were measured by using an infrared gas analyzer at two development stages of the plant: (1) before the beginning of the flowering stage, in the fifth leaf of 70-d-old plants (referred to as young plant leaves [YPL]); and (2) in the fruit-bearing stage, in the sixth leaf of 120-d-old plants (referred to as mature plant leaves [MPL]). No differences were found in photosynthetic parameters in YPL. However, MPL from SlORE1S02 knockdown plants showed increased carbon assimilation in comparison with the untransformed control genotype (cv Micro Tom [MT]), while all other measured parameters remained unaltered (Table I).
Table I. Photosynthetic parameters of SlORE1S02 knockdown lines.
| Genotype | Leaf Type | CO2 Assimilation | Electron Transport Rate | Photochemical Quenching | Nonphotochemical Quenching |
|---|---|---|---|---|---|
| μmol CO2 m−2 s−1 | μmol m−2 s−1 | ||||
| MT | YPL | 4.31 ± 0.21 | 65.80 ± 3.16 | 0.28 ± 0.01 | 1.69 ± 0.21 |
| MPL | 3.92 ± 0.15 | 35.93 ± 3.90 | 0.18 ± 0.02 | 2.18 ± 0.21 | |
| L1 | YPL | 4.63 ± 0.64 | 75.51 ± 7.47 | 0.30 ± 0.03 | 1.57 ± 0.12 |
| MPL | 5.93 ± 0.84 | 49.91 ± 4.38 | 0.24 ± 0.02 | 2.13 ± 0.04 | |
| L3 | YPL | 8.55 ± 0.95 | 70.13 ± 6.71 | 0.31 ± 0.03 | 2.23 ± 0.34 |
| MPL | 5.28 ± 0.46 | 41.63 ± 1.34 | 0.21 ± 0.01 | 2.28 ± 0.19 | |
| L6 | YPL | 3.97 ± 0.46 | 66.31 ± 4.47 | 0.31 ± 0.02 | 1.87 ± 0.15 |
| MPL | 5.57 ± 0.08 | 38.68 ± 2.98 | 0.21 ± 0.01 | 1.76 ± 0.18 |
Values represent means ± sd of at least three biological replicates. Statistically significant differences compared with the MT control are shown in boldface.
Chlorophyll levels in YPL and MPL were higher in transgenic plants than in equivalent leaves of the MT genotype (Fig. 7A). Whereas, at MPL stage, the density of chloroplasts per mesophyll cell was slightly higher in transgenic lines (Fig. 7B), the ultrastructure of this organelle was not affected by the down-regulation of SlORE1S02 (Supplemental Fig. S7). Accordingly, SlGLK1 mRNA levels were higher in both YPL and MPL of transgenic plants (Fig. 7C). Interestingly, while the senescence marker SlSAG12 was undetectable in YPL, lower levels were detected in transgenic MPL compared with the corresponding MT control (Fig. 7C). Together, these results suggest a delay in senescence in SlORE1S02 knockdown plants. To further corroborate this hypothesis, the eighth leaf of 120-d-old plants was detached and kept in the dark for 10 d. While MT leaves turned yellowish, transgenic ones kept greenness, supporting the conclusion that SlORE1S02 deficiency delays senescence (Fig. 7D).
Figure 7.

SlORE1S02 knockdown affects leaf aging. A, Chlorophyll content in leaves. Values represent means ± se from at least three biological replicates. Asterisks denote statistically significant differences compared with the MT control (P < 0.05). FW, Fresh weight. B, Number of chloroplasts per mesophyll cell of MPL. Values represent means ± se from at least 45 cells. Asterisks denote statistically significant differences compared with the MT control (P < 0.05). C, SlGLK1 and SlSAG12 transcript ratios in YPL and MPL leaves. Values represent means ± se from at least three biological replicates normalized against the respective sample from the MT control. Asterisks denote statistically significant differences compared with the MT control (P < 0.05). The relative transcript values are available in Supplemental Table S4. D, SlORE1S02 knockdown effects on dark-induced senescence in tomato leaves. Detached leaflets from 120-d-old plants kept 10 d in darkness retained greenness, while MT control leaflets turned yellow. Bar = 5 cm.
SlORE1S02 Knockdown in Tomato Increases Yield and brix
As transgenic plants assimilate carbon for an extended period of time, the impact of SlORE1S02 knockdown over yield was evaluated. Transgenic plants produced more fruits than MT control plants, rendering a significant increase in harvest index (HI), as no difference was detected in aerial shoot mass (Fig. 8A). The transgenic fruits showed no alteration in shape, weight, and diameter (Supplemental Fig. S8). Besides, SlORE1S02 knockdown lines showed higher levels of soluble solids in ripe fruits, as reflected by the increment in brix units (Fig. 8B), which also is an important trait in tomato, especially for industrial processing.
Figure 8.

SlORE1S02 knockdown increases yield and brix. A, HI, aerial part weight, and ripe fruit number in MT and SlORE1S02 knockdown lines. Values represent means ± se from at least six biological replicates. Asterisks denote statistically significant differences compared with the MT control genotype (P < 0.05). B, Total soluble solids of ripe fruits measured in brix units. Values represent means ± se from at least 12 biological replicates. Asterisks denote statistically significant differences compared with the MT control genotype (P < 0.05).
Enhanced HI and brix are typically due to increased levels of Glc, Fru, and Suc and are indicative of altered carbohydrate metabolism. Thus, the content of starch and soluble sugars in leaves and fruits was determined (Fig. 9). The fruits of transgenic plants showed an increased content of Glc in all analyzed stages and of Fru in both ripening stages, which explains the increment in brix units. Moreover, the starch content in mature green and breaker fruits of SlORE1S02 knockdown lines also was higher when compared with the MT control. As expected, 6 d after the breaker stage, starch was totally degraded in all genotypes. In leaves, while YPL of transgenic plants accumulated higher starch and Suc levels than the MT control genotype when fruits were developing, in the MPL, the allocation of fixed carbon as starch diminished, whereas Suc still accumulated at higher levels. The up-regulation in the leaf carbohydrate levels triggered by SlORE1S02 knockdown is consistent with the above-mentioned increase in carbon assimilation observed in the transgenic lines. Moreover, considering that, in tomato, carbon is mostly translocated as Suc (Barker et al., 2000), this carbohydrate pattern suggests an enhanced carbon export from leaves toward sink organs in SlORE102-deficient plants.
Figure 9.

SlORE1S02 knockdown alters the sugar profile in leaves and fruits. The contents of starch and soluble sugars in leaves and fruits of SlORE1S02 knockdown lines are shown. Values represent means ± se from at least three biological replicates. Asterisks denote statistically significant differences compared with the MT control genotype (P < 0.05). BR, Breaker stage; BR6, 6 d after breaker stage; DW, dry weight; FW, fresh weight; MG, mature green stage; ND, not detected.
Isoprenoid Metabolism Is Affected by SlORE1S02 Knockdown Tomato Plants
It was shown that lowering SlORE102 transcript abundance affects chlorophyll accumulation and carbon assimilation and partitioning. To better understand the origin of these metabolic alterations and their impact of fruit chemical composition, isoprenoid-derived compounds (i.e. chlorophyll, tocopherols, and carotenoids; Supplemental Table S3) were quantified and the mRNA levels of chlorophyll, tocopherol, and carotenoid metabolism-associated genes were profiled (Fig. 10; Supplemental Table S4). The analyzed genes were those shown to be transcriptionally regulated key points of the biosynthetic pathways (Quadrana et al., 2013; Almeida et al., 2015, 2016). The transcript abundance of those paralogs that, based on previous reports, were not involved directly in the analyzed pathways in the sampled organs was not addressed. This is the case of PHEOPHYTINASE-LIKE1 (SlPPHL2) and SlPPHL3, which are extremely low expressed (Lira et al., 2016) and, different from SlPPHL1, are not functionally characterized (Lin et al., 2016); PHYTOENE SYNTHASE3 (SlPSY3) is involved in root carotenogenesis (Liu et al., 2015); and SlLCYβ2 (Solyc10g079480) and GERANYLGERANYL DIPHOSPHATE REDUCTASEs (SlGGDR1; Solyc01g088310) are poorly expressed in the analyzed organs (transcriptional data available at the TomExpress database; http://gbf.toulouse.inra.fr/tomexpress/).
Figure 10.

Isoprenoid metabolism. Schematic representation shows the interconnection between chlorophyll synthesis and degradation (green), carotenogenesis (orange), and tocopherol biosynthetic (blue) pathways. Dotted lines denote that intermediate steps were omitted. The heat map represents statistically significant differences in relative transcript and metabolite amounts detected in SlORE1S02 knockdown lines compared with the corresponding organ of the MT control genotype (P < 0.05). For simplicity, the mean of three transgenic line values is represented when at least two were statistically significant different compared with the MT control. The absolute metabolite and relative transcript values are detailed in Supplemental Tables S3 and S4. Black and gray colors indicate that transcripts were not detected or not addressed, respectively. Enzymes and compounds are named according to the following abbreviations: CHLG, chlorophyll synthase; CYCβ, chromoplast-specific β-lycopene cyclase; GGDP, geranylgeranyl diphosphate; GGDR, geranylgeranyl diphosphate reductase; LCYβ, chloroplast-specific β-lycopene cyclase; MEP, methylerythritol 4-phosphate; MPBQ, 2-methyl-6-geranylgeranylbenzoquinol; PDP, phytyl diphosphate; PDS, phytoene desaturase; pFCC, primary fluorescent chlorophyll catabolite; PP, phytyl phosphate; PPH, pheophytinase; PPHL1, pheophytinase-like1; PSY, phytoene synthase; VTE1, tocopherol cyclase; VTE2, homogentisate phytyl transferase; VTE3, 2,3-dimethyl-5-phytylquinol methyltransferase; VTE4, tocopherol C-methyl transferase; VTE5, phytol kinase; VTE6, phytyl phosphate kinase. Adapted from Almeida et al. (2016).
In MPL of SlORE1S02 knockdown plants, chlorophyll recycling/biosynthesis was enhanced, as evidenced by the increase in CHLOROPHYLL SYNTHASE (SlCHLG), SlPPHL1, and PHYTOL KINASE (SlVTE5) transcript abundance. Although the mRNA levels of SlPSY1 and PHYTOENE DESATURASE were increased in YPL, no differences were found in leaf carotenoid contents, except for a slight reduction in lutein from MPL. Regarding tocopherol synthesis, YPL showed similar levels of tocopherol in both genotypes, which is in line with the expression of the enzyme-encoding genes that supply PDP precursors, such as SlGGDR, SlVTE5, and SlVTE6. However, in SlORE1S02 knockdown MPL, due to chlorophyll biosynthesis enhancement, PDP availability for tocopherol synthesis is reduced compared with the MT control, resulting in reduced levels of this compound. It is worth mentioning that the most abundant form of vitamin E is α-tocopherol, which perfectly correlates with the amount of total tocopherol (Supplemental Table S3). Apparently, the maintenance of a highly active photosynthetic apparatus in MPL requires lower amounts of antioxidant tocopherol compounds.
The impact of SlORE102 knockdown on the fruit isoprenoid profile was distinct from those observed in leaves. There was no difference in fruit chlorophyll content between transgenic and control plants. Similarly, carotenoid metabolism remained almost unaffected, displaying punctual reductions in neurosporene and lutein contents in mature green and breaker 1 fruits, respectively. Tocopherols were more abundant in SlORE1S02 knockdown than in control fruits, which is in accordance with the transcript levels of SlGGDR, SlVTE6, HOMOGENTISATE PHYTYL TRANSFERASE (SlVTE2), 2,3-DIMETHYL-5-PHYTYLQUINOL METHYLTRANSFERASE [SlVTE3(1)], TOCOPHEROL CYCLASE (SlVTE1), and TOCOPHEROL C-METHYL TRANSFERASE (SlVTE4). Therefore, SlORE1S02 knockdown plants showed organ-specific regulation of isoprenoid metabolism.
DISCUSSION
The leaves are the major photosynthetic organs, and the net carbon fixed during the photosynthetic period is critical for a plant’s fitness and sink organ development (Wu et al., 2012). Thus, the source-sink relationship is tightly linked to leaf lifespan and, consequently, affected by the fine control of senescence. In this regard, a straightforward approach to increase yield is to extend the photosynthetic function phase. This has been achieved in grasses by silencing NAC TF-encoding genes. Although an increase in grain yield was observed due to extended grain-filling time, seed quality was compromised by reduced nutrient remobilization (Waters et al., 2009a; Liang et al., 2014). Yet, the impact of delayed senescence remains poorly explored in nonmonocarpic species that do not undergo whole-plant senescence after the reproductive phase (Thomas, 2013).
To gain insight on how fleshy fruit development and yield can be affected by altering leaf senescence, the senescence master regulator ORE1 was targeted in tomato. Three putative orthologs were identified in the tomato genome, namely SlORE1S02, SlORE1S03, and SlORE1S06. As all were induced by senescence-inducing treatments, regulated by SlmiR164, able to interact physically with SlGLKs, and capable of rescuing the Atore1 mutant, SlORE1S02, the phylogenetically closest gene to AtORE1, was chosen for knockdown by RNAi.
The reduction in the amount of SlORE1S02 transcripts affected the metabolism of source leaves, both of young and mature plants. The increase in chlorophyll content and the expression of the SlGLK1 TF, together with the increment in carbon assimilation and the reduced SlSAG12 mRNA levels in leaves of mature plants, hint that senescence is delayed in transgenic plants. This was corroborated by the dark induction senescence assay on detached leaves. The aforementioned phenotype in leaves from the SlORE1S02-deficient plants might be explained, at least in part, because GLK TFs are known to coordinate the expression of genes related to chlorophyll synthesis (e.g. PROTOCHLOROPHYLLIDE OXIDOREDUCTASE) and the photosynthetic machinery (e.g. light-harvesting complex proteins), leading to proper chloroplast differentiation and maintenance (Waters et al., 2009b; Nguyen et al., 2014). This is in agreement with the increased chloroplast number in mesophyll cells of mature leaves. Additionally, higher levels of SlCHLG transcript, whose encoded protein is a key enzyme for chlorophyll biosynthesis and also regulates the synthesis of chlorophyll-binding proteins (Shalygo et al., 2009), contributes to the extended photosynthetic active period in transgenic plants.
Tocopherol metabolism also was affected in leaves of SlORE1S02 knockdown plants. Like chlorophyll, tocopherols are isoprenoid-derived compounds that play a main role in protecting the photosynthetic machinery by either quenching singlet oxygen or inhibiting the progression of lipid peroxidation (Havaux et al., 2005). It has been demonstrated that the recycling of chlorophyll degradation-derived phytol is the main source of the tocopherol side chain in tomato (Almeida et al., 2015). In agreement with this, the delayed senescence progression proposed above for SlORE1S02 knockdown plants explains the reduction in tocopherol content measured in leaves from mature plants. In this sense, it has been suggested that increasing tocopherol content along senescence contributes to the proper dismantling and recycling of plastid thylakoid lipids (Chrost et al., 1999). Additionally, the boost in chlorophyll turnover, evidenced by the increment in mRNA abundance of SlPPHL1 (Lin et al., 2016), SlVTE5 (Almeida et al., 2016), and SlCHLG, driving PDP toward chlorophyll synthesis, further supports this statement.
The delayed senescence progression also was reflected in both leaf and fruit sugar composition. During the vegetative phase, before the onset of flower anthesis, while the fifth leaves from control young plants were the main source of assimilates for sink organs, in SlORE1S02-deficient plants, these leaves retained higher levels of fixed carbon mainly as starch, as older leaves retained high photosynthetic activity. As fruits began to develop, the starch was remobilized to Suc and reallocated to these organs. The boosted carbon exportation in SlORE1S02 knockdown plants increased yield as a result of the increment in fruit number. Interestingly, the fruits developed slightly faster than the control genotype, as the number of days to reach the breaker stage was reduced (Supplemental Fig. S9A). Additionally, breaker 1 and breaker 6 fruits, but not mature green fruits, were enriched in total soluble protein content, which might indicate that SlORE1S02 knockdown affects protein degradation during the chloroplast-chromoplast transition (Supplemental Fig. S9B).
Regarding fruit nutritional quality, SlGGDR mRNA accumulated to higher levels in transgenic fruits during ripening, increasing PDP availability for tocopherol synthesis. Moreover, in the SlORE1S02 knockdown genotype, the tocopherol biosynthesis-related genes were up-regulated along fruit ripening, contributing to the increment of this nutraceutical.
Altogether, the metabolic alterations indicate that SlORE1S02 deficiency delays aging by means of extending chloroplast maintenance and carbon assimilation. Consequently, photoassimilate exportation toward fruits is enhanced, ultimately improving HI and the contents of tocopherol antioxidant and soluble sugars in ripe fruits. Thus, the data obtained suggest that the manipulation of leaf senescence is a promising strategy to improve fleshy fruit yield and metabolism.
MATERIALS AND METHODS
Plant Material, Growth Conditions, and Sampling
In vitro treatments for senescence induction were performed with wild-type tomato (Solanum lycopersicum ‘Micro Tom’) harboring the wild-type allele SlGLK2. Tomato seeds were surface sterilized, sown, and cultivated in vitro as described by Lira et al. (2014). Four-week-old plants had senescence induced by the application of ethylene (gaseous to a final concentration of 5 m L−1), jasmonic acid (gaseous to a final concentration of 30 µm), salicylic acid (liquid solution to a final concentration of 30 µm), or salt (liquid NaCl solution to a final concentration of 300 mm) or kept in darkness. Leaf samples were collected 30 min, 1 h, 3 h, 6 h, and 48 h after treatment.
For SlORE1 fruit transcriptional profiling, tomato plants were grown in 1-L pots in a greenhouse under automatic irrigation in an average mean temperature of 25°C, 11.5/13 (winter/summer) light hours, and 250 to 350 μmol m−2 s−1 incident photoirradiance. The pericarp from the top portion of the fruit was sampled at immature green 3, immature green 5, mature green, breaker, breaker + 3, and breaker + 5 stages and was harvested at approximately 10, 22, 37 (displaying jelly placenta), 42 (when the first signals of carotenoid accumulation are visualized), 45, and 48 d after anthesis, respectively. All samples were frozen in liquid N2, powdered, and stored at −80°C.
The transgenic lines overexpressing AtMiR164a (miR_2 and miR_3) were generated via a 176-bp fragment encompassing the AtMIR164a precursor (MIR164aAt2g47585) that was amplified from genomic DNA of Arabidopsis (Arabidopsis thaliana) ecotype Col-0. The PCR product was subcloned into TOPO TA (Invitrogen; http://www.lifetechnologies.com) and sequenced. The confirmed AtMIR164a precursor was digested using the XbaI and PstI restriction enzymes and subsequently cloned into binary vector under the control of the cauliflower mosaic virus (CaMV) 35S promoter. Once cleaved, the mature AtMIR164a has the exact sequence of the mature SlmiR164 (accession numbers for miRbase [http://www.mirbase.org/]: AtMIR164, MI0000197; SlmiR164, MI0027570). The genetic transformation was made in the Slglk2 MT background according to Pino et al. (2010). T2 plants were grown as described above, and nonsenescent, early-senescing, and late-senescing leaves were collected. Leaf stages were set according to the untransformed genotype yellowish phenotype.
For subcellular localization and BiFC assays, tobacco (Nicotiana tabacum) plants were cultivated for 4 weeks in 1-L pots as described above.
To evaluate the capability of SlORE1S02, SlORE1S03, and SlORE1S06 to recover the Atore1 mutant phenotype, this mutant was independently transformed with the three tomato gene coding sequences under the control of the constitutive cauliflower mosaic virus 35S promoter. Arabidopsis plants were grown and transformed according to Balazadeh et al. (2010). Plants from three independent lines of the T2 generation were used for dark-induced senescence assay. A pool of 10 detached leaves from 3-month-old plants for each genotype was kept in darkness for 7 d.
SlORE1S02 knockdown lines (L1, L3, and L6) were generated by constitutively expressing an intron-spliced hairpin RNA (RNAi) construct of 186 bp targeted to SlORE1S02 (Solyc02g088180). The fragment was cloned into pK7GWIWG2(I) (Karimi et al., 2002) and introduced into the wild-type MT background, which harbors the wild-type SlGLK2 allele, following the protocol described by Pino et al. (2010). Gas-exchange and chlorophyll fluorescence parameters were measured in the fifth leaf of 70-d-old plants (YPL) and in the sixth leaf of 120-d-old plants (MPL) between 10 and 12 h and were harvested subsequently for biochemical analyses and transcriptional profiling. T1 plants were grown as described above. Pericarp samples from fruits at mature green, breaker 1, and breaker 6 stages were harvested. For tocopherol content determination, leaf and pericarp samples were dried by lyophilization before extraction. For yield evaluation, an independent set of plants without any destructive sampling was cultivated, and all ripe fruits were sampled and weighed until the plants reached 160 d old, when destructive harvest took place. At harvest time, the aerial part was weighed and HI was calculated according to the formula HI = (total ripe fruit mass) × 100/(aerial part mass + total ripe fruit mass). brix was measured in ripe fruits with a DR201-95 refractometer (Kruss).
Phylogenetic Analysis
For the phylogenetic analysis, all NAC TFs of tomato and Arabidopsis (Supplemental Table S1) were retrieved from the Plant Transcription Factors Database (http://planttfdb.cbi.pku.edu.cn/). The retrieved protein sequences were aligned by Clustal in MEGA 6.0 software (Tamura et al., 2013) using default parameters. The tree reconstruction from the obtained alignment was performed using the PHYML 3.0 algorithm (Guindon et al., 2010) hosted at http://www.hiv.lanl.gov/content/sequence/PHYML/interface.html with the following parameters: LG substitution model, four substitution rate categories, tree optimization by topology and branch length, and improvement by subtree pruning and regrafting. From the data set, the proportion of invariable sites, equilibrium of frequencies, and gamma shape parameter were estimated. Branches were supported by SH-like (Shimodaira–Hasegawa) support.
Quantitative PCR and MicroRNA Analysis
RNA extraction, cDNA synthesis, primer design, and quantitative PCR assays were performed as described by Quadrana et al. (2013). Primer sequences used are detailed in Supplemental Table S5. Stem loop pulse reverse transcription was performed as described previously by Varkonyi-Gasic et al. (2007), and modified 5′ RACE was performed as described by Morea et al. (2016). Quantitative PCR was carried out in the QuantStudio 6 Flex Real-Time PCR system (Applied Biosystems) using 2X Power SYBR Green Master Mix reagent (Life Technologies) in a 14-µL final volume. Absolute fluorescence data were analyzed using the LinRegPCR software package (Ruijter et al., 2009) in order to obtain quantitation cycle values and calculate PCR efficiency. Expression values were normalized against the geometric mean of two reference genes, TIP41 and EXPRESSED, according to Quadrana et al. (2013). A permutation test lacking sample distribution assumptions (Pfaffl et al., 2002) was applied to detect statistical differences (P < 0.05) in expression ratios using the algorithms in the fgStatistics software package version 17/05/2012 (Di Rienzo 2009).
Subcellular Localization and BiFC Assay
The full-length open reading frames encoding AtORE1 (AT5G39610), AtGLK2 (AT5G44190), SlGLKs, and SlORE1s were amplified using specific primers listed in Supplemental Table S5 and cloned into pCR8/GW/TOPO TA cloning vector (Invitrogen). For the subcellular localization experiment, each recombination cassette was amplified using the universal M13 pair of primers and then recombined into the binary vector pK7FWG2 (Karimi et al., 2002) using LR Clonase. For the BiFC assay, each entry vector was recombined into the binary vector pDEST-VYCE(R)GW or pDEST-VYNE(R)GW (Gehl et al., 2009), which carry the C-terminal or N-terminal fragment of Venus YFP, respectively, using LR Clonase. All BiFC fusion proteins were tagged at the C terminus. The binary vectors were introduced in Agrobacterium tumefaciens strain GV3101. For subcellular localization, cultures were resuspended in infiltration buffer (50 mm MES, pH 5.6, 2 mm sodium phosphate buffer, pH 7, 0.5% [w/v] Glc, and 200 µm acetosyringone [Sigma-Aldrich]) to a final OD600 of 0.5, incubated for 3 h in the dark at room temperature, and infiltrated into leaves of 4-week-old tobacco plants. For BiFC experiments, leaves were coinfiltrated with a mix of both cultures at 0.5 OD600. To avoid SlGLK degradation, 100 μm of the proteasome inhibitor MG132 (Sigma-Aldrich; C2211) was added to the solution before infiltrating. After 48 or 72 h for localization and BiFC experiments, respectively, the transformed tissues were observed in a confocal laser microscope (Zeiss LSM 780-NLO). DAPI staining was performed by infiltrating 10 µg mL−1 water-dissolved DAPI (Life Technologies; D1306) 20 min before the confocal microscope observation. GFP signal was captured over a 508- to 553-nm range after excitation at 488 nm, while DAPI fluorescence was excited at 405 nm and captured over a 415- to 501-nm range.
The control VYNE-Cnx6 and VYCE-Cnx6 constructs were provided by Jörg Kudla (Institute of Plant Biology and Biotechnology). CNX6 is a protein that belongs to the complex of molybdopterin synthase involved in MoCo biosynthesis. As reported by Gehl et al. (2009), when VYNE-Cnx6 and VYCE-Cnx6 fusion proteins (approximately 40 kD) are transiently coexpressed in Nicotiana benthamiana leaves by agroinfiltration, they localize not only in the cytoplasm but also in the nucleus. This is due to their small size, which allows diffusion through the nuclear pores, whose exclusion size is 60 kD. Thus, Cnx6 autodimerization was used as a positive control, while VYNE-Cnx6/SlGLK2-VYCE and VYCE-Cnx6/SlORE1S02-VYNE interactions were used as negative controls.
Leaf Gas-Exchange and Fluorescence Measurements
Gas-exchange and chlorophyll fluorescence parameters were measured using a portable open gas-exchange system incorporating infrared CO2 and water vapor analyzers (LI-6400XT system; LI-COR) equipped with an integrated modulated chlorophyll fluorometer (LI-6400-40; LI-COR). The reference CO2 concentration was held at 400 µmol mol−1 and leaf temperature at 28°C for all measurements. Air humidity inside the leaf chamber was equivalent to values measured inside the greenhouse (approximately 75%). Carbon assimilation rate, leaf stomatal conductance, transpiration, and fluorescence parameters were measured at a photosynthetic photon flux density of 800 µmol m−2 s−1. For the values of minimal and maximal fluorescence and leaf dark respiration, leaves were dark adapted for 30 min before a saturating pulse of light. The parameters derived from chlorophyll fluorescence, including dark-adapted PSII maximum quantum efficiency, proportion of open PSII centers (photochemical quenching), PSII operating efficiency, nonphotochemical quenching, and electron transport rate, were calculated according to Maxwell and Johnson (2000).
Chloroplast Number
Chloroplasts in leaf mesophyll cells were counted following the methodology described by Pyke (2011). Briefly, leaf pieces were fixed in 3.5% (v/v) glutaraldehyde solution for 1 h, then calcium ions were chelated by transferring the leaf samples to 0.1 m NaEDTA solution and keeping them for 4 h at 60°C and then overnight at 4°C. The pieces were transferred to a microscope slide and macerated with a blunt scalpel for tissue disintegration and then visualized by light microscopy.
Transmission Electron Microscopy
Leaf segments were fixed at 4°C in Karnovsky’s solution (2.5% [v/v] glutaraldehyde and 2% [v/v] paraformaldehyde in 0.1 m sodium phosphate buffer, pH 7.2) for 24 h. After washing in buffer, the samples were postfixed in buffered 1% (w/v) osmium tetroxide, washed, dehydrated in a graded series of acetone, and embedded in Spurr’s resin. The resin was polymerized at 60°C. Ultrathin sections were stained with saturated uranyl acetate (Watson, 1958) and lead citrate (Reynolds, 1963) and observed using a Zeiss EM 900 transmission electron microscope.
Total Soluble Protein, Starch, and Soluble Sugar Quantification
Total soluble protein extraction and quantification were performed as described by Jones et al. (1989). Starch and soluble sugar extractions were performed as described by Lira et al. (2014). Soluble sugar quantification was performed according to Mainardi et al. (2006). Briefly, 1 mL of the extract was evaporated under vacuum in a SpeedVac system. The residue was resuspended with 1 mL of ultrapure water and filtered through a 0.22-μm membrane. Soluble sugars (i.e. Glc, Fru, and Suc) were analyzed by high-performance anion-exchange chromatography with pulsed amperometric detection (Dionex) using a Carbopac PA1 (250 × 4 mm, 5-μm particle size; Dionex) in an isocratic run with 18 mm NaOH as mobile phase. The content of each sugar was calculated with the standard curves made with pure Glc, Fru, and Suc (Sigma-Aldrich).
Tocopherol and Pigment Quantification
Tocopherols were extracted from approximately 25 mg dry weight as described by Almeida et al. (2015). The samples were adjusted to a 4-mL final volume. Aliquots of 3 mL were dried under N2 and dissolved in 200 µL of mobile phase composed of hexane:tert-butyl methyl ether (90:10). Chromatography was carried out on a Hewlett-Packard series 1100 HPLC system coupled with a fluorescence detector (Agilent Technologies series 1200) on a normal-phase column (LiChrosphere 100 Diol Si; 250 mm × 4 mm, 5 µm; Agilent Technologies) at room temperature, with the mobile phase running isocratically at 1 mL min−1. Eluted compounds were detected by excitation at 295 nm, and fluorescence was quantified at 330 nm.
Chlorophyll extraction was carried out as described by Porra et al. (1989). One milliliter of dimethylformamide was added to 100 or 300 mg fresh weight for leaf or fruit samples, respectively. After sonication for 5 min and further centrifugation of 9,000g for 10 min, the supernatant was collected. The procedure was repeated until total removal of tissue green color. Spectrophotometer measurements were performed at 664 and 647 nm.
Carotenoid extraction was modified from Sérino et al. (2009). Aliquots of 200 mg fresh weight were extracted sequentially with a solution of saturated NaCl, dichloromethane, and hexane:diethyl ether (1:1). After centrifugation, the supernatant was collected, and the last step was repeated three more times. Samples were dried by vacuum and dissolved in 200 µL of acetonitrile. Chromatography was carried out on an Agilent Technologies series 1100 HPLC system on a normal-phase Phenomenex column (Luna C18; 250 × 4.6 mm, 5-µm particle diameter) at room temperature with a flow rate of 1 mL min−1. The mobile phase was a gradient of ethyl acetate (A) and acetonitrile:water, 9:1 (B): 0 to 4 min with 20% A:80% B; 4 to 30 min with 65% A:35% B; 30 to 35 min with 65% A:35% B; and 35 to 40 min with 20% A:80% B. Eluted compounds were detected between 340 and 700 nm and quantified at 450 nm.
Data Analyses
Differences in parameters were analyzed in InfoStat software version 17/06/2015 (Di Rienzo et al., 2011). When the data set showed homoscedasticity, Student’s t test (P < 0.05) was performed to compare transgenic lines against the control genotype. In the absence of homoscedasticity, a nonparametric comparison was performed by applying the Mann-Whitney test (P < 0.05). All values represent means of at least three biological replicates. A parameter was considered to be affected by SlORE1S02 silencing if at least two out of the three transgenic lines differed significantly from the untransformed genotype.
Supplemental Data
The following supplemental materials are available.
Supplemental Figure S1. Phylogenetic representation of the NAC subfamily of tomato and Arabidopsis.
Supplemental Figure S2. Alignment of SlORE1s, AtORE1, and AtORS1.
Supplemental Figure S3. Chlorophyll and senescence marker transcript levels after 48 h of senescence-inducing treatments.
Supplemental Figure S4. Nuclear subcellular localization of SlGLK and SlORE1 proteins.
Supplemental Figure S5. SlORE1S02 knockdown effectiveness.
Supplemental Figure S6. SlORE1S02 knockdown effects over SlORE1S03 and SlORE1S06 transcript abundance.
Supplemental Figure S7. Chloroplast ultrastructure of MPL leaves of SlORE1S02 knockdown and the MT control genotype.
Supplemental Figure S8. SlORE1S02 knockdown effects on fruit morphology and size.
Supplemental Figure S9. Effects of SlORE1S02 knockdown on fruit development and metabolism.
Supplemental Table S1. NAC sequence accessions used for phylogenetic reconstruction.
Supplemental Table S2. Relative transcript values of genes addressed in leaves of OEmiR164a lines.
Supplemental Table S3. Carotenoid, tocopherol, and chlorophyll contents in SlORE1S02 knockdown lines.
Supplemental Table S4. Relative transcript values of genes in leaves and along fruit ripening of SlORE1S02 knockdown lines.
Supplemental Table S5. Primers used in the experiments.
Acknowledgments
We thank Dr. Javier Palatnik (IBR, CONICET, Argentina) for providing the p35S:AtMiR164a construct and Dr. Tania Misuzu Shiga (FCF, USP, Brazil) for assistance in soluble sugar quantification.
Glossary
- TF
transcription factor
- DAPI
4′,6-diamino-phenylindole
- BiFC
bimolecular fluorescence complementation
- Col-0
Columbia-0
- RNAi
RNA interference
- YPL
young plant leaves
- MPL
mature plant leaves
- MT
Micro Tom
- HI
harvest index
- PDP
phytyl diphosphate
Footnotes
B.S.L., G.G., F.R.R.A., and B.T. were recipients of FAPESP fellowships; M.R., F.T.S.N., and D.D. were funded by a fellowship from CNPq; A.C.D.L. was the recipient of a CAPES fellowship; this work was partially supported by grants from FAPESP (Brazil; 2016/01128-9, 2014/10651-1), CNPq (Brazil), CAPES (Brazil), and USP (Brazil).
Articles can be viewed without a subscription.
References
- Almeida J, Asís R, Molineri VN, Sestari I, Lira BS, Carrari F, Peres LEP, Rossi M (2015) Fruits from ripening impaired, chlorophyll degraded and jasmonate insensitive tomato mutants have altered tocopherol content and composition. Phytochemistry 111: 72–83 [DOI] [PubMed] [Google Scholar]
- Almeida J, Azevedo MdaS, Spicher L, Glauser G, vom Dorp K, Guyer L, del Valle Carranza A, Asis R, de Souza AP, Buckeridge M, et al. (2016) Down-regulation of tomato PHYTOL KINASE strongly impairs tocopherol biosynthesis and affects prenyllipid metabolism in an organ-specific manner. J Exp Bot 67: 919–934 [DOI] [PMC free article] [PubMed] [Google Scholar]
- Balazadeh S, Riaño-Pachón DM, Mueller-Roeber B (2008) Transcription factors regulating leaf senescence in Arabidopsis thaliana. Plant Biol (Stuttg) (Suppl 1) 10: 63–75 [DOI] [PubMed] [Google Scholar]
- Balazadeh S, Siddiqui H, Allu AD, Matallana-Ramirez LP, Caldana C, Mehrnia M, Zanor MI, Köhler B, Mueller-Roeber B (2010) A gene regulatory network controlled by the NAC transcription factor ANAC092/AtNAC2/ORE1 during salt-promoted senescence. Plant J 62: 250–264 [DOI] [PubMed] [Google Scholar]
- Barker L, Kühn C, Weise A, Schulz A, Gebhardt C, Hirner B, Hellmann H, Schulze W, Ward JM, Frommer WB (2000) SUT2, a putative sucrose sensor in sieve elements. Plant Cell 12: 1153–1164 [DOI] [PMC free article] [PubMed] [Google Scholar]
- Chrost B, Falk J, Kernebeck B, Mölleken H, Krupinska K (1999) Tocopherol biosynthesis in senescing chloroplasts: a mechanism to protect envelope membranes against oxidative stress and a prerequisite for lipid remobilization? In Argyroudi-Akoyunoglou JH, Horst S, eds, The Chloroplast: From Molecular Biology to Biotechnology (v.64). Springer Science & Business Media. Dordrecht. pp 171–176 [Google Scholar]
- Di Rienzo JA. (2009) Statistical software for the analysis of experiments of functional genomics. Registro Dirección Nacional Derecho de Autor (RDNDA), Obra de Software: 756587 Argentina. http://sites. google. com/site/fgStatistics
- Di Rienzo JA, Casanoves F, Balzarini MG, Gonzalez L, Tablada M, Robledo YC (2011) InfoStat versión 2011. Grupo InfoStat, Registro Dirección Nacional Derecho de Autor (RDNDA), Obra de Software: 960318, Universidad Nacional de Córdoba, Argentina. http://www.infostat.com.ar
- Fitter DW, Martin DJ, Copley MJ, Scotland RW, Langdale JA (2002) GLK gene pairs regulate chloroplast development in diverse plant species. Plant J 31: 713–727 [DOI] [PubMed] [Google Scholar]
- Garapati P, Xue GP, Munné-Bosch S, Balazadeh S (2015) Transcription factor ATAF1 in Arabidopsis promotes senescence by direct regulation of key chloroplast maintenance and senescence transcriptional cascades. Plant Physiol 168: 1122–1139 [DOI] [PMC free article] [PubMed] [Google Scholar]
- Gehl C, Waadt R, Kudla J, Mendel RR, Hänsch R (2009) New GATEWAY vectors for high throughput analyses of protein-protein interactions by bimolecular fluorescence complementation. Mol Plant 2: 1051–1058 [DOI] [PubMed] [Google Scholar]
- Gregersen PL, Culetic A, Boschian L, Krupinska K (2013) Plant senescence and crop productivity. Plant Mol Biol 82: 603–622 [DOI] [PubMed] [Google Scholar]
- Guindon S, Dufayard JF, Lefort V, Anisimova M, Hordijk W, Gascuel O (2010) New algorithms and methods to estimate maximum-likelihood phylogenies: assessing the performance of PhyML 3.0. Syst Biol 59: 307–321 [DOI] [PubMed] [Google Scholar]
- Havaux M, Eymery F, Porfirova S, Rey P, Dörmann P (2005) Vitamin E protects against photoinhibition and photooxidative stress in Arabidopsis thaliana. Plant Cell 17: 3451–3469 [DOI] [PMC free article] [PubMed] [Google Scholar]
- He XJ, Mu RL, Cao WH, Zhang ZG, Zhang JS, Chen SY (2005) AtNAC2, a transcription factor downstream of ethylene and auxin signaling pathways, is involved in salt stress response and lateral root development. Plant J 44: 903–916 [DOI] [PubMed] [Google Scholar]
- Jones CG, Hare JD, Compton SJ (1989) Measuring plant protein with the Bradford assay. 1. Evaluation and standard method. J Chem Ecol 15: 979–992 [DOI] [PubMed] [Google Scholar]
- Karimi M, Inzé D, Depicker A (2002) GATEWAY vectors for Agrobacterium-mediated plant transformation. Trends Plant Sci 7: 193–195 [DOI] [PubMed] [Google Scholar]
- Kim JH, Chung KM, Woo HR (2011) Three positive regulators of leaf senescence in Arabidopsis, ORE1, ORE3 and ORE9, play roles in crosstalk among multiple hormone-mediated senescence pathways. Genes Genomics 33: 373–381 [Google Scholar]
- Kim JH, Woo HR, Kim J, Lim PO, Lee IC, Choi SH, Hwang D, Nam HG (2009) Trifurcate feed-forward regulation of age-dependent cell death involving miR164 in Arabidopsis. Science 323: 1053–1057 [DOI] [PubMed] [Google Scholar]
- Liang C, Wang Y, Zhu Y, Tang J, Hu B, Liu L, Ou S, Wu H, Sun X, Chu J, et al. (2014) OsNAP connects abscisic acid and leaf senescence by fine-tuning abscisic acid biosynthesis and directly targeting senescence-associated genes in rice. Proc Natl Acad Sci USA 111: 10013–10018 [DOI] [PMC free article] [PubMed] [Google Scholar]
- Lin YP, Wu MC, Charng YY (2016) Identification of a chlorophyll dephytylase involved in chlorophyll turnover in Arabidopsis. Plant Cell 28: 2974–2990 [DOI] [PMC free article] [PubMed] [Google Scholar]
- Lira BS, de Setta N, Rosado D, Almeida J, Freschi L, Rossi M (2014) Plant degreening: evolution and expression of tomato (Solanum lycopersicum) dephytylation enzymes. Gene 546: 359–366 [DOI] [PubMed] [Google Scholar]
- Lira BS, Rosado D, Almeida J, de Souza AP, Buckeridge MS, Purgatto E, Guyer L, Hörtensteiner S, Freschi L, Rossi M (2016) Pheophytinase knockdown impacts carbon metabolism and nutraceutical content under normal growth conditions in tomato. Plant Cell Physiol 57: 642–653 [DOI] [PubMed] [Google Scholar]
- Liu L, Shao Z, Zhang M, Wang Q (2015) Regulation of carotenoid metabolism in tomato. Mol Plant 8: 28–39 [DOI] [PubMed] [Google Scholar]
- Liu L, Zhou Y, Szczerba MW, Li X, Lin Y (2010) Identification and application of a rice senescence-associated promoter. Plant Physiol 153: 1239–1249 [DOI] [PMC free article] [PubMed] [Google Scholar]
- Mainardi JA, Purgatto E, Vieira-Junior A, Bastos WA, Cordenunsi BR, Nascimento JRO, Lajolo FM (2006) Effects of ethylene and 1-methylcyclopropene (1-MCP) on gene expression and activity profile of alpha-1,4-glucan-phosphorylase during banana ripening. J Agric Food Chem 54: 7294–7299 [DOI] [PubMed] [Google Scholar]
- Maxwell K, Johnson GN (2000) Chlorophyll fluorescence: a practical guide. J Exp Bot 51: 659–668 [DOI] [PubMed] [Google Scholar]
- Mitsuda N, Seki M, Shinozaki K, Ohme-Takagi M (2005) The NAC transcription factors NST1 and NST2 of Arabidopsis regulate secondary wall thickenings and are required for anther dehiscence. Plant Cell 17: 2993–3006 [DOI] [PMC free article] [PubMed] [Google Scholar]
- Morea EGO, da Silva EM, e Silva GF, Valente GT, Barrera Rojas CH, Vincentz M, Nogueira FTS (2016) Functional and evolutionary analyses of the miR156 and miR529 families in land plants. BMC Plant Biol 16: 40. [DOI] [PMC free article] [PubMed] [Google Scholar]
- Nguyen CV, Vrebalov JT, Gapper NE, Zheng Y, Zhong S, Fei Z, Giovannoni JJ (2014) Tomato GOLDEN2-LIKE transcription factors reveal molecular gradients that function during fruit development and ripening. Plant Cell 26: 585–601 [DOI] [PMC free article] [PubMed] [Google Scholar]
- Oh SA, Park JH, Lee GI, Paek KH, Park SK, Nam HG (1997) Identification of three genetic loci controlling leaf senescence in Arabidopsis thaliana. Plant J 12: 527–535 [DOI] [PubMed] [Google Scholar]
- Olsen AN, Ernst HA, Leggio LL, Skriver K (2005) NAC transcription factors: structurally distinct, functionally diverse. Trends Plant Sci 10: 79–87 [DOI] [PubMed] [Google Scholar]
- Pfaffl MW, Horgan GW, Dempfle L (2002) Relative expression software tool (REST) for group-wise comparison and statistical analysis of relative expression results in real-time PCR. Nucleic Acids Res 30: e36. [DOI] [PMC free article] [PubMed] [Google Scholar]
- Pino LE, Lombardi-Crestana S, Azevedo MS, Scotton DC, Borgo L, Quecini V, Figueira A, Peres LE (2010) The Rg1 allele as a valuable tool for genetic transformation of the tomato ‘Micro-Tom’ model system. Plant Methods 6: 23. [DOI] [PMC free article] [PubMed] [Google Scholar]
- Porra RJ, Thompson WA, Kriedemann PE (1989) Determination of accurate extinction coefficients and simultaneous equations for assaying chlorophylls a and b extracted with four different solvents: verification of the concentration of chlorophyll standards by atomic absorption spectroscopy. Biochim Biophys Acta 975: 384–394 [Google Scholar]
- Powell AL, Nguyen CV, Hill T, Cheng KL, Figueroa-Balderas R, Aktas H, Ashrafi H, Pons C, Fernández-Muñoz R, Vicente A, et al. (2012) Uniform ripening encodes a Golden 2-like transcription factor regulating tomato fruit chloroplast development. Science 336: 1711–1715 [DOI] [PubMed] [Google Scholar]
- Puranik S, Sahu PP, Srivastava PS, Prasad M (2012) NAC proteins: regulation and role in stress tolerance. Trends Plant Sci 17: 369–381 [DOI] [PubMed] [Google Scholar]
- Pyke K. (2011) Analysis of plastid number, size, and distribution in Arabidopsis plants by light and fluorescence microscopy. In Jarvis, RP, ed, Chloroplast Research in Arabidopsis: Methods and Protocols, Vol I Springer Science and Business Media, New York, pp 19–32 [DOI] [PubMed] [Google Scholar]
- Quadrana L, Almeida J, Otaiza SN, Duffy T, Corrêa da Silva JV, de Godoy F, Asís R, Bermúdez L, Fernie AR, Carrari F, et al. (2013) Transcriptional regulation of tocopherol biosynthesis in tomato. Plant Mol Biol 81: 309–325 [DOI] [PubMed] [Google Scholar]
- Rauf M, Arif M, Dortay H, Matallana-Ramírez LP, Waters MT, Gil Nam H, Lim PO, Mueller-Roeber B, Balazadeh S (2013) ORE1 balances leaf senescence against maintenance by antagonizing G2-like-mediated transcription. EMBO Rep 14: 382–388 [DOI] [PMC free article] [PubMed] [Google Scholar]
- Reynolds ES. (1963) The use of lead citrate at high pH as an electron-opaque stain in electron microscopy. J Cell Biol 17: 208–212 [DOI] [PMC free article] [PubMed] [Google Scholar]
- Rossi M, Bermudez L, Carrari F (2015) Crop yield: challenges from a metabolic perspective. Curr Opin Plant Biol 25: 79–89 [DOI] [PubMed] [Google Scholar]
- Ruijter JM, Ramakers C, Hoogaars WMH, Karlen Y, Bakker O, Van den Hoff MJB, Moorman AFM (2009) Amplification efficiency: linking baseline and bias in the analysis of quantitative PCR data. Nucleic Acids Res 37: e45–e45 [DOI] [PMC free article] [PubMed] [Google Scholar]
- Sakuraba Y, Jeong J, Kang MY, Kim J, Paek NC, Choi G (2014) Phytochrome-interacting transcription factors PIF4 and PIF5 induce leaf senescence in Arabidopsis. Nat Commun 5: 4636. [DOI] [PubMed] [Google Scholar]
- Sérino S, Gomez L, Costagliola G, Gautier H (2009) HPLC assay of tomato carotenoids: validation of a rapid microextraction technique. J Agric Food Chem 57: 8753–8760 [DOI] [PubMed] [Google Scholar]
- Shalygo N, Czarnecki O, Peter E, Grimm B (2009) Expression of chlorophyll synthase is also involved in feedback-control of chlorophyll biosynthesis. Plant Mol Biol 71: 425–436 [DOI] [PubMed] [Google Scholar]
- Song Y, Yang C, Gao S, Zhang W, Li L, Kuai B (2014) Age-triggered and dark-induced leaf senescence require the bHLH transcription factors PIF3, 4, and 5. Mol Plant 7: 1776–1787 [DOI] [PMC free article] [PubMed] [Google Scholar]
- Stępiński D. (2012) Immunofluorescent localization of ubiquitin and proteasomes in nucleolar vacuoles of soybean root meristematic cells. Eur J Histochem 56: e13. [DOI] [PMC free article] [PubMed] [Google Scholar]
- Stępiński D. (2014) Functional ultrastructure of the plant nucleolus. Protoplasma 251: 1285–1306 [DOI] [PMC free article] [PubMed] [Google Scholar]
- Swartzberg D, Dai N, Gan S, Amasino R, Granot D (2006) Effects of cytokinin production under two SAG promoters on senescence and development of tomato plants. Plant Biol (Stuttg) 8: 579–586 [DOI] [PubMed] [Google Scholar]
- Sykorová B, Kuresová G, Daskalova S, Trcková M, Hoyerová K, Raimanová I, Motyka V, Trávnícková A, Elliott MC, Kamínek M (2008) Senescence-induced ectopic expression of the A. tumefaciens ipt gene in wheat delays leaf senescence, increases cytokinin content, nitrate influx, and nitrate reductase activity, but does not affect grain yield. J Exp Bot 59: 377–387 [DOI] [PubMed] [Google Scholar]
- Tamura K, Stecher G, Peterson D, Filipski A, Kumar S (2013) MEGA6: Molecular Evolutionary Genetics Analysis version 6.0. Mol Biol Evol 30: 2725–2729 [DOI] [PMC free article] [PubMed] [Google Scholar]
- Tang X, Miao M, Niu X, Zhang D, Cao X, Wang A, Giovannoni JJ, Liu Y (2015) Ubiquitin-conjugated degradation of golden 2-like transcription factor is mediated by CUL4-DDB1-based E3 ligase complex in tomato. New Phytol 209: 1028–1039 [DOI] [PubMed] [Google Scholar]
- Thomas H. (2013) Senescence, ageing and death of the whole plant. New Phytol 197: 696–711 [DOI] [PubMed] [Google Scholar]
- Thomas H, Ougham H (2014) The stay-green trait. J Exp Bot 65: 3889–3900 [DOI] [PubMed] [Google Scholar]
- Varkonyi-Gasic E, Wu R, Wood M, Walton EF, Hellens RP (2007) Protocol: a highly sensitive RT-PCR method for detection and quantification of microRNAs. Plant Methods 3: 12. [DOI] [PMC free article] [PubMed] [Google Scholar]
- Waters BM, Uauy C, Dubcovsky J, Grusak MA (2009a) Wheat (Triticum aestivum) NAM proteins regulate the translocation of iron, zinc, and nitrogen compounds from vegetative tissues to grain. J Exp Bot 60: 4263–4274 [DOI] [PubMed] [Google Scholar]
- Waters MT, Moylan EC, Langdale JA (2008) GLK transcription factors regulate chloroplast development in a cell-autonomous manner. Plant J 56: 432–444 [DOI] [PubMed] [Google Scholar]
- Waters MT, Wang P, Korkaric M, Capper RG, Saunders NJ, Langdale JA (2009b) GLK transcription factors coordinate expression of the photosynthetic apparatus in Arabidopsis. Plant Cell 21: 1109–1128 [DOI] [PMC free article] [PubMed] [Google Scholar]
- Watson ML. (1958) Staining of tissue sections for electron microscopy with heavy metals. II. Application of solutions containing lead and barium. J Biophys Biochem Cytol 4: 727–730 [DOI] [PMC free article] [PubMed] [Google Scholar]
- Wu XY, Kuai BK, Jia JZ, Jing HC (2012) Regulation of leaf senescence and crop genetic improvement. J Integr Plant Biol 54: 936–952 [DOI] [PubMed] [Google Scholar]
- Zhang MP, Zhang CJ, Yu GH, Jiang YZ, Strasser RJ, Yuan ZY, Yang XS, Chen GX (2010) Changes in chloroplast ultrastructure, fatty acid components of thylakoid membrane and chlorophyll a fluorescence transient in flag leaves of a super-high-yield hybrid rice and its parents during the reproductive stage. J Plant Physiol 167: 277–285 [DOI] [PubMed] [Google Scholar]