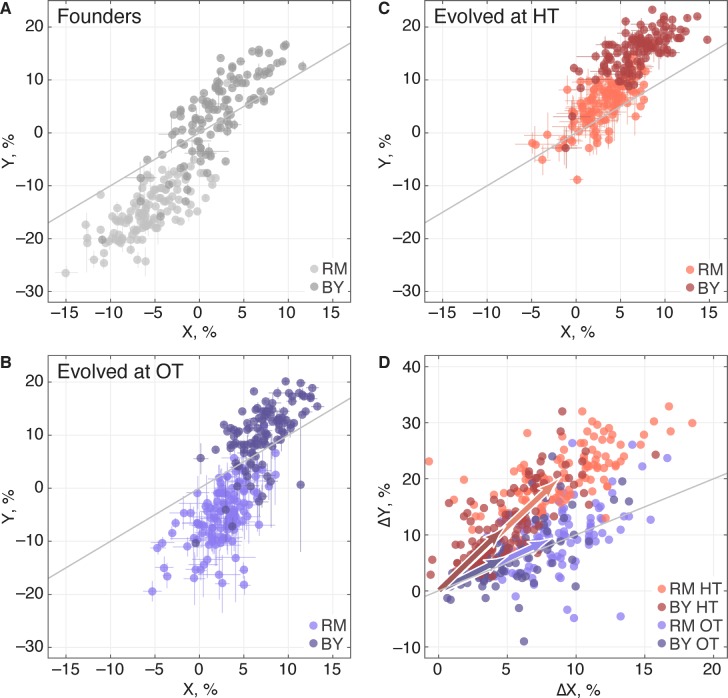
Figure 7. Pleiotropic consequences of adaptation.
(A) The fitness of each founder in the OT environment () and HT environment (). Error bars represent s.e.m. over technical replicates. Dark and light points represent strains carrying the BY and RM alleles at the KRE33 locus respectively. (B,C) Average fitness of all populations descended from each founder. Error bars represent s.e.m. over replicate populations. Orange and blue colors represent strains evolved at HT and OT, respectively; dark and light shades represent BY and RM alleles at the KRE33 locus respectively. (D) Average fitness increment of all populations descended from each founder; error bars omitted for clarity. Arrows point to the centroids of the respective point clouds.

