Abstract
Porous polyurethane foam was evaluated to replace the eight nylon meshes used as a substrate to collect nanoparticles in the Nanoparticle Respiratory Deposition (NRD) sampler. Cylindrical (25-mm diameter by 40-mm deep) foam with 110 pores per inch was housed in a 25-mm-diameter conductive polypropylene cassette cowl compatible with the NRD sampler. Pristine foam and nylon meshes were evaluated for metals content via elemental analysis. The size-selective collection efficiency of the foam was evaluated using salt (NaCl) and metal fume aerosols in independent tests. Collection efficiencies were compared to the nanoparticulate matter (NPM) criterion and a semi-empirical model for foam. Changes in collection efficiency and pressure drop of the foam and nylon meshes were measured after loading with metal fume particles as measures of substrate performance. Substantially less titanium was found in the foam (0.173 μg sampler−1) compared to the nylon mesh (125 μg sampler−1), improving the detection capabilities of the NRD sampler for titanium dioxide particles. The foam collection efficiency was similar to that of the nylon meshes and the NPM criterion (R2 = 0.98, for NaCl), although the semi-empirical model underestimated the experimental efficiency (R2 = 0.38). The pressure drop across the foam was 8% that of the nylon meshes when pristine and changed minimally with metal fume loading (~ 19 mg). In contrast, the pores of the nylon meshes clogged after loading with ~ 1 mg metal fume. These results indicate that foam is a suitable substrate to collect metal (except for cadmium) nanoparticles in the NRD sampler.
Keywords: polyurethane foam, nanoparticle sampler, salt particles, welding particles, particle loading, titanium
Introduction
Exposures to airborne nanoparticles (< 100 nm) are common in the workplace. These exposures may occur as engineered nanoparticles, which are generated intentionally for a specific purpose, or as incidental nanoparticles, which are byproducts of combustion or hot processes such as welding. Inhalable and respirable samplers are commonly used to assess occupational exposures to airborne particles. The inhalable samplers collect particles that are anticipated to enter the human respiratory system (can be breathed in) and includes particles as large as 100 μm (ACGIH, 2014). Respirable samplers collect the subset of inhalable particles anticipated to penetrate into the pulmonary region of the lung and includes particles as large as 10 μm (ACGIH, 2014). Thus, inhalable and respirable samples often include particles much larger than nanoparticles. Given that particle mass is related to diameter cubed, these large particles often obscure the presence of nanoparticles when quantified gravimetrically or chemically.
For a given mass dose of particles, however, greater adverse toxicological responses have sometimes been observed for nanoparticles compared to larger particles (Hussain et al., 2009; Karlsson et al., 2009; Oberdörster et al., 1994). This increased toxicity has been attributed to the fact that, compared to larger particles, nanoparticles have greater surface area (Hussain et al., 2009; Oberdörster et al., 1994), can translocate from the respiratory system to other parts of the body (Geiser & Kreyling, 2010; Oberdörster et al., 1994), and have unique surface characteristics (Grassian et al., 2007; Hamzeh & Sunahara, 2013; Jiang et al., 2008). Recognizing this issue, the National Institute for Occupational Safety and Health (NIOSH) issued Current Intelligence Bulletin (CIB) 63 in 2011 for titanium dioxide (TiO2) that specified a recommended exposure limit (REL) of 0.3 mg m−3 for ultrafine particles (including engineered nanoparticles) (NIOSH, 2011). NIOSH guidelines for measuring exposure to ultrafine TiO2 involves taking two respirable samples side-by-side. One sample is chemically analyzed to determine the fraction of TiO2, and the other sample is analyzed by electron microscopy to determine the fraction of nanoparticles.
Personal samplers have recently been introduced to selectively collect only nanoparticles, eliminating the need for electron microscopy and thereby streamlining exposure assessment. The Personal Nanoparticle Sampler (PENS) simultaneously samples respirable particles and nanoparticles (Tsai et al., 2012). The PENS uses a respirable cyclone to sample particles from the breathing zone of a worker and remove particles larger than the respirable criterion (ACGIH, 2014). A micro-orifice impactor then collects respirable particles with a cut-off diameter of 100 nm and a Polytetrafluoroethylene (PTFE) filter collects particles < 100 nm (Tsai et al., 2012). Tsai et al. designed the PENS to operate with traditional belt-mounted sampling pumps, which are limited by airflow rate and pressure drop they can provide. They also designed the impactor to have sharp collection efficiency curve so that the particles collected on the filter represent nanoparticle concentrations found in the sampled environment as closely as possible. These decisions resulted in a fairly heavy sampler (240 g) that has a pressure drop of 14.1 kPa at an airflow rate of 2.0 Lpm.
The commercially-available Nanoparticle Respiratory Deposition (NRD) sampler (ZA0075, Zefon International, Inc) also selectively collects nanoparticles, and similar to the PENS, uses a respirable cyclone to sample particles from the breathing zone (Cena et al., 2011). However, the NRD sampler uses an impactor to remove particles > 300 nm, followed by a diffusion stage of eight nylon meshes to collect particles < 300 nm with an efficiency matching the nanoparticulate matter (NPM) sampling criterion. The NPM criterion represents the fraction of nanoparticles that, if inhaled, would deposit in all regions of the human respiratory tract (Cena et al., 2011). The shape of the NPM criterion is shallow relative to the collection efficiency curve of impactors, thereby allowing the development of diffusion-based samplers. With this target, Cena et al. were able to design the lightweight (60 g), 2.5-Lpm NRD sampler to be compatible with belt-mounted air sampling pumps (pressure drop = 3.5 kPa). Moreover, the exposures measured with the NRD sampler represent the physiological dose of particles in the respiratory tract and thus should relate more closely to adverse health effects than exposures measured with samplers having physiological relevance.
Other researchers have used nylon mesh for sampling airborne particles. Gorbunov et al. (2009) developed a size-selective sampler for airborne particles with 11 stages. Particles larger than 250 nm are collected by impaction with a cascade impactor, whereas smaller particles are collected by diffusion on four stages composed of various layers of nylon mesh. Koehler and Volckens (2013) designed sampler that collects particles as they would deposit in different regions of the human respiratory tract. They used nylon mesh to mimic collection of particles in the alveolar region. However, unpublished data from the coauthors of Cena et al. (2011) indicated that the nylon meshes used in the NRD sampler contain a substantial amount of titanium (Ti) presumably from TiO2 used to whiten the nylon material. The presence of Ti in the substrate interferes with the exposure assessment of TiO2 nanoparticles, prompting the search for alternative collection substrates. Moreover, the particle collection behavior of nylon mesh is only known for spherical or near-spherical particles, and the long-term performance for chain agglomerates typical of vapor-condensation aerosols is unknown.
There are numerous substrates that can be used in a sampler to collect particles in a way that mimics the human respiratory system. Park et al. (2015) designed a three-layered granular bed composed of glass microspheres to act as a diffusion stage for the NRD sampler. Although collection efficiency followed the NPM curve, the microspheres were heavy compared to nylon mesh, difficult to layer, and difficult to mate with post-sampling chemical analysis. We have investigated other substrates, such as low-efficiency fibrous filters, which will be the subject of a forthcoming manuscript. Porous foam, the subject of the current work, has been used to collect particles in a way that mimics the human respiratory system. Porous foam consists of relatively uniform, spherical pores providing a high surface-area to volume ratio. Air pulled through the foam is forced through multiple layers of the pores in a tortuous path, increasing particle deposition onto the walls of the pores. Using a newly improved model for deposition of particulate matter in porous foams (Clark et al., 2009), Koehler et al. (2009) developed an aerosol sampler using a porous polyurethane foam substrate with an efficiency matching the human respiratory deposition for inhalable particles. Moreover, Dillner et al. (2007) demonstrated the ability to digest, analyze, and detect low levels of multiple metals collected on polyurethane foam substrates using elemental analysis. Similar to nylon mesh, the initial and long-term behavior of foam when used to sample chain agglomerate aerosols has not been studied.
The primary objective of this work was to evaluate porous polyurethane foam as an alternative to the nylon meshes used in the diffusion stage of the NRD sampler. A secondary objective was to evaluate foam and nylon mesh substrates when sampling chain-agglomerate aerosols. For foam and nylon mesh substrates, we measured the metals content and collection efficiency by particle size for salt and chain-agglomerate, metal fume particles. The pressure drop and collection efficiency, by particle size, of foam and nylon meshes at NRD operating conditions were compared when pristine and after loading with metal fume at levels representative of occupational sampling.
Methods
Characterization of foam and nylon mesh substrates
Thermally-reticulated (porous) polyurethane foam (neutral color; 100 ppi, New Dimension Industries, Moonachie, NJ) was cut using a table-mounted, hot-wire cutter (Thermocut 115/E, Proxxon, Hickory, NC) into 10 substrate sample cylinders (25-mm diameter × 40-mm depth). Each foam cylinder was weighed with a microbalance (MT5, Mettler-Toledo, Columbus, OH) and inserted into a conductive cassette cowl (housing) used in asbestos sampling (23-mm, internal diameter, Cat. No. 225-3-23, SKC, Eighty Four, PA). Air was passed at 10 L min−1 through a bipolar charger (85Kr charge neutralizer, 3054, TSI, Shoreview, MN) and then through the foam to neutralize static charge. The foam was compared to the eight 25-mm-diameter nylon meshes (pore diameter = 11 μm; NY1102500, Millipore Inc., Billerica, MA) used in the NRD sampler (depth = 0.5-mm). The solidity (α) of the nylon mesh was taken as 0.94 from Cena et al. (2011). A small piece of the substrate (~ 1 cm2) was mounted on an SEM stub and coated with a thin layer of conductive material (Au/Pd, 80%/20%) using a sputter coater (K550X, Quorum Technologies Ltd, UK). The substrates were imaged in an SEM (Hitachi S4800, Hitachi-High Technologies Corporation, Japan) operated at a 5.0-kV accelerating voltage. The fiber diameter of the foam was determined from images using ImageJ (1.49, NIH, Bethesda, MD).
The solidity of the foam was calculated as:
| (1) |
where ms, ds and h are the mass, diameter (25-mm), and depth of the foam, respectively, and ρs is the density of the base material (1200 kg m−3). The pore diameter of the foam was calculated from the fiber diameter using the linear relationship between fiber and pore diameter described in Kenny et al. (2001) as:
| (2) |
where dpo and df are the pore and fiber diameters respectively in meters.
The metals content [cadmium (Cd), chromium (Cr), copper (Cu), iron (Fe), manganese (Mn), nickel (Ni), titanium (Ti), and zinc (Zn)] in the foam and nylon mesh were determined in triplicate by microwave digestion followed by inductively coupled plasma-optical emission spectroscopy (ICP-OES; Varian 720 ES, Varian, Agilent Technologies, Santa Clara, CA) as described in detail by Mudunkotuwa et al. (2015). For each element, the limit of detection (LOD) was calculated as the mean plus three standard deviations of the elemental mass per sampler found in pristine substrates (IUPAC, 2006). The LOD is the mass of collected metal that can be differentiated from the background metal in the substrate. The LOD was then compared to an estimate of the mass of metal particles that would be collected on the substrate if used in the NRD sampler at 2.5 L min−1 for eight hours at concentrations 1/10th the NIOSH REL for TiO2 nanoparticles and the American Conference of Governmental Industrial Hygienists (ACGIH) threshold limit values (TLVs) for other metals (Table 1).
TABLE 1.
Summary of elemental analysis of blank substrates. ND indicates not detected.
| Element | Polyurethane foam | Nylon mesh | OELcμg m−3 | Mass collected at 1/10th OELdμg | ||||
|---|---|---|---|---|---|---|---|---|
|
|
|
|||||||
| μg g−1mean ± SD | μg sampler−1 a | LOD bμg | μg g−1mean ± SD | μg sampler−1 a | LOD b μg | |||
| Cd | 0.167 ± 0.145 | 0.126 | 0.454 | ND | ND | ND | 2 | 0.098 |
| Cr | ND | ND | ND | 0.999 ± 0.866 | 0.154 | 0.554 | 500 | 24.6 |
| Cu | 0.388 ± 0.129 | 0.292 | 0.583 | ND | ND | ND | 200 | 9.84 |
| Fe | 1.65 ± 1.65 | 1.24 | 4.97 | ND | ND | ND | 5000 | 246 |
| Mn | ND | ND | ND | 2.45 ± 0.062 | 0.378 | 0.407 | 20 | 0.984 |
| Ni | ND | ND | ND | ND | ND | ND | 1500 | 73.8 |
| Ti | 0.231 ± 0.221 | 0.173 | 0.673 | 812 ± 141 | 125 | 190 | 300 | 14.8 |
| Zn | 1.47 ± 1.15 | 1.11 | 3.70 | 0.556 ± 0.508 | 0.086 | 0.320 | 2000 | 98.4 |
Sampler represents the substrate required for the diffusion stage of the NRD sampler: foam cylinder of 25-mm diameter and 40-mm depth or eight nylon meshes.
LOD is three standard deviations above the mean elemental mass per blank sampler.
OEL for Ti is the NIOSH REL for ultrafine TiO2; OEL for other elements are ACGIH TLVs for the element or oxide of the metal.
Expected mass collected on NRD sampler if sampled for 8 hours at concentrations of 1/10th the OEL.
Collection efficiency and pressure drop
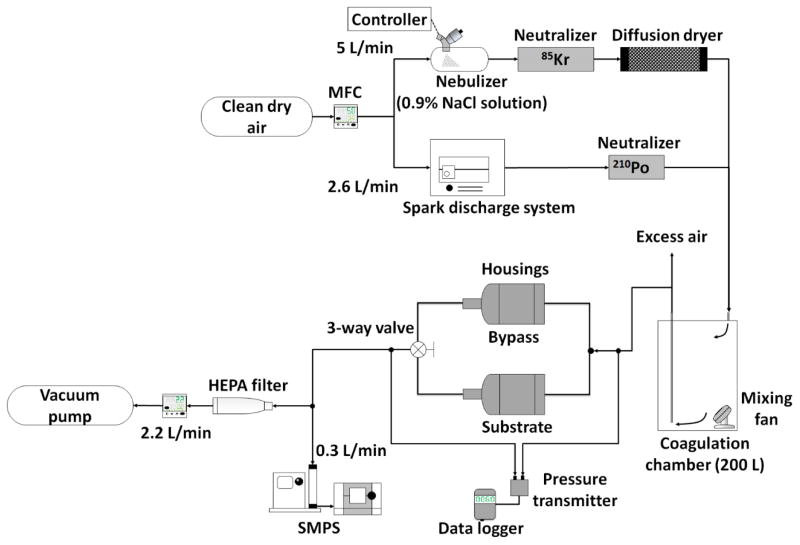
The experimental setup used to measure collection efficiency and pressure drop of five of the foam substrate samples for each of two aerosols (NaCl and metal fume; ten tests total) is shown in Figure 1. All tests were conducted with an airflow rate of 2.5 L min−1 to be compatible with NRD sampler. A mass flow controller (MFC; MPC20, Porter Instrument, Hatfield, PA) was used to deliver dry and clean air to the test particle generation systems. Solid NaCl aerosol was generated using a vibrating mesh nebulizer (Aeroneb Solo System, Aerogen, Ireland) operated with medical grade 0.9% NaCl irrigation solution (2F7123, Baxter Healthcare Co., Deerfield, IL). The aerosol was passed through a 85Kr charge neutralizer (3054, TSI, Shoreview, MN) to remove excess charge on the particles and silica gel diffusion dryer to ensure a solid crystal aerosol. Following Park et al. (2015), metal fume was generated by a spark discharge system set to 2.6 L min−1 airflow, 3 mA, 5–6 kV, and using welding rod electrodes (H544051 - RDP, Hobart, Troy, OH). The metal fume was passed through a pipe with a 210Po charge neutralizer (2U500, Staticmaster, Grand Island, NY) mounted on the side to remove excess charge on the particles. The generated NaCl or metal fume particles were passed through a 200-L (55-gallon) drum to achieve uniform, stable size distributions (see Supplemental Information; Figure S1 size distributions provided for NaCl [number median diameter of 108 nm and a geometric standard deviation of 1.93] and metal fume [number median diameter of 82 nm and a geometric standard deviation of 1.97]; Figure S2 provides images of test particles obtained with transmission electron microscopy).
FIG 1.
Experimental setup used to measure collection efficiency and pressure drop.
For each test, particle number concentration by size from 20 nm to 300 nm was measured with a scanning mobility particle sizer (SMPS; 3936, TSI, Shoreview, MN) alternately after passing through the empty (Cbypass) and substrate sampling line (Csubstrate) in the following pattern: Cbypass1-Csubstrate2-Cbypass3-Csubstrate4-Cbypass5-Csubstrate6-Cbypass7. The SMPS consisted of a classifier controller (3080, TSI, Shoreview, MN), an aerosol neutralizer (3077, TSI, Shoreview, MN), a differential mobility analyzer (DMA; 3081, TSI, Shoreview, MN), and a condensation particle counter (CPC; 3776, TSI, Shoreview, MN). The pressure drop across the parallel sampling lines was measured with a digital pressure transmitter (616-2, Dwyer, Michigan City, IN) and logged every 5 seconds. The digital pressure transmitter was calibrated with an inclined manometer (400-10, Dwyer, Michigan City, IN). The pressure drop across the foam was calculated as the pressure drop across the foam substrate line minus that across the bypass line. For size bin of the SMPS, collection efficiency (ηc) was calculated as: .
Average efficiencies for the NaCl aerosol were compared to the Clark et al. (2009) model for particle deposition in porous foam (see Supplemental Information, Equations S1–S5 for the Clark et al. (2009) model) after adjusting for particle shape, density, and anticipated penetration throught the NRD impactor. Following Park et al. (2015), the collection efficiency of the substrate, adjusted for the presence of the NRD impactor (ηadj), was calculated by multiplying the experimental collection efficiency by the penetration through the impactor as shown in Eq. 4–5. as:
| (3) |
| (4) |
where aerodynamic diameter (dae) is in meters and is calculated as:
| (5) |
and equivalent volume diameter (dve) is calculated from electrical mobility diameter (dm) from SMPS as:
| (6) |
where ρp is the particle density, ρ0 is unit density, χ is shape factor, and Cc is Cunningham slip correction factor.
The adjusted collection efficiencies for the NaCl and metal fume aerosols were compared to the NPM criterion. The NPM criterion was calculated for particle sizes 20–300 nm using volume equivalent diameter (Eq. 6) assuming a shape factor (χ) = 1.08 (for NaCl) and a size dependent χ for particles 100–300 nm (for metal fume) using a semi-empirical equation based on data from Kim et al. (2009). See Supplemental Information for more information on calculation of size-dependent shape factor (Figure S3 and Eq. S6).
The pressure drop through the three components of a full NRD sampler (cyclone inlet, impactor, and diffusion substrate) were measured with pristine foam and nylon meshes. A pressure gauge (Magnehelic, 0–0.25 kPa, Dwyer Instruments, Inc., Wilmington, NC) was used to measure the pressure drops across the cyclone, foam, or meshes at an airflow rate of 2.5 L min−1. Another pressure gauge (Model 407910, 0–200 kPa, Extech Instruments, Nashua, NH) was used to measure the pressure drop across the impactor or fully assembled NRD sampler. These data are shown in Table S1.
Evaluation after loading with metal fume
Changes in collection efficiency and pressure drop due to the particle loading on the substrates were measured for up to 20 hours of sampling metal fume aerosol. Twenty hours was selected to simulate full-shift (8-hour) sampling in an environment at the NIOSH REL for iron oxide fume (5 mg m−3) as the majority of test welding fume is composed of iron. One randomly selected foam substrate previously assigned to metal fume aerosol was placed in the substrate line of the experimental setup. The collection efficiency and pressure drop were measured identically to that described above, except that an NRD impactor was placed just upstream of the both parallel sampling lines to more realistically simulate use of the NRD sampler in the field. Pressure drop was continuously logged and efficiency tests were conducted at baseline (before loading), after every hour of loading for the first 11 hours, and every three hours for the remaining nine hours. After loading, the foam substrate was cut using a clean dry razor into four discs of equal size to evaluate stratification of particle deposition through the substrate. Actual mass of Fe collected on the foam substrate was analyzed using acid-assisted microwave digestion and ICP-OES chemical analysis. Collected particles on the first layer of the foam were imaged by SEM.
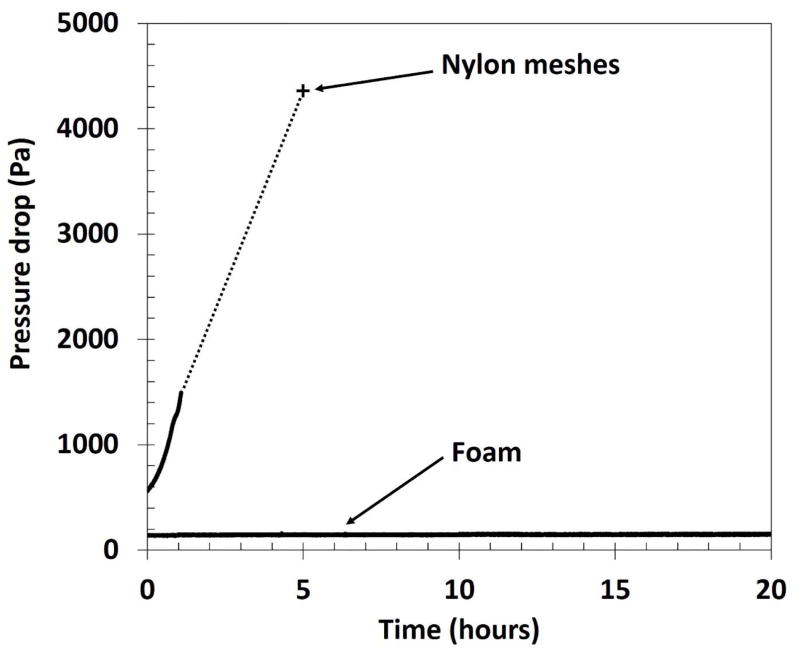
The same loading tests were conducted for eight pristine nylon meshes, except for only five hours because the pressure drop increased substantially. The final pressure drop across the nylon meshes was measured with an analog magnehelic pressure gauge (2050, Dwyer Instruments Inc., Michigan City, IN) having exceeded the upper limit of the digital pressure transmitter (1494 Pa) after only one hour. The collection efficiency of nylon meshes was measured at baseline and after five hours. Separate loading tests with eight nylon meshes was conducted over one hour to obtain samples for SEM imaging and ICP-OES analysis. The mass of fume deposited onto the foam and nylon mesh substrates during loading experiments was estimated by converting the number concentration from the SMPS to mass concentration, assuming a particle density of 3400 kg m−3 (Hewett, 1995), χ = 2 for all particle sizes, and multiplying by 41% (the average NPM efficiency of particles for the size range of the fume).
Statistical analysis
The adjusted experimental efficiency curves were compared to the NPM criterion using the coefficient of determination, R2, calculated as:
| (7) |
where ηadj,avg is the mean of the collection efficiency across particle sizes 20–300 nm. The R2 of the adjusted experimental efficiency curves and theory was also calculated as follows:
| (8) |
Results
Characterization
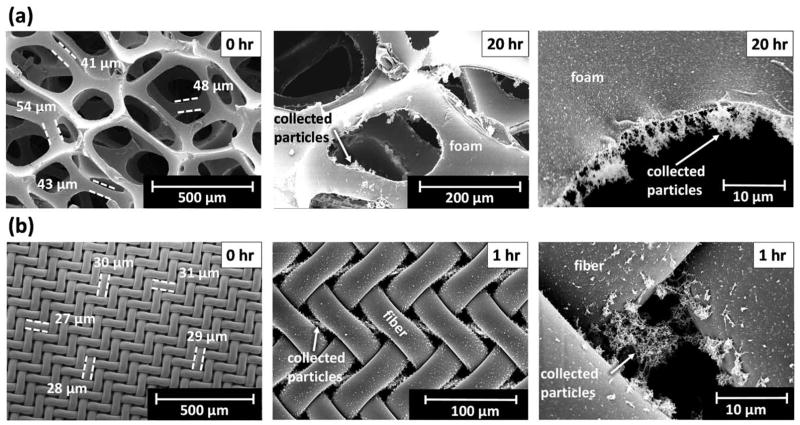
The morphology of the foam differed substantially from that of the nylon mesh as shown in Figure 2. Although the fibers of the foam [n = 10 fibers; fiber diameter = 45 μm (mean) ± 4 μm (SD)] were relatively uniform, they were not uniformly distributed, resulting in pores with substantial variation in size (Figure 2a). Using Eq. 2 with the mean fiber diameter yielded a pore diameter of 480 ± 50 μm. This diameter was in general agreement with larger pores from imaging (Figure 2a). The 10 cut foam cylinders were 25.2 ± 0.2 mm in diameter and 41.2 ± 0.3 mm in depth. The solidity of five foam substrates was 0.031 ± 0.001. The fibers of the nylon mesh were uniform (n = 25 fibers; fiber diameter = 29 ± 3 μm) and equally distributed, resulting in uniform pores 11 μm in diameter (Figure 2b), in agreement with the manufacturer’s reported diameter.
FIG 2.
SEM images of clean (0 hr loading) and particle-laden substrates for (a) clean polyurethane foam and after 20 hrs loading and (b) clean nylon mesh and after 1 hr loading. Agglomerated metal fume particles span pores of nylon mesh but not those of foam.
A summary of elemental analysis of pristine substrates is shown in Table 1. For foam and nylon mesh, the LOD was low for Cr, Cu, Fe, Mn, Ni, and Zn compared to the expected mass collected over eight hours at 1/10th the ACGIH TLVs. Substantially less Ti was found in the foam (0.173 μg sampler−1) compared to the nylon mesh (125 μg sampler−1). Importantly, the LOD of Ti in foam was 4.5% of the expected mass of Ti that would be collected at 1/10th the REL for ultrafine TiO2, whereas the LOD in eight nylon meshes was 13 times greater. Cadmium was found present in the foam with the LOD 4.5 times greater than the expected mass of Cd that would be collected at 1/10th of the TLV, but was not detected in the nylon mesh. However, other foams may have different metals content, particularly colored foams.
Collection efficiency and pressure drop
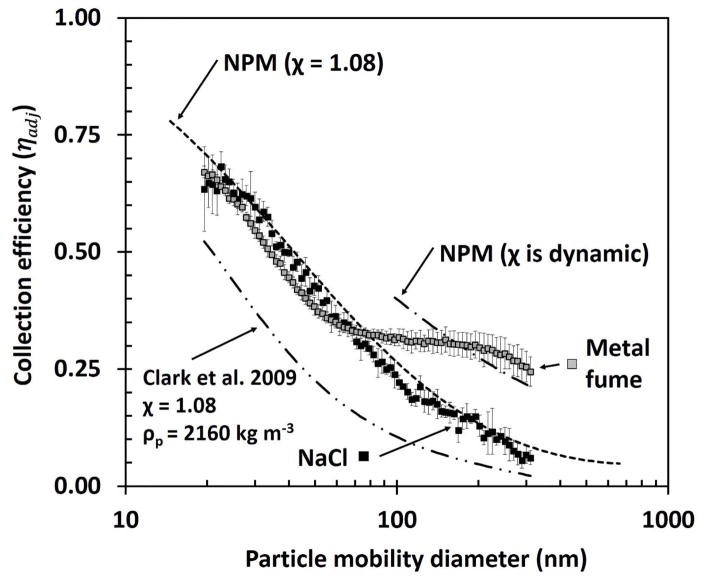
The adjusted collection efficiency by particle mobility diameter for the pristine foam is shown in Figure 3. For NaCl, the collection efficiency by particle size was similar to the NPM criterion with an R2 of 0.98. The modeled collection efficiency was similar in shape to experimental collection efficiencies but substantially lower, resulting in a low R2 (0.38). For metal particles, adjusted collection efficiencies were similar to the NPM (χ = 1.08) criterion (R2 = 0.81) for particles smaller than 70 nm, but were substantially higher than that criterion for particles larger than 80 nm. The collection efficiencies for these larger particles were better matched to the NPM criterion when adjusted for highly non-spherical particles (dynamic shape factor), Figure 3. The pressure drop across the foam (34 ± 2 Pa) was substantially lower than that for eight nylon meshes (433 ± 8 Pa).
FIG 3.
Adjusted collection efficiency of foam by particle mobility diameter for NaCl and metal fume aerosols. Error bars represent one standard deviation of the five substrate samples. NPM criterion have been adjusted for shape factor (χ). Clark et al. (2009) foam model has been adjusted for particle density and shape factor (χ) of NaCl.
Evaluation after loading with metal fume
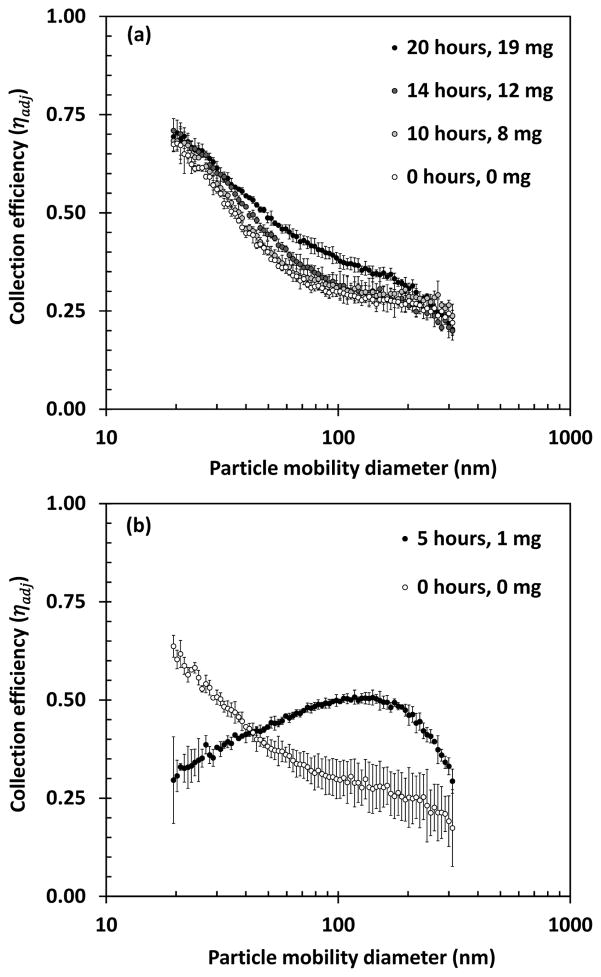
Adjusted collection efficiency by size of foam at baseline and after loading with metal fume is shown Figure 4a. The collection efficiency of the foam increased slightly (maximum of 11% for particles ~ 75 nm) after 20 hours of metal fume loading (~ 19 mg of fume loaded). The pressure drop through the foam increased linearly with particle loading from 42 Pa at baseline to 55 Pa after 20 hours (Figure 5). As shown in Figure 2a), agglomerated fume particles were attached to the edges of the foam pores but extended into the pore only a fraction of the pore diameter after 20 hours of loading.
FIG 4.
Adjusted collection efficiency of (a) foam and (b) nylon mesh by particle mobility diameter when clean (0 hr) and after loading with metal fume up to 20 hrs (19 mg) foam, and 5 hrs (1 mg) nylon meshes.
FIG 5.
Pressure drop after loading of metal fume for foam (over 20 hrs) and eight nylon meshes (over 5 hrs).
Substantially different results were obtained with the eight nylon meshes. At baseline, the collection efficiency by size for the nylon meshes was similar to that of the foam (Figure 4b). However, the collection efficiency curve changed drastically after only five hours of loading (~ 1 mg loaded) (Figure 4b). During this time, the pressure drop increased from 433 Pa to 4256 Pa (Figure 5). The openings of the leading mesh were completely clogged with metal, chain-agglomerate particles (Figure S4). Visual inspection of the nylon meshes after particle loading showed evidence of leakage at the edge of the meshes presumably caused by the dramatic increase in pressure drop. Thus, the collection efficiency curve in Figure 4b is attributed to a combination of partial filtration with some air bypassing the meshes altogether. Agglomerated fume particles can be seen spanning the pores of the top nylon mesh after one hour of loading (Figure 2b).
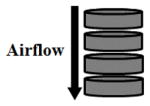
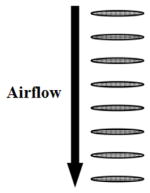
The mass of Fe collected on foam and nylon meshes with depth through the substrate is shown in Table 2. The leading quarter section of the foam collected the most Fe (Section A, 37%), although Fe was collected throughout the foam (Section B, 23%; Section C, 20%; and Section D, 20%). This effect was more pronounced for the nylon meshes with 51% of the Fe collected on the leading quarter of the substrate (Mesh 1 plus Mesh 2) with rapidly diminishing Fe collected on downstream meshes (Table 2).
TABLE 2.
Mass of Fe collected on foam and nylon mesh substrates by section. The foam was loaded for 20 hours and then cut into four parts. Nylon meshes were loaded for one hour.
| Substrate | Section | Fe massμg | Fraction of Fe collected on section |
|---|---|---|---|
| Polyurethane foam | |||
|
A | 94 | 0.37 |
| B | 61 | 0.23 | |
| C | 52 | 0.20 | |
| D | 51 | 0.20 | |
|
| |||
| Total | 258 | -- | |
|
| |||
| Nylon mesh | |||
|
1 | 5,970 | 0.31 |
| 2 | 3,710 | 0.19 | |
| 3 | 2,870 | 0.15 | |
| 4 | 2,100 | 0.11 | |
| 5 | 1,590 | 0.08 | |
| 6 | 1,180 | 0.06 | |
| 7 | 1,000 | 0.05 | |
| 8 | 753 | 0.04 | |
|
| |||
| Total | 19,200 | -- | |
Discussion
The porous polyurethane foam tested in this work offers a good alternative to nylon meshes for use as the diffusion stage of the NRD sampler. The foam had a collection efficiency matching the NPM criterion and, unlike the nylon mesh, was resilient to metal fume particle loading with respect to pressure drop and collection efficiency. The foam was found to have sufficiently low metals content for occupational exposure assessment of all metals tested, except for Cd (Table 1). The observation that the foam contains Cd is consistent with Dillner et al. (2007). The Ti content of the foam was substantially lower than that of the nylon meshes, resulting in a LOD for foam 0.4% that of the nylon meshes. The lower LOD of the foam will dramatically reduce the time required to collect a sufficient mass of particles during field sampling. For example, when sampling air with 30 μg m−3 TiO2 (1/10th the NIOSH REL for ultrafine TiO2), the NRD sampler with foam will require 30 minutes to collect a mass of Ti above the LOD, whereas the sampler with nylon meshes will require 53 hours.
These findings are critical for making the NRD sampler a practical option to streamline the exposure assessment protocol recommended by NIOSH in the CIB for TiO2. A single sample taken with the NRD sampler and analyzed by ICP-OES as outlined by Mudunkotuwa et al. (2015) is sufficient to determine if concentrations of ultrafine TiO2 in the workplace are acceptable. This approach is substantially less labor intensive and costly to that recommended in the CIB, which requires two respirable samples with one analyzed by ICP-OES and the other analyzed by electron microscopy.
The foam was substantially more resilient to loading of metal fume than the nylon mesh. For foam after 20 hours of metal fume loading (~19 mg), the pressure drop increased minimally (13 Pa; Figure 5), and the collection efficiency by size remained similar (Figure 4a). The slight increase in collection efficiency (a maximum of 11% with 19 mg loaded) was expected and likely resulted from increased interception by previously deposited fractal particles that extended into the pore (Figure 2a). The pores of the foam were sufficiently large, however, that this effect was minimal. The finding that Fe is collected throughout the foam (Table 2) supports the notion that particles are able to pass through the pores after substantial periods of loading. The finding that foam is resilient to particle loading is consistent with the work of Koehler et al. (2009). They observed minimal changes in the pressure drop of 100 ppi polyurethane foam (unknown mass and dimensions) with loading of up to 20 mg of near-spherical NaCl and spherical oil aerosol.
In contrast for nylon meshes after loading (5 hours; ~1 mg), the pressure drop increased substantially (3822 Pa, Figure 5), which may result in problems when field sampling. There were also substantial changes in collection efficiency by size (Figure 4b). The lowered collection efficiency of small particles (< 40 nm) after particle loading is thought to result from a leak of air around rather than through the nylon meshes. The leak likely resulted from the increased pressure drop from clogging of the mesh pores. Microscopic images obtained after one hour of loading (Figure 2b) show that the particles collected on nylon mesh extend well into the pore providing further opportunities for particle collection. The pore size of the nylon mesh (11 μm) was substantially smaller than the foam (480 μm). Consequently, the particles previously built up on the walls of the pore of the nylon mesh had a more rapid and pronounced effect on the pressure drop and collection efficiency by size compared to that observed for foam. The propensity for the nylon mesh to clog is supported by the finding that much more Fe was collected on the leading meshes (Table 2).
The experimental collection efficiencies of foam for near-spherical, NaCl particles were not in agreement with estimates made using the semi-empirical model from Clark et al. (2009). Experimental and modeled collection efficiency by size were similar in shape, but modeled collection efficiencies were substantially underestimated compared to experimental data (Figure 3). Although unlikely, slight compression of the foam substrate inside the housing may have decreased the foam pore size, subsequently decreasing the distance required for diffusion to result in deposition on the foam pore walls. More likely, the Clark et al. (2009) model is based on fibrous filter theory, which relies on fiber diameter as a key parameter to estimate particle collection by diffusion, impaction, and gravimetric settling. In this model (Eq. S1), fiber diameter appears in the overall penetration term and in the Péclet number (Eq. S2) used to characterize diffusion. In foam, however, a majority of airflow streamlines pass through the large pores, whereas in fibrous filters, streamlines predominately pass around the fibers. Additionally, fiber diameter will not change with compression whereas pore diameter will. Consequently, foam pore diameter, rather than fiber diameter used in the Clark model, is likely the key parameter to estimate particle deposition by diffusion. Another factor is that the model does not account for collection by electrostatic forces. Although the substrate and aerosol were neutralized prior to measurement of collection efficiency, image charging can result in increased collection efficiency that was not accounted for in the model.
We did not attempt to model efficiencies for chain-agglomerate, metal particles because available models for nylon mesh or foam do not account for interception. We observed interception to be critically important for chain-agglomerate metal fume particles > 70 nm. In fibrous filter theory, the interception parameter (R = dp/df) is used to characterize interception (Hinds, 1999). The lack of using pore diameter as a key parameter and lack of an interception term in foam deposition model may explain the difference observed in this research and theory. Although fiber diameter does appear in the Stokes number (Eq. S4) used to characterize impaction, the effects of impaction on nanoparticle deposition is negligible compared to diffusion and interception (Raynor et al., 2011). Future work is needed to integrate interception into models for these substrates. Also, samplers that were developed to use nylon mesh substrates (Gorbunov et al., 2009 and Koehler and Volckens, 2013) may suffer from over collection of chain-agglomerate particles.
There are some limitations with the current work. Foam was shown to provide desirable collection characteristics over time and is suitable to assess exposures to metal nanoparticles. We did not evaluate the foam for use with other analytical techniques (e.g., gravimetric or organic analysis). We also did not evaluate the influence of substrate characteristics (corrosiveness and wettability) on sampling. The fact that two substrates with highly different solidities (nylon mesh and foam) met the NPM criterion points to deficiencies in the criterion itself. The NPM criterion was based on experimental evidence for near-spherical particles (Cena et al., 2011). However, deposition in the human respiratory tract changes as a function of particle shape with chain-agglomerate particles depositing more than spherical particles due to interception. Further work is needed to define the NPM criterion as a function of particle shape based on experimental evidence from respiratory deposition studies. This work would put greater constraints on the solidity of the collection substrate and ensure that samplers would more closely mimic the human respiratory system.
Conclusions
Porous polyurethane foam was found to be a suitable replacement for the eight nylon meshes used in the NRD sampler with respect to elemental content (metals), particle collection by size, and pressure drop. With the exception of Cd, foam had a suitably low background for sampling at 1/10th the occupational exposure limit for Cr, Cu, Fe, Mn, Ni, Ti, Zn. Importantly relevant to sampling for TiO2, the LOD for Ti of the foam was 0.4% of that for the nylon meshes. Using NaCl aerosol, the collection efficiency curve of the foam was similar to the NPM criterion, thus in agreement with eight nylon meshes used in the NRD sampler. The open structure of the foam presented less resistance to airflow than the nylon meshes resulting in a lower pressure drop across the foam when pristine than that of the nylon meshes. The collection efficiency and pressure drop of the foam were less sensitive to the effects of metal fume loading than the nylon meshes. The collection efficiency of the foam increased only by a maximum of 11% when loaded with 19 mg of metal fume with a total change in pressure drop of 13 Pa, whereas the nylon meshes clogged when loaded with only 1 mg of metal fume. Future research is needed to refine collection efficiency models and the NPM criterion to account for particle shape.
Supplementary Material
Acknowledgments
This research was funded by generous support from the National Institute for Occupational Safety and Health (Training Grant T42 OH008491 and R01 OH010238).
References
- ACGIH. Threshold limit values for chemical substances and physical agents & biological exposure indices. Cincinnati, OH: American Conference of Governmental Industrial Hygienists ACGIH; 2014. [Google Scholar]
- Cena LG, Anthony TR, Peters TM. A personal nanoparticle respiratory deposition (NRD) sampler. Environmental Science and Technology. 2011;45(15):6483–6490. doi: 10.1021/es201379a. [DOI] [PMC free article] [PubMed] [Google Scholar]
- Clark P, Koehler KA, Volckens J. An improved model for particle deposition in porous foams. Journal of Aerosol Science. 2009;40(7):563–572. doi: 10.1016/j.jaerosci.2009.02.005. [DOI] [Google Scholar]
- Dillner AM, Shafer MM, Schauer JJ. A Novel Method Using Polyurethane Foam (PUF) Substrates to Determine Trace Element Concentrations in Size-Segregated Atmospheric Particulate Matter on Short Time Scales. Aerosol Science and Technology. 2007;41(1):75–85. doi: 10.1080/02786820601113282. [DOI] [Google Scholar]
- Geiser M, Kreyling WG. Deposition and biokinetics of inhaled nanoparticles. Part Fibre Toxicol. 2010;7:2. doi: 10.1186/1743-8977-7-2. [DOI] [PMC free article] [PubMed] [Google Scholar]
- Gorbunov BN, Priest R, Muir P, Jackson &, Gnewuch H. A novel size-selective airborne particle size fractionating instrument for health risk evaluation. Annals of Occupational Hygiene. 2009;53(3):225–237. doi: 10.1093/annhyg/mep002. [DOI] [PMC free article] [PubMed] [Google Scholar]
- Grassian VH, Adamcakova-Dodd A, Pettibone JM, O’shaughnessy PI, Thorne PS. Inflammatory response of mice to manufactured titanium dioxide nanoparticles: Comparison of size effects through different exposure routes. Nanotoxicology. 2007;1(3):211–226. doi: 10.1080/17435390701694295. [DOI] [Google Scholar]
- Hamzeh M, Sunahara GI. In vitro cytotoxicity and genotoxicity studies of titanium dioxide (TiO2) nanoparticles in Chinese hamster lung fibroblast cells. Toxicology In Vitro. 2013;27(2):864–873. doi: 10.1016/j.tiv.2012.12.018. [DOI] [PubMed] [Google Scholar]
- Hewett P. The particle size distribution, density, and specific surface area of welding fumes from SMAW and GMAW mild and stainless steel consumables. Am Ind Hyg Assoc J. 1995;56(2):128–135. doi: 10.1080/15428119591017150. [DOI] [PubMed] [Google Scholar]
- Hinds WC. Aerosol technology: Properties, behavior, and measurement of airborne particles. 2. Hoboken, NJ: John Wiley & Sons; 1999. [Google Scholar]
- Hussain S, Boland S, Baeza-Squiban A, Hamel R, Thomassen LC, Martens JA, … Marano F. Oxidative stress and proinflammatory effects of carbon black and titanium dioxide nanoparticles: role of particle surface area and internalized amount. Toxicology. 2009;260(1–3):142–149. doi: 10.1016/j.tox.2009.04.001. [DOI] [PubMed] [Google Scholar]
- IUPAC. Compendium of Chemical Terminology. McNaught AD, Wilkinson A, Nic M, Jirat J, Kosata B, editors. the “Gold Book”. 2006 doi: 10.1351/goldbook.L03540. Retrieved from http://www.iupac.org/goldbook/L03540.pdf. [DOI]
- Jiang J, Oberdörster G, Elder A, Gelein R, Mercer P, Biswas P. Does nanoparticle activity depend upon size and crystal phase? Nanotoxicology. 2008;2(1):33–42. doi: 10.1080/17435390701882478. [DOI] [PMC free article] [PubMed] [Google Scholar]
- Karlsson HL, Gustafsson J, Cronholm P, Moller L. Size-dependent toxicity of metal oxide particles--a comparison between nano- and micrometer size. Toxicol Lett. 2009;188(2):112–118. doi: 10.1016/j.toxlet.2009.03.014. [DOI] [PubMed] [Google Scholar]
- Kenny LC, Aitken RJ, Beaumont G, Gorner P. Investigation and application of a model for porous foam aerosol penetration. Journal of Aerosol Science. 2001;32:271–285. [Google Scholar]
- Kim SC, Wang J, Emery MS, Shin WG, Mulholland GW, Pui DYH. Structural Property Effect of Nanoparticle Agglomerates on Particle Penetration through Fibrous Filter. Aerosol Science and Technology. 2009;43(4):344–355. doi: 10.1080/02786820802653763. [DOI] [Google Scholar]
- Koehler KA, Clark P, Volckens J. Development of a sampler for total aerosol deposition in the human respiratory tract. Annals of Occupational Hygiene. 2009;53(7):731–738. doi: 10.1093/annhyg/mep053. [DOI] [PMC free article] [PubMed] [Google Scholar]
- Koehler KA, Volckens J. Development of a sampler to estimate regional deposition of aerosol in the human respiratory tract. Annals of Occupational Hygiene. 2013;57(9):1138–1147. doi: 10.1093/annhyg/met041. [DOI] [PubMed] [Google Scholar]
- Mudunkotuwa I, Anthony TR, Grassian V, Peters TM. Accurate Quantification of TiO2 Nanoparticles Collected on Air Filters Using a Microwave-Assisted Acid Digestion Method. Journal of Occupupational and Environmental Hygiene. 2015:1–28. doi: 10.1080/15459624.2015.1072278. [DOI] [PMC free article] [PubMed] [Google Scholar]
- NIOSH. Current intelligence bulletin 63: Occupational exposure to Titanium Dioxide (2011–160) NIOSH; 2011. Retrieved from http://www.cdc.gov/niosh/docs/2013-145/pdfs/2013-145.pdf. [Google Scholar]
- Oberdörster G, Ferin J, Lehnert BE. Correlation between Particle Size In Vivo Particle Persistence and Lung Injury. Environmental Health Perspectives. 1994;102:173–179. doi: 10.1289/ehp.102-1567252. [DOI] [PMC free article] [PubMed] [Google Scholar]
- Park JH, Mudunkotuwa IA, Mines LWD, Anthony TR, Grassian VH, Peters TM. A Granular Bed for Use in a Nanoparticle Respiratory Deposition Sampler. Aerosol Science and Technology. 2015 doi: 10.1080/02786826.2015.1013521. [DOI] [PMC free article] [PubMed] [Google Scholar]
- Raynor PC, Leith D, Lee KW, Mukund R. Sampling and Analysis Using Filters. In: Baron P, Kulkarni P, Willeke K, editors. Aerosol measurement: principles, techniques, and applications. 3. Hoboken, NJ: John Wiley & Sons Inc; 2011. pp. 107–128. [Google Scholar]
- Tsai CJ, Liu CN, Hung SM, Chen SC, Uang SN, Cheng YS, Zhou Y. Novel active personal nanoparticle sampler for the exposure assessment of nanoparticles in workplaces. Environmental Science and Technology. 2012;46(8):4546–4552. doi: 10.1021/es204580f. [DOI] [PubMed] [Google Scholar]
Associated Data
This section collects any data citations, data availability statements, or supplementary materials included in this article.


