Abstract
Modern high resolution Mass Spectrometry instruments can generate millions of spectra in a single systems biology experiment. Each spectrum consists of thousands of peaks but only a small number of peaks actively contribute to deduction of peptides. Therefore, pre-processing of MS data to detect noisy and non-useful peaks are an active area of research. Most of the sequential noise reducing algorithms are impractical to use as a pre-processing step due to high time-complexity. In this paper, we present a GPU based dimensionality-reduction algorithm, called G-MSR, for MS2 spectra. Our proposed algorithm uses novel data structures which optimize the memory and computational operations inside GPU. These novel data structures include Binary Spectra and Quantized Indexed Spectra (QIS). The former helps in communicating essential information between CPU and GPU using minimum amount of data while latter enables us to store and process complex 3-D data structure into a 1-D array structure while maintaining the integrity of MS data. Our proposed algorithm also takes into account the limited memory of GPUs and switches between in-core and out-of-core modes based upon the size of input data. G-MSR achieves a peak speed-up of 386x over its sequential counterpart and is shown to process over a million spectra in just 32 seconds. The code for this algorithm is available as a GPL open-source at GitHub at the following link: https://github.com/pcdslab/G-MSR.
Keywords: BigData, GPU, Proteomics, Out-of-Core, Data Reduction, Mass Spectrometry
1 INTRODUCTION AND BACKGROUND
With the advent of high resolution and more sensitive mass spectrometers, MS based proteomics has become a go-to method for systems biology research. It has found its applications in detection, treatment and determination of phenotypes of cancer [21], protein sequencing and quantization [10], profiling of exosomes [18], study of toxicology [12] [14] and in evolutionary biology [22].
For the above mentioned uses of MS based proteomics, protein sequencing and quantization is the core step. This process involves breaking down a protein into peptides and separating them based on their masses followed by fragmentation and quantization in a mass spectrometer [1]. The resultant spectra contain mass-to-charge ratios of these fragments along with their corresponding intensities which are referred to as peaks. These MS2 spectra can be large in number where each spectrum can have up to 4000 peaks [4].
For peptide sequencing MS2 spectra can then be processed through two types of peptide sequencing algorithms: i) denovo algorithms or ii) database search algorithms. Both algorithms have to sift through large number of combinatorial possibilities to deduce a peptide for a given spectra. In our previous studies we [4] [2] have shown that 90% of the peaks in a given spectra are not helpful in peptide deduction. However, classifying peaks as useful/non-useful before peptide deduction is a difficult problem which has led to the development of complex pre-processing algorithms [16][4]. Pre-processing of MS data has been studied under three major categories i.e. clustering [19], noise reduction [9] and quality assessment [5]. Algorithms from all categories have a common goal of assisting in peptide deduction by improving the quality of peptide spectral matches using standard peptide deduction algorithms. Several existing algorithms [16][15][9] are able to isolate and remove about 60% to 70% of the useless peaks which results in speeding up the process of peptide deduction. However, many of these compute intensive algorithms require more time for pre-processing than actual processing of peptide deduction; defeating the purpose of their design. A detailed review of these algorithms can be found in [4].
In our previous work, we introduced MS-REDUCE, a pre-processing algorithm [4]. It is shown to bring down pre-processing time from days to minutes. To the best of our knowledge, MS-REDUCE is the fastest known sequential noise/data reduction algorithm for MS2 spectra. But even with MS-REDUCE the pre-processing time forms a significant portion of proteomics pipeline. This calls for the introduction of many-core devices such as GPUs to solve this problem. GPUs with their thousands of cores have the capability of performing thousands of calculations concurrently thus speeding up the process manifolds. However, the performance of most GPU-based algorithms is limited by the memory-related bottlenecks [7]. Typical memory bottlenecks in GPU include large transfer times[11], limited in-core memory [7] and the toll incurred by the irregular memory accesses when large data structures are used [3][6].
In this paper we present a GPU based dimensionality reduction algorithm for MS2 spectra and we call it G-MSR. We introduce two novel data structures i.e. Binary Spectra and Quantized Indexed Spectra (QIS) which solves the memory-bottleneck problems and achieves large speed up over MS-REDUCE. G-MSR is effectively an out-of-core algorithm since it is capable of processing datasets larger than the size of GPU’s in-core memory. Using the novel data structures and careful parallel design we were able to achieve a peak speed-up of 386x over MS-REDUCE without loss of any accuracy.
1.1 Overview of MS-REDUCE
The algorithm first introduced in [4] operates in three steps: 1) Spectral Classification, 2) Quantization and 3) Weighted Sampling stage. Given a spectrum s and a reduction factor 0 < R ≤ 1, MS-REDUCE outputs a reduced spectrum s′ such that the size of reduced spectrum is approximately R*|s|. The core step of MS-REDUCE is the weighted sampling step, in which a reduced spectrum s′ is constructed such that the following total peak equation is satisfied.
here xi is the sampling weight for i-th quantum, qi is the number of peaks in quantum i, p′ represents total peaks in reduced spectrum and n is the number of quanta for given spectrum. Details of remaining steps can be found in [4]. Flow of MS-REDUCE algorithm can be observed in Fig. 2 A).
Figure 2.
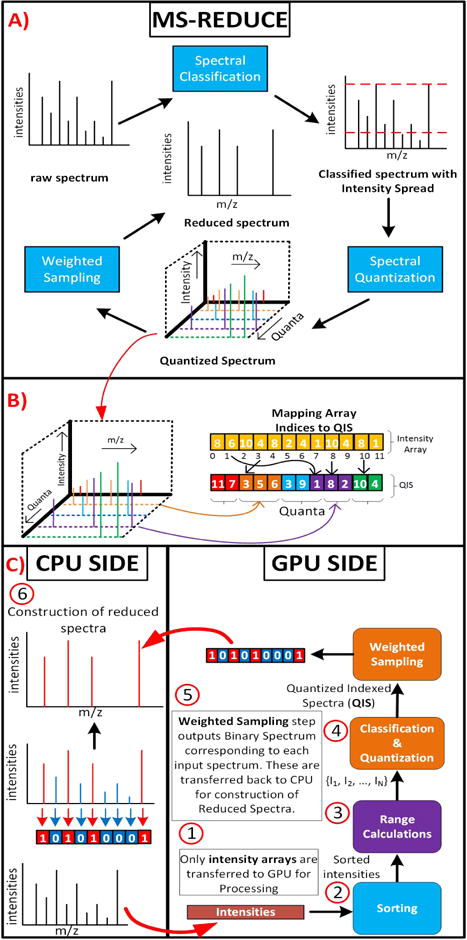
A) Shows the work flow of MS-REDUCE. B) Shows the construction of QIS from 3-D quantized spectrum from MS-REDUCE. C) Shows the work flow of G-MSR, blocks with same color represent processing in same kernel. A copy of actual spectra is maintained on the CPU for construction of reduced spectra.
1.2 CUDA Programing Model
With the introduction of CUDA programing environment GPUs have become easier to program and have offered a new platform in the realm of parallel computing [3] [20]. A GPU houses several Streaming Multiprocessors (SM) with each SM containing multiple CUDA cores. In modern GPUs with compute capability 3.0 and later, each SM can have up to 192 CUDA cores. Using CUDA programing environment the intricacies of hardware architecture are hidden from a programmer; instead she can focus on parallelizing the problem. GPUs employ SIMT model which combines the usual SIMD with multiple threading. Threads in CUDA environment are organized in a two level hierarchy of grids and thread blocks. A grid consists of multiple blocks and each block contains several threads. Each thread within a block has a unique thread and a block id. Threads within a block can communicate via a shared memory and local thread synchronizations. Inter block communication is performed through global memory and block synchronizations. The global memory is 100x slower than the shared memory but the smaller size of shared memory limits its utilization to a user controlled cache [17].
2 GPU BASED MS-REDUCE (G-MSR)
2.1 In-Core G-MSR
We have designed G-MSR to operate only on peak intensities. This preserves PCIe bandwidth since we only transfer intensities after rounding them off to the nearest integer. This does not have any effect on the quality as shown in our subsequent quality assessment experiments. Fig. 1 shows the difference in the amount of data handled by MS-REDUCE and G-MSR. In this paper, the word spectra or spectrum will refer to the arrays of peak-intensities.
Figure 1.
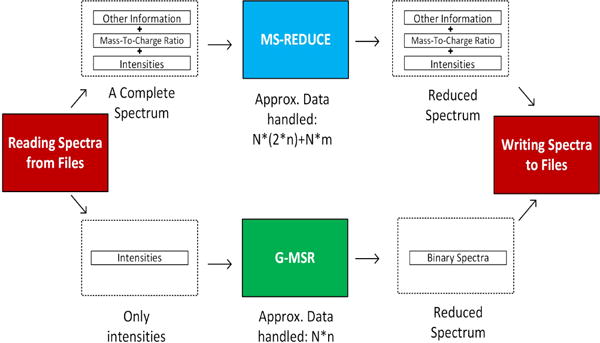
Here N denotes the number of spectra, n the size of largest spectrum and m the size of other information. Transferring only intensities to GPU for processing can conserve more than 50% of scarce in-core memory. G-MSR outputs the newly introduced Binary Spectra(defined in section: 2.1.2).
2.1.1 Sorting and Intensity Spread Calculation
The calculation of average intensity spread (Iavg) requires sorting of intensities which forms a bottleneck [4]. To counter this we recently proposed a array sorting algorithm called GPU-ArraySort. It is a highly scalable algorithm for sorting large number of arrays making full use of GPU’s resources [3]. We refer to the GPU-ArraySort Kernel as Kernel-1. Next, the intensity spread kernel i.e. Kernel-2 calculates intensity spread for each spectrum and calculates Iavg. Pseudo code for Kernel 2 is given in Algo. 1.
2.1.2 Spectral Classification, Quantization and Sampling
Spectral Classification, Quantization and Sampling steps are boxed together in one single kernel function; we call it Kernel-3. Output of this kernel is a list of Binary Spectra. Binary Spectra provides a way of communicating this information between CPU and GPU necessary for constructing reduced spectrum from Binary Spectrum, as shown in Fig. 2.
Definition 2.1
Given a spectrum si = {p1, p2, p3, …, pn} a Binary Spectrum Bi for the corresponding reduced spectrum is defined as, .
As shown in Fig. 2 A), quantization step yields a complex 3-D data structure. Maintaining and accessing 3-D data structures inside GPU’s memory can be very inefficient. To tackle this problem we introduce a novel data structure, Quantized Indexed Spectrum (QIS) to represent a quantized spectrum in a simple 1-D array. QIS helps avoiding irregular memory accesses and uses 50% less data, resulting in efficient, in-core memory usage. Fig. 2 B) shows the construction of QIS from intensity array. QIS can be formally defined as:
Definition 2.2
Given a spectrum si of size n, if after quantization, si has m quanta, then its QIS is given by Qi = {l1, l2, l3, …, ln}. Here lx represents a peak index. Starting and ending offsets of quanta are stored in a separate array p = {st1, e1, st2, e2, …, stm, em} where sty is the offset where quantum y starts and ey is where quantaum y ends.
The Sampling step involves determining the sampling weights for satisfying the peak equation. Peak-indices in QIS are sampled across all quanta based on these sampling weights. From the sampled-indices a Binary Spectrum is constructed using the array O = {01, 02, 03, … 0k} of size same as si. And placing 1s at each index sampled before. Fig. 2B) shows the process of constructing reduced spectra from Binary Spectra on CPU side.
2.2 Out-of-Core G-MSR
The out-of-core algorithm estimates the amount of memory required to process a given dataset. Depending on the total in-core memory of given GPU it then divides the dataset into parts and processes them in passes. However, because of data dependencies processing has to be performed in phases.
2.2.1 Phase 1
After moving the first chunk of spectra in the GPU memory, Kernel-1 is launched followed by Kernel-2 to calculate Iavg. The array of Ii for each chunk is stored on CPU temporarily. Then the process is repeated for remaining chunks, till Ii for all spectra and their sum is available on CPU. Iavg value for complete dataset is calculated on CPU and copied back.
2.2.2 Phase 2
In phase 2, each chunk of spectra along with its corresponding Ii array is copied to GPU and Kernel-3 is launched. The process repeats till all the chunks have been processed. Fig. 3 shows the flow of out-of-core execution.
Figure 3.
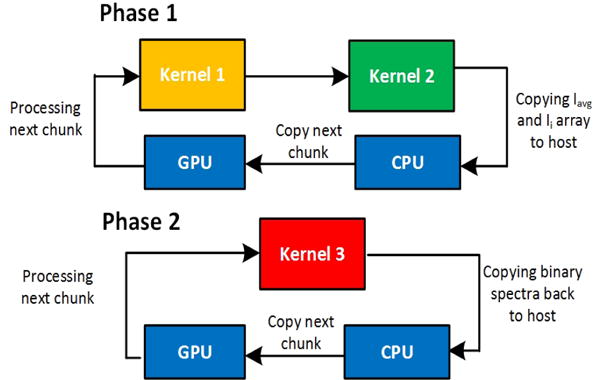
The figure showing the flow for out-of-core processing, phase 1 and phase 2 have been shown separately.
Algorithm 1.
Per thread Pseudo code for Kernel 2
| Require: An array A of intensities and array S containing spectrum sizes. Subscript i wherever used, represents unique spectrum |
| Ensure: Array B containing binary spectrum of A |
| for each thread i do |
| Ri ← SUM(Max10Peaks) − SUM(Min10Peaks) |
| Ravg ← Average(R) |
| end for |
Algorithm 2.
Per thread Pseudo code for Kernel 3
| Require: An array A of intensities, Average Intensity Spread R and array of Intensity Spread R |
| Ensure: Array B containing binary spectrum of A |
| for each thread i do |
| Ci ← getClass(Ai, Ri) |
| Qi ← getTotalQuanta(Ci) |
| for each aj ∈ Ai do |
| aj ← getQuantum(aj) |
| end for |
| qj ∈ qS ← quantaSizes(Ai) |
| B ← 0 |
| for each qj ∈ qS do |
| qj ← getSampleRate(qj) |
| B[getSample(qj)] ← 1 |
| end for |
| end for |
3 TIME COMPLEXITY ANALYSIS
GPU-ArraySort uses insertion sort for sorting small sized bins. If p CUDA threads are used for sorting a spectrum of size n, its time complexity would be , we can extend this for N spectra and B CUDA blocks to get for the sorting step. Intensity Spread calculation and Classification steps are constant time processes and take O(N) for N spectra, while using a total of B threads across all CUDA blocks, both of these steps can be performed in . The Quantization step takes O(n) time for a spectrum of size n. For N spectra this would take O(N * n), and when using B threads across all blocks it becomes . The Random Sampling step has an execution time of O(s* n) where s is the rate of sampling and its value varies from 0 to 1. While using a total of B threads across all blocks and for N spectra it becomes . Combining all of the above time complexities and replacing l = p * (2 + n + n * s), we get:
| (1) |
4 PERFORMANCE EVALUATION
We evaluated the performance of G-MSR from two different aspects. First was a time based analysis to determine the amount of speed-up obtained over the serial version. Second was a quality assessment experiment to see how the number of high quality peptide spectral matches (PSMs) varied when treating the spectra with G-MSR. We also evaluate the performance of G-MSR while using it as a tool for reductive proteomics for high resolution instruments.
4.1 Data Generation
For all the experiments, we made use of the thirteen datasets we used before in [4] and [19]. Naming conventions for all thirteen data sets are same as in [4].
4.2 Experiment Setup
For all the experiments we made use of a Linux server running Ubuntu Operating System, version 14.01. The server houses two Intel Xeon E5-2620 Processors, clocked at 2.40 GHz with a total RAM of 48 GBs. The system has an NVIDIA Tesla K-40c GPU with a total of 2880 CUDA Cores and 12 GBs of RAM. CUDA version 7.5 and GCC version 4.8.4 were used for compilation.
4.3 Scalability and Time Analysis
For this experiment, we used the appended UPS2 dataset which had over a million spectra. Timing experiments were performed with increasing datasizes to cover the out-of-core cases. Results for scalability studies can be observed in Fig. 5. In Fig. 5, when N is small and is almost equal to B we get huge speed ups. But as the number of spectra increase and the number of concurrent threads reach their limit we observe a decrease in speed up in accordance with Eq. 1. Also term l in Eq. 1 increases when reduction factor is increased. This explains higher speed ups for lower reduction factors.
Figure 5.
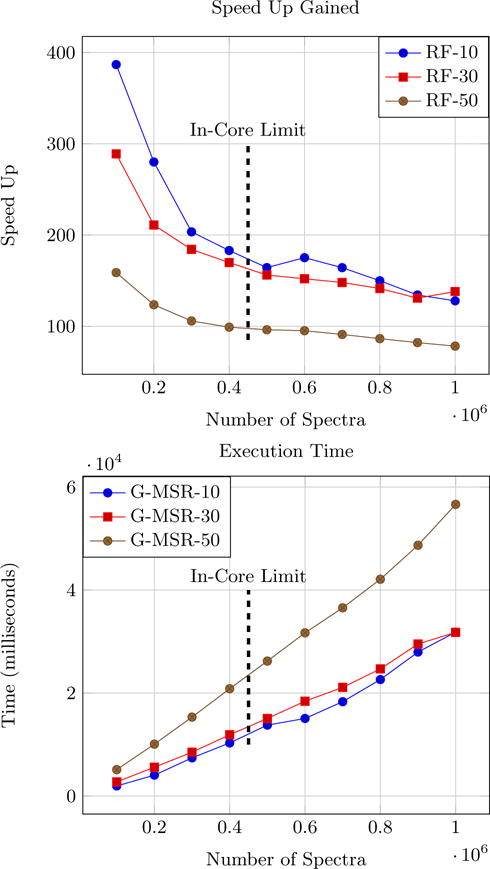
Top figure shows the speed up achieved by G-MSR over MS-REDUCE and the bottom figure shows the execution times for G-MSR operating at reduction factors of 10, 30 and 50. The vertical line represents the point where in-core memory is filled.
4.4 Quality Assessment
We used the same method of quality assessment as discussed in [4]. For our experiments we set the FDR value of interest to 5% i.e. any PSM having FDR value below 5% is an acceptable match, we call them effective matches. Fig. 6 shows percentage of effective matches with varying reduction factors for both algorithms. G-MSR and MS-REDUCE gave almost same percentages of effective matches.
Figure 6.
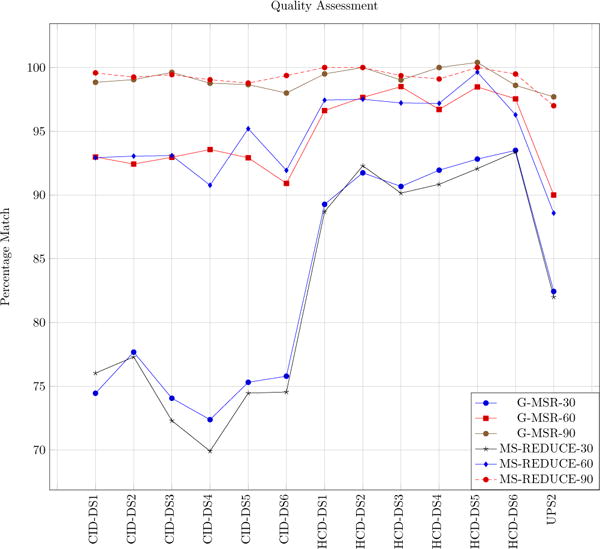
Quality assessment plots of MS-REDUCE and G-MSR. Numerical values in legend are the reduction factors. X-axis is the data set labels and Y-axis is the PSM percentage with FDR greater than 5%.
4.5 Reductive Proteomics for high resolution instruments
In high resolution mass spectrometery data, number of bins created can be quite large which can lead to large processing times for all sorts of peptide deduction algorithms [13].
Pre-processing of spectra with G-MSR will reduce the size of spectrum and hence the processing time for peptide deduction. We performed peptide deduction for UPS2 dataset after preprocessing it with G-MSR at different reduction factors. For this experiment Tide [8] integrated with hiXcorr [13] was used for peptide deduction. Fig. 4 shows that with smaller reduction factors the performance of peptide deduction algorithm becomes more scalable even with increasing resolution.
Figure 4.
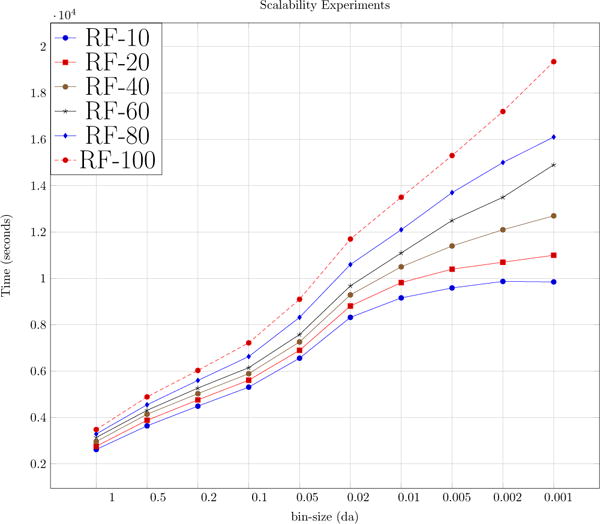
Timing plots of peptide deduction process using Tide with hiXcorr algorithm. Here RF is the reduction factor. An increasing RF makes the process more scalable.
5 DISCUSSION AND CONCLUSION
Modern day multi- and many-core devices are changing the way scientists tackle computationally complex problems. Theoretically intractable problems with complex approximate solutions are now being solved in acceptable times using modern high performance computing devices. In the field of bioinformatics datasets may range from a few gigabytes to several terabytes. These large datasets not only provide computational bottlenecks but an added problem of data management inside the limited in-core memories of these devices. In this paper we presented a GPU based data reduction algorithm for MS2 spectra called G-MSR. We introduced two novel data structures called Quantized Indexed Spectrum (QIS) and Binary Spectrum which helped minimize the use of GPU memory and making memory accesses more localized and thus enabled the processing of large data sets in a single pass with maximum efficiency. Binary spectra allowed us to process spectra by just copying the required information on to the GPU while storing the actual spectra on CPU Memory.
Our proposed strategy is capable of processing datasets which exceed the memory limits of a GPU using an out-of-core technique. Our experiments show a peak speed-up of 386x as compared to the serial version of the algorithm. And finally we introduce G-MSR to be used as a pre-processing step in reductive proteomics for high resolution instruments for high throughput processing.
Acknowledgments
This research was supported by the National Institute Of General Medical Sciences (NIGMS) of the National Institutes of Health (NIH) under Award Number R15GM120820. The content is solely the responsibility of the authors and does not necessarily represent the official views of the National Institutes of Health. This work was supported in part by National Science Foundation grants NSF CRII CCF-1464268 and NSF CAREER ACI-1651724. We would also like to acknowledge the donation of a K-40c Tesla GPU from NVIDIA which was used for all GPU based experiments performed in this paper.
Footnotes
Permission to make digital or hard copies of all or part of this work for personal or classroom use is granted without fee provided that copies are not made or distributed for profit or commercial advantage and that copies bear this notice and the full citation on the first page. Copyrights for components of this work owned by others than ACM must be honored. Abstracting with credit is permitted. To copy otherwise, or republish, to post on servers or to redistribute to lists, requires prior specific permission and/or a fee. Request permissions from permissions@acm.org.
CCS CONCEPTS
•Applied computing → Computational proteomics; Bioinformatics; •Computing methodologies → Massively parallel algorithms;
Contributor Information
Muaaz Gul Awan, Department of Computer Science, Western Michigan University, 4601 Campus Drive, Kalamazoo, Michigan 49009, muaazgul.awan@wmich.edu.
Fahad Saeed, Department of Computer Science, Western Michigan University, 4601 Campus Drive, Kalamazoo, Michigan 49009, fahad.saeed@wmich.edu.
References
- 1.Aebersold Ruedi, Mann Matthias. Mass spectrometry-based proteomics. Nature. 2003;422(6928):198–207. doi: 10.1038/nature01511. (2003) [DOI] [PubMed] [Google Scholar]
- 2.Awan Muaaz Gul, Saeed Fahad. On the sampling of big mass spectrometry data. The International Society for Computers and Their Applications (ISCA) 2015 [Google Scholar]
- 3.Awan Muaaz Gul, Saeed Fahad. Parallel Processing Workshops (ICPPW), 2016 45th International Conference on Parallel Processing. IEEE; 2016. GPU-ArraySort: A parallel, in-place algorithm for sorting large number of arrays; pp. 78–87. [Google Scholar]
- 4.Awan Muaaz Gul, Saeed Fahad. MS-REDUCE: An ultrafast technique for reduction of Big Mass Spectrometry Data for high-throughput processing. Bioinformatics. 2016:btw023. doi: 10.1093/bioinformatics/btw023. (2016) [DOI] [PubMed] [Google Scholar]
- 5.Bern Marshall, Goldberg David, McDonald W Hayes, Yates John R., IIII Automatic Quality Assessment of Peptide Tandem Mass Spectra. Bioinformatics. 2004;20 doi: 10.1093/bioinformatics/bth947. (2004) [DOI] [PubMed] [Google Scholar]
- 6.Cederman Daniel, Tsigas Philippas. Gpu-quicksort: A practical quicksort algorithm for graphics processors. Journal of Experimental Algorithmics (JEA) 2009;14:4. (2009) [Google Scholar]
- 7.Chao Sankua, Green James R, Smith Jeffrey C. Evaluation of a GPGPU-based de novo Peptide Sequencing Algorithm. Journal of Medical and Biological Engineering. 2014;34(5) (2014) [Google Scholar]
- 8.Diament Benjamin J, Noble William Stafford. Faster SEQUEST Searching for Peptide Identification from Tandem Mass Spectra. Journal of Proteome Research. 2011;10(9):3871–3879. doi: 10.1021/pr101196n. (July 2011) [DOI] [PMC free article] [PubMed] [Google Scholar]
- 9.Ding Jiarui, Shi Jinhong, Poirier Guy G, Wu Fang Xiang. A novel approach to denoising ion trap tandem mass spectra. Proteome Science. 2009;7(9) doi: 10.1186/1477-5956-7-9. (March 2009) [DOI] [PMC free article] [PubMed] [Google Scholar]
- 10.Eng Jimmy K, McCormack Ashley L, Yates John R. Journal of the. 11. Vol. 5. American Society for Mass Spectrometry; 1994. An approach to correlate tandem mass spectral data of peptides with amino acid sequences in a protein database. (1994) [DOI] [PubMed] [Google Scholar]
- 11.Fujii Yusuke, Azumi Takuya, Nishio Nobuhiko, Kato Shinpei, Edahiro Masato. Parallel and Distributed Systems (ICPADS), 2013 International Conference on. IEEE; 2013. Data transfer matters for GPU computing; pp. 275–282. [Google Scholar]
- 12.Linnet K. Toxicological Screening and Quantitation Using Liquid Chromatography/Time-of-Flight Mass Spectrometry. Journal of Forensic Science and Criminology. 2013;1(1) (2013) [Google Scholar]
- 13.Kim Hyunwoo, Jo Hosung, Park Heejin, Paek Eunok. HiXCorr: a portable high-speed XCorr engine for high-resolution tandem mass spectrometry. Bioinformatics. 2015:btv490. doi: 10.1093/bioinformatics/btv490. (2015) [DOI] [PubMed] [Google Scholar]
- 14.Leuthold Luc Alexis, Mandscheff Jean-François, Fathi Marc, Giroud Christian, Augsburger Marc, Varesio Emmanuel, Hopfgartner Gerard. Desorption electrospray ionization mass spectrometry: direct toxicological screening and analysis of illicit Ecstasy tablets. Rapid Communications in Mass Spectrometry. 2006;20(2):103–110. doi: 10.1002/rcm.2280. (2006) [DOI] [PubMed] [Google Scholar]
- 15.Mujezinovic Nedim, Raidl Gunther, Hutchins James RA, Peters Jan-Michael, Mechtler Karl, Eisenhaber Frank. Cleaning of raw peptide MS/MS spectra: Improved protein identification following deconvolution of multiply charged peaks, isotope clusters, and removal of background noise. Proteome Science. 2006;6 doi: 10.1002/pmic.200500928. (2006) [DOI] [PubMed] [Google Scholar]
- 16.Mujezinovic Nedim, Schneider Georg, Wildpaner Michael, Mechtler Karl, Eisenhaber Frank. Reducing the haystack to find the needle: improved protein identification after fast elimination of non-interpretable peptide MS/MS spectra and noise reduction. BMC Genomics. 2010;11 doi: 10.1186/1471-2164-11-S1-S13. (2010) [DOI] [PMC free article] [PubMed] [Google Scholar]
- 17.Nvidia. CUDA Toolkit Documentation v7.5. 2016 (2016). http://docs.nvidia.com/cuda/index.html#axzz42Wi4k0Qc.
- 18.Pisitkun Trairak, Shen Rong-Fong, Knepper Mark. Identification and proteomic profiling of exosomes in human urine. Proceedings of the National Academy of Sciences of the United States of America. 2004;101(36) doi: 10.1073/pnas.0403453101. (2004) [DOI] [PMC free article] [PubMed] [Google Scholar]
- 19.Saeed Fahad, Hoffert Jason D, Knepper Mark A. CAMS-RS: Clustering Algorithm for Large-Scale Mass Spectrometry Data Using Restricted Search Space and Intelligent Random Sampling. IEEE/ACM transactions on computational biology and bioinformatics. 2013;11(1):128–141. doi: 10.1109/TCBB.2013.152. (2013) [DOI] [PMC free article] [PubMed] [Google Scholar]
- 20.Sander Jason, Kandrot Edward. CUDA by Example 2010 [Google Scholar]
- 21.Verheul Henk MW. Mass spectrometry-based proteomics: from cancer biology to protein biomarkers, drug targets, and clinical applications. American Society of Clinical Oncology. 2014 doi: 10.14694/EdBook_AM.2014.34.e504. [DOI] [PubMed] [Google Scholar]
- 22.Zhao Boyang, Pisitkun Trairak, Hoffert Jason D, Knepper Mark A, Saeed Fahad. CPhos: A program to calculate and visualize evolutionarily conserved functional phosphorylation sites. Proteomics. 2012;12(22):3299–3303. doi: 10.1002/pmic.201200189. (2012) [DOI] [PMC free article] [PubMed] [Google Scholar]


