

Abstract
People preferentially imitate others who are similar to them or have high social status. Such imitative biases are thought to have evolved because they increase the efficiency of cultural acquisition. Here we focused on distinguishing between self‐similarity and social status as two candidate mechanisms underlying neural responses to a person's race during imitation. We used fMRI to measure neural responses when 20 African American (AA) and 20 European American (EA) young adults imitated AA, EA and Chinese American (CA) models and also passively observed their gestures and faces. We found that both AA and EA participants exhibited more activity in lateral frontoparietal and visual regions when imitating AAs compared with EAs or CAs. These results suggest that racial self‐similarity is not likely to modulate neural responses to race during imitation, in contrast with findings from previous neuroimaging studies of face perception and action observation. Furthermore, AA and EA participants associated AAs with lower social status than EAs or CAs, suggesting that the social status associated with different racial groups may instead modulate neural activity during imitation of individuals from those groups. Taken together, these findings suggest that neural responses to race during imitation are driven by socially learned associations rather than self‐similarity. This may reflect the adaptive role of imitation in social learning, where learning from higher status models can be more beneficial. This study provides neural evidence consistent with evolutionary theories of cultural acquisition. Hum Brain Mapp 35:1723–1739, 2014. © 2013 Wiley‐Periodicals, Inc.
Keywords: ethnicity, culture, socioeconomic status, fMRI, prefrontal cortex, visual cortex
INTRODUCTION
People preferentially imitate others who they perceive to be similar to themselves or high in status. These imitative biases are thought to increase the efficiency of cultural learning [Boyd and Richerson, 1987]. A person's race can indicate their self‐similarity and social status [Van den Berghe, 1987] and is known to influence whom people imitate. Preferences for own‐race models [Feinman, 1980; Karunanayake and Nauta, 2004; Kelly et al., 2005; King and Multon, 1996; Zirkel, 2002] and higher‐status‐race models [Clark and Clark, 1947; Liebert et al., 1972; Neely et al., 1973; Thelen, 1971] are well documented. Surprisingly, however, the majority of studies on the neural mechanisms of imitation have not considered the race of the person being imitated (the model) [Caspers et al., 2010]. Most prior studies on neural responses to race during face perception and action observation have drawn distinctions between ingroup and outgroup to frame the interpretation of their findings [for reviews see Eberhardt, 2005 and Ito and Bartholow, 2009], suggesting that the neural encoding of another person's race may be based primarily on shared racial group membership. Here we investigated whether neural responses to the model's race during imitation are also modulated by shared racial group membership (similarity hypothesis), or are additionally or instead modulated by the social status associated with different racial groups (status hypothesis), as suggested by status biases in imitative learning. Although additional factors may contribute to neural responses to a model's race during imitation, here we focused on distinguishing between self‐similarity and social status because these are the most theoretically prominent, and empirically well‐documented imitative biases related to the model. Thus, the goal of the present study was to determine which of these hypotheses was better supported by neural responses to race during imitation.
Self‐similarity (i.e., shared group membership), and social status are two important dimensions of intergroup relations. Self‐similarity on a given dimension, such as race, can be used to determine who is part of one's ingroup or outgroup, whereas social status is a hierarchical association with both ingroups and outgroups that results from group comparison [Festinger, 1954]. Although group membership and social status are often studied in isolation experimentally [e.g., Rubin, 2012], these characteristics of real‐world social groups typically coexist and interact in ways that depend on the status of one's own group [Phinney, 1992; Sellers et al., 1998]. Thus, studying shared group membership and group social status together in individuals from both low‐ and high‐status groups has the potential to provide valuable additional insight into the mechanisms of real‐world intergroup processes. For example, [Tajfel, 1974] discusses conditions under which intergroup behaviors prompted by shared group membership and a group's social status may be in conflict and highlights that for individuals from low‐status groups, in‐group favoritism and the desire for higher status can be at odds. Group membership and social status have also recently begun to be studied at the neural level, both independently and together. These studies have demonstrated that others' group membership and social status are encoded by a number of different neural systems [e.g., Chiao et al, 2009; Van Bavel et al., 2008], and that this encoding can differ based on cultural norms about social status and intergroup relations [Cheon et al., 2011].
As stated previously, the nature of intergroup processes can differ based on one's own group membership. For example, African Americans have been found to identify more strongly with their racial group than do European Americans [Phinney, 1992; Sellers et al., 1998], perhaps due to African American's minority status or the lower social status associated with this group. This phenomenon has been investigated at the neural level in two recent studies [Mathur et al., 2010, 2012] that also replicated this behavioral finding. Mathur et al. [2010] found that African Americans uniquely recruited the medial prefrontal cortex (MPFC), a region that has been associated with self‐referential thought, when observing ingroup versus outgroup members in pain and, further, that activity within this MPFC region was predicted by the degree of identification with one's racial ingroup [Mathur et al., 2012]. Together, these studies suggest that a complete understanding of the behavioral and neural processes underlying intergroup relations requires studying individuals from multiple groups that differ in social status.
Previously [Losin et al., 2011], we used fMRI to measure neural activity while European American (EA) participants imitated EA, African American (AA) and Chinese American (CA) models. Participants exhibited more activity in lateral fronto‐parietal and visual regions when imitating AA compared with EA models. Activity did not follow the same pattern, however, when participants imitated members of the other racial outgroup (CA) compared with their ingroup (EA). Therefore, it was unclear whether more activity during imitation of AAs was due to their membership in a racial outgroup, consistent with the similarity hypothesis, or the fact that AAs are typically perceived to be lower in social status than EAs or CAs [Fiske et al., 2002, 1999], consistent with the status hypothesis.
To disentangle these two possibilities, here we collected data in a sample of AA participants performing the same tasks and directly compared the results to those previously observed in our sample of EA participants. This comparison allowed us to clearly distinguish between the similarity and status hypotheses. This is because although AAs are the racial group in our stimuli typically perceived to be the lowest in status by both EAs and AAs, the AA models were a racial ingroup to one group of participants (AAs) and a racial outgroup to the other (EAs). Furthermore, we compared race effects during imitation to those during face perception and action observation. These comparisons allowed us to determine whether the same neural regions previously found to exhibit racial similarity effects when people passively view the faces and actions of others are instead modulated by race‐associated status during imitation, or alternatively whether racial similarity and race‐associated status are simply encoded by different neural regions.
METHODS
Participants
Participants were 20 (10 males) right‐handed, 18‐ to 30‐year‐old African Americans (AAs). We compare these participants to a prior sample of 20 (10 males) right‐handed, 18‐ to 26‐year‐old European American (EA) participants whose data were previously reported in [Losin et al., 2011]. The two racial groups were matched in age, handedness (Edinburgh Handedness Inventory, [Oldfield, 1971]) and socioeconomic status (participant's self‐reported jobs were converted to a numerical score using the nine job categories in the Barratt Simplified Measure of Social Status [Barratt, 2005] and added to their years of education). See Table 1 for group demographic means and between‐group comparisons. Participants were recruited through free online bulletins (e.g., Craigslist), university (UCLA) e‐mail lists, and local newspapers. Participants had normal or corrected‐to‐normal vision and reported using no medication or drugs (other than oral contraceptives), no heavy use of alcohol, and no prior or concurrent diagnosis of any neurological, psychiatric, or developmental disorder. The study was approved by the UCLA Institutional Review Board. Participants were compensated for their participation and written informed consent was obtained from all participants.
Table 1.
Participant demographics by race
| Measure | EA mean | SD | AA mean | SD | P |
|---|---|---|---|---|---|
| Age (yr) | 23.06 | 2.14 | 23.10 | 2.98 | 0.96 |
| Handedness (1 = right, −1 = left) | 0.69 | 0.18 | 0.69 | 0.26 | 0.98 |
| Socioeconomic status | 22.11 | 2.85 | 20.53 | 2.93 | 0.10 |
Handedness scores are from the (Edinburgh Handedness Inventory, [Oldfield, 1971]). Socioeconomic status scores were calculated by converting participants' self‐reported jobs to a numerical score using the nine job categories in the Barratt Simplified Measure of Social Status [Barratt, 2005] and adding them to their self‐reported years of education. P values are the result of two‐tailed independent sample t‐tests between the AA and EA participants.
Hand Sign Imitation Paradigm
The same fMRI task used with EA participants in [Losin et al., 2011] was also used with the AA participants in the present study. Stimuli in this task were waist‐up color videos of 12 models (six males), of three different ethnicities (EA, AA, and Chinese American (CA)). Group differences will be discussed in terms of “race” because this is the construct most likely perceived by participants based on visual information alone. Furthermore, we took a number of steps to minimize the salience of individual actors in favor of racial category‐level information, as the reported race‐related imitative biases we intended to study are suggested to result from the social status stereotypically associated with a person's racial group rather than individual‐level status associations. These steps included, (1) having four models from each racial group (which we averaged across in our analyses), (2) matching models both within and between racial groups on attractiveness and how typical their appearance was perceived to be for their ethnic group (based on ratings from a separate group of subjects), (3) having actors wear the same clothing and standardizing other aspects of their appearance, e.g. no glasses, no piercings, no makeup, etc.
Models performed 16 bimanual, symmetrical hand signs derived from New Zealand Sign Language that were described as meaningless to both models and participants. Stimuli were presented in the following four conditions: (1) imitate gesture, in which participants imitated the models performing the hand signs during the video presentation, (2) observe gesture, in which participants passively observed the models performing hand signs, (3) view portrait, in which participants passively viewed still portraits of each model, and (4) baseline, in which participants fixated on a black cross in the center of a white screen (Fig. 1a). Participants were cued to either imitate or passively observe the stimuli by a colored border (green for imitation, red for observation only).
Figure 1.
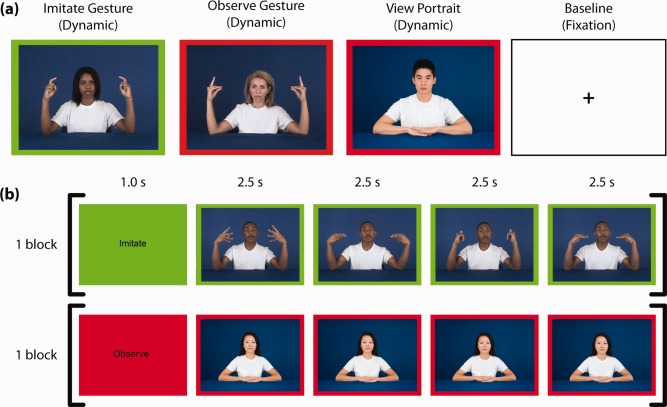
Experimental stimuli and task design. (a) Example stimuli from 4 experimental conditions (Gesture imitation stimuli have green borders indicating participants should imitate and gesture observation and portrait viewing stimuli have red borders indicating participants should passively observe). (b) Examples of block structure from the imitate gesture (first row) and view portrait (second row) conditions. [Color figure can be viewed in the online issue, which is available at http://wileyonlinelibrary.com.]
Four stimuli of the same condition and portraying the same model were presented in a block (Fig. 1 b). An instruction screen that was either green with the word “imitate” or red with the word “observe” preceded all blocks. Stimulus blocks were organized into four balanced runs, such that each model, each hand sign, and each condition were seen an equal number of times in each run. Five 22.5‐s baseline blocks were evenly spaced throughout each run. Over the course of the experiment, each participant saw 64 stimuli (16 blocks) portraying models from each of the three racial groups in each of the three conditions. The presentation order of these blocks was pseudorandomized within a run, ensuring that two models of the same gender, same race or making the same hand sign did not appear consecutively. A unique pseudorandomized stimulus order was created for each participant. Total task time was 55 min (13:45/run). Before scanning, each participant completed two training tasks: a hand sign familiarization task during which participants imitated each sign in slow motion and then at full speed, and a task structure familiarization during which participants performed one block of each task condition.
Self‐Report and Behavioral Measures
In order to assess whether participants from both racial groups perceived the stimuli and performed the imitation task in a similar way, we collected participants' ratings of the attractiveness of the models and also assessed the accuracy of their imitation while in the scanner. Measures of model attractiveness were collected immediately following the scanning session. Participants viewed the still portraits of each stimuli model on a laptop in the order they first appeared in the scanner. They were asked to “rate how attractive each person is”. Ratings were made on a visual analogue scale depicted under each portrait that ranged from 1 “very unattractive” to 9 “very attractive,” with “average” as the scale mid‐point. An average of the attractiveness ratings for the four models from each racial group for each participant was entered into a linear mixed effects model (lme) in R [R Development Core Team, 2010] in which participant race and model race were fixed factors and participant was a random factor.
Task compliance and hand sign imitation accuracy was assessed during fMRI data acquisition by watching the participants' hands through the control room window. During the gesture imitation blocks, hand sign imitation accuracy was assessed for 16/20 EA participants and 20/20 AA participants (for the remaining four EA participants the performance of imitation was verified, but not rated). Each sign was assigned a rating of 2 if the sign was imitated correctly, a rating of 1 if the sign was imitated but with errors, and a rating of 0 if the sign was not imitated. Imitation accuracy was compared between groups for the percentage of hand signs receiving each accuracy rating in each participant (averaged across four runs) using two‐tailed independent‐samples t‐tests.
We also collected self‐report measures on the two behavioral factors of interest: participant's feelings of similarity to the models from each racial group and the social status they associated with each racial group represented in the stimuli. We collected these measures in order to verify whether both groups of participants felt more similar to own‐race models [Bandura, 1977; Karunanayake and Nauta, 2004; Tarr and Gauthier, 2000] but rated AAs as lower status than EAs and CAs regardless of their own race [Dunham et al., 2006; Wong et al., 1998], as predicted based on the literature. Participants' feeling of similarity to the stimuli models were assessed using the same procedure used to assess their perception of model attractiveness. While viewing portraits of each model, each participant was asked to “rate how similar you feel each person is to you” on a scale from 1 “very dissimilar to me” to 9 “very similar to me.”
Social status is a multidimensional construct including both subjective and objective components [Adler et al., 2000; Henrich and Gil‐White, 2001]. We did not have an a priori hypothesis as to whether objective or subjective social status would most closely relate to racial modulation of neural activity during imitation. Therefore, we measured both the objective and subjective social status that participants associated with the different racial groups in the fMRI task. We used the Barratt Simplified Measure of Social Status (BSMSS) [Barratt, 2005] and the MacArthur Scale of Subjective Social Status (MSSSS) [Adler et al., 2000], both of which we modified to apply to the different racial groups represented in the stimuli (rather than to the self). For both measures we used the terms white, black and Asian rather than European American, African American and Chinese American, as these broad racial categories were those most likely perceived by participants during the fMRI task based on visual information alone.
The BSMSS [Barratt, 2005] is a version of the widely used Hollingshead Four Factor Index of Social Status [Hollingshead, 1975] with updated job categories. For this measure, participants were asked to choose which level of education and which type of job they most closely associated with the different United States racial groups represented in the stimuli. Participants were given seven choices for education ranging from 1 “less than 7th grade” to 7 “graduate degree” and nine groups of occupations ranging from 1, a group that included day laborers and house cleaners, to 9, a group that included physicians and attorneys. Participants' choices on these two measures were multiplied by the factor weight of 3 for occupation and 5 for education and then summed to get a composite objective SES score that ranged from 8 to 66. The Hollingshead Four Factor Index of Social Status has been found to have substantial inter‐rater reliability with a Cohen's kappa value of 0.68.
In the MSSSS [Adler et al., 2000], participants were shown a picture of a ladder with ten rungs and instructed to “think of the ladder as representing where different groups stand in the United States.” They were told that “at the top of the ladder are the groups that are the best off—those who have the most money, the most education and the most respected jobs” and that “at the bottom are the groups that are the worst off—who have the least money, least education, and the least respected jobs or no jobs.” They were asked to select the ladder with the red arrow pointing to the rung where they thought each racial group represented in the study (white, black, and Asian) stands relative to other racial groups in the United States. The MSSSS has been found to predict outcomes such as psychosocial and health measures above and beyond objective measures of SES [Cundiff et al., 2011]. Thus, the MSSSS likely captures important aspects of social status not accounted for by the BSMSS. The MSSSS has also been found to have adequate test‐retest reliability (Spearman's rank correlation) ρ = 0.62 (P < 0.01) [Operario et al., 2004].
Social status measures were collected from 15 EA and 14 AA participants through an online survey subsequent to the fMRI data collection. In order to test for the predicted patterns of racial self‐similarity and status, we entered individual participant scores on these measures as the dependant measures in separate linear mixed effects models (command: lme) in R [R Development Core Team, 2010]. For these analyses, participant race and model race were fixed factors and participant was a random factor. We performed post‐hoc pair‐wise comparisons to assess any interactions using Tukey's Honestly Significant Difference (HSD) test.
Finally, we assessed the influence of participants' reports of subjective and objective race‐associated status (SSS and SES) and their similarity to the models on imitation accuracy. We did so by computing separate generalized linear mixed effects models (command: lmer) in R [R Development Core Team, 2010], with imitation accuracy as the dependent measure, our measures of interest (SSS, SES, or similarity) as fixed factors, and participant and model as crossed random factors. In order to allow a more intuitive interpretation of results, we reverse‐coded accuracy scores so that the numbers corresponded to the number of imitation errors (0—no errors, 1—one imitation error, and 2—no imitation, or two errors). For statistical models focused on the influence of race‐associated status on imitation accuracy, our dependent measure was the number of imitation errors summed over the four actors (16‐hand signs each) from a given racial group (participants provided one status rating per racial group and thus we did not enter the actor's race into the statistical model). For statistical models focused on the influence of the models' perceived self‐similarity on imitation accuracy, our dependent measure was the number of imitation errors summed over the 16 hand signs from each actor because participants provided a similarity rating for each actor (both similarity and the actor's race were included into this statistical model).
MRI Data Acquisition
Data were collected using a 3 T Siemens Trio whole‐body MRI scanner at the UCLA Ahmanson‐Lovelace Brain Mapping Center. The following scans were performed on each participant: (1) four functional echo‐planar imaging (EPI) scans (3 × 3 × 4 mm voxels, TR: 2,250 ms, TE: 28 ms, slices: 34, flip angle: 90 degrees, FoV read: 192 mm, echo spacing: 47 ms, bandwidth: 2442 Hz/Px, time: 13:45); (2) one co‐planar high resolution T2‐weighted structural scan (1.5 × 1.5 × 4 mm voxels, TR: 5,000 ms, TE: 34 ms, slices: 34, flip angle: 90 degrees, FOV Read: 192 mm, echo spacing: .89 ms, bandwidth: 1302 Hz/Px, time: 1:30); (3) one high resolution T1‐weighted magnetization‐prepared rapid gradient echo (MPRAGE) structural scan (1 × 1 × 1 mm voxels, TR: 1,900 ms, TE: 2.26 ms, Flip angle: 90 degrees, Tl: 900 ms, FoV Read: 250 mm, echo spacing 6.9 ms, bandwidth: 200 hz/px, time: 6:50).
MRI Data Analysis
Data analyses were performed using FSL version 4.1.6 (Centre for Functional Magnetic Resonance Imaging of the Brain software library; available at: http://www.fmrib.ox.ac.uk/fsl) [Smith et al., 2004], AFNI [Cox, 1996] and the Automatic Registration Toolbox (ART, [Ardekani et al., 1995]). Functional data were preprocessed by skull‐stripping (AFNI), realignment to the mean functional image (FSLs MCFLIRT), temporal filtering with a high‐pass filter cutoff of 100 s (FSL), and spatial smoothing with a 6 mm full width half maximum Gaussian kernel in three dimensions (FSL).
Although head motion was low (∼0.7 mm maximum relative displacement) and did not differ between groups (see Table 2 for group means and between‐group comparison), several data quality control measures were implemented before statistical analysis. In addition to standard realignment for motion correction, we also removed the effects of volumes exhibiting an unusual amount of residual intensity change (i.e. artifacts due to sudden movements during volume acquisition). We did so by using a modified version of the fsl_motion_outliers script that calculated the root mean square error of each voxel's time‐series and created nuisance regressors for volumes where the volume‐average root mean square error was greater than 0.2 SD (which approximated the threshold for visually identifying motion artifacts). We excluded any runs from which more than 25 volumes were removed (4 and 6 of 80 runs for EA and AA participants, respectively). From the EA group, we also previously removed one male participant (all four runs) and the fourth (last) run from two other participants due to hardware failures during data collection. These quality control measures resulted in a total of 70 runs from 19 EA participants (10 females) and 74 runs from 20 AA participants being utilized in the present statistical analyses. Within these runs, less than 1.5% of 362 volumes per run were removed due to motion artifacts in each group and the groups did not differ in the number of volumes removed (See Table 2 for group means and between‐group comparisons).
Table 2.
Participant task‐related self‐report and behavioral measures
| Measure | EA mean | SD | AA mean | SD | P |
|---|---|---|---|---|---|
| Attractiveness EA models | 5.58 | 1.01 | 5.21 | 1.09 | 0.93 |
| Attractiveness AA models | 5.5 | 0.92 | 6.06 | 1.42 | 0.67 |
| Attractiveness CA models | 5.59 | 1.01 | 5.58 | 1.56 | 1 |
| Signs imitated correctly (%) | 94.08 | 5.07 | 95.61 | 4.22 | 0.33 |
| Signs imitated with errors (%) | 5.81 | 5.13 | 4.14 | 4.19 | 0.29 |
| Signs not imitated (%) | 0.11 | 0.21 | 0.25 | 0.68 | 0.41 |
| Mean relative displacement (mm) | 0.08 | 0.04 | 0.07 | 0.04 | 0.59 |
| Max. relative displacement (mm) | 0.65 | 0.62 | 0.70 | 0.71 | 0.64 |
| Motion excluded volumes | 5.26 | 6.39 | 4.45 | 5.42 | 0.41 |
Model attractiveness scores are participant's self‐reported ratings of the attractiveness of each model (made while looking at a portrait of that model) averaged across the four models form each racial group. Attractiveness ratings were made on a scale from 1 (very unattractive) to 9 (very attractive). Imitation accuracy scores are the percentage of hand signs receiving each accuracy rating (sign imitated correctly = 2, sign imitated with error = 1, and sign not imitated = 0). Motion excluded volumes are the average number of volumes (out of 362) excluded per run. P values for attractiveness ratings reflect between‐group comparisons performed using Tukey's Honestly Significant Difference (HSD) test after all attractiveness scores were entered into a linear mixed effects model (lme) in R in which subject race and model race or racial group were fixed factors and participant was a random factor. All other P values come from two‐tailed independent sample t‐tests between the AA and EA participants.
Statistical analyses were performed at the single subject level using a general linear model (GLM) with FSLs fMRI Expert Analysis Tool (FEAT). We examined neural activity related to the race of the model in the AA participants using the same statistical model previously applied to the EA participants [Losin et al., 2011]. The time courses of blocks containing each racial group of models (EA, AA, CA), in each condition (imitate gesture, observe gesture, view portrait), were convolved with a canonical double‐gamma hemodynamic response function and included as regressors in the GLM. The five 22.5‐s rest blocks were used as the implicit baseline.
In order to investigate race effects in each condition, all possible pairwise contrasts of model racial groups were estimated for each condition (e.g., imitate gesture EA > imitate gesture AA) and each racial group of models was also compared with the fixation baseline for each condition (e.g. imitate gesture EA > baseline). Additionally, in order to determine whether race effects during gesture imitation differed from those during the non‐imitative conditions, interaction contrasts were estimated by subtracting each pairwise racial contrast for the observe gesture or view portrait condition from the same contrast for the imitate gesture condition (e.g., imitate gestureAA > EA > observe gestureAA > EA).
First level contrast estimates were computed for each run and contrast estimates for each subject were computed by averaging over the four runs, treating each run as a fixed effect. For group analysis, contrast estimates were registered to standard space (Montreal Neurological Institute, MNI) in three stages. The mean volume of each run of individual EPI data was registered to the in‐plane high‐resolution T2‐weighted image (3‐parameter affine) and, in turn, to the T1‐weighted MPRAGE (7‐parameter affine) using FSLs FLIRT. Finally, registration of the MPRAGE to MNI space (FSLs MNI Avg152, T1 2 × 2 × 2mm) was carried out with FLIRT (12‐parameter affine) and refined using ART (non‐linear transformation). Group level analyses were then performed to calculate a group mean for each contrast for each racial group of subjects and between‐racial‐group differences using FSLs FLAME stages 1 and 2. All analyses were performed across the whole‐brain. Group images were thresholded at Z > 2.3 corrected for multiple comparisons using cluster‐based Gaussian random field theory controlling familywise error across the whole‐brain at P = 0.05. Peak activation coordinates were determined using an automated search for relative maxima with a minimum separation of 15 mm. Coordinates with the highest Z value within an individual anatomical region (determined using FSL Harvard‐Oxford atlas) are reported in tables.
RESULTS
Behavioral and Self‐Report Measures
We first assessed whether any between‐group differences existed in participants' perceptions of actor attractiveness or imitation accuracy in order to rule out these possible confounds to interpretation of the race effects of interest. Our analysis revealed that participants' assessments of actor attractiveness did not vary based on the race of the model or their own race, nor was there a significant interaction between these factors (all P > 0.05; Table 2). These data suggest that both EA and AA participants viewed the models they observed and imitated in a similar way despite the participants' own different racial group membership. Thus, it is highly unlikely that differences in perceived model attractiveness account for any observed race effects. We also found that imitation accuracy was high in both groups (>94% of signs receiving the highest accuracy rating), and did not differ between groups (see Tables 2 for group means and between‐group comparisons). Equivalent imitative performance indicates that participants in both groups were able to accurately perform the hand sign imitation task and that task performance is unlikely to confound the interpretation of any observed between‐group differences. Because we were primarily interested in neural activity related to imitation of different models and because of the extremely low rate of imitation errors, we retained all data in the fMRI analyses.
We next investigated participants' feelings of similarity to the different models and their assessment of the social status typically associated with the different racial groups represented in the stimuli. We did so in order to verify that participants' self reports on these measures matched those previously reported in the literature on which our neural predictions for the similarity and status hypotheses were based. Specifically, based on prior literature [Bandura, 1977; Karunanayake and Nauta, 2004] we predicted that participants would report feeling more similar to the models from their own racial group. Consistent with this prediction, we found that participants' feelings of similarity to the models did vary based on model race, F (2,74) = 12.53, P < 0.0001, and that the effects of model race varied based on the participant's own race (subject race × model race interaction) F (2,74) = 39.77, P < 0.0001. Pairwise comparisons (Tukey's HSD) revealed that, as predicted, this interaction resulted from participants feeling more similar to models from their own racial group than models from each of their two respective racial outgroups (EA and CA models for AA participants, and AA and CA models for EA participants) (Fig. 2a).
Figure 2.
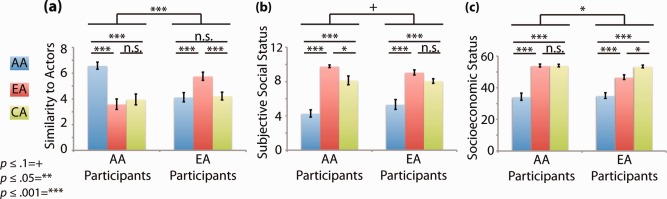
Results from self‐report measures of racial self‐similarity and social status in both AA and EA participants. (a) Participants' ratings of their feelings of similarity to stimuli models from the different racial groups (made while looking at model portraits) on a scale from 1 (very dissimilar to me) to 9 (very similar to me). (b) Participants' ratings of the socioeconomic status associated with each of the racial groups represented in the stimuli using a modified version of the MacArthur Scale of Subjective Social Status (MSSSS) [Adler et al., 2000]. (c) Participants' ratings of the socioeconomic status associated with each of the racial groups represented in the stimuli obtained using a modified version of the Barratt Simplified Measure of Social Status (BSMSS) [Barratt, 2005]. Individual participant values for each measure were entered into a linear mixed effects model (lme) in R [Development Core Team, 2010] in which subject race and model race or racial group were fixed factors and participant was a random factor. Upper significance bar indicates a participant race x model race or racial group interaction. Lower significance markers are the result of post hoc pairwise comparisons made using Tukey's Honestly Significant Difference (HSD) test. Error bars are standard error. [Color figure can be viewed in the online issue, which is available at http://wileyonlinelibrary.com.]
We also made predictions about participants' assessment of the social status associated with the different racial groups of the models represented in the stimuli (white, black, and Asian) based on prior studies [Dunham et al., 2006; Fiske et al., 2002, 1999; Freeman et al., 2011; Penner and Saperstein, 2008; Wong et al., 1998]. We predicted that (1) participants would rate the status associated with each of these racial groups similarly, regardless of their own race [Dunham et al., 2006; Wong et al., 1998] and (2) participants would rate blacks as being associated with lower status than either whites [Freeman et al., 2011; Penner and Saperstein, 2008] or Asians [Fiske et al., 2002, 1999] while the latter two groups would be rated as being similar in status [Wong et al., 1998]. Consistent with our first prediction, we found no main effect of participants' race on their assessment of the subjective social status (SSS) or socioeconomic status (SES) associated with the different racial groups represented in the stimuli (all P > 0.8). Consistent with our second prediction, we found a significant effect of model race on perceived SSS F (2,54) = 80.84, P < 0.0001, and SES F (2,54) = 94.01, P < 0.0001 such that both groups of participants rated blacks as being associated with lower SSS and SES than either whites or Asians (Fig. 2b,c).
Although status ratings for whites and Asians were closer to one another than to those for blacks, some significant differences between white and Asian status ratings were found. For the SSS measure, AA participants rated whites as being associated with higher social status than Asians while EA participants' ratings of the status of whites and Asians were not significantly different. This difference resulted in participant race x racial group interaction that approached significance F (2,54) = 2.89, P = 0.06. For the SES measure, AA participants rated the SES of whites and Asians as equivalent while EA participants rated Asian SES as higher than white SES. This difference resulted in a participant race × racial group interaction for SES F (2,54) = 4.6, P = 0.02. Despite these interactions due to inconsistencies in the assessment of the relative status of whites compared with Asians, data from both status measures largely fit the predicted pattern of similar ratings of race‐associated status regardless of the participant's race and higher status ratings for whites and Asians than for blacks. Taken together, these data suggest that our participants self reports of racial similarity and race‐associated status were consistent with those reported in the literature supporting our neural predictions based on racial self‐similarity and status.
Finally, we investigated whether participants' reports of subjective and objective race‐associated status (SSS and SES) and their similarity to the models influenced imitation accuracy. Given evidence that people preferentially imitate those whom they perceive to be similar to themselves (from their own group) or from high status groups [Feinman, 1980; Karunanayake and Nauta, 2004; Kelly et al., 2005; King and Multon, 1996; Clark and Clark, 1947; Liebert et al., 1972; Neely et al., 1973; Thelen, 1971; Zirkel, 2002], we predicted that participants would make more errors when imitating those from racial groups they perceived to be lower in status, or those they perceived to be less similar to themselves due to less experience with imitation of these models in daily life. Furthermore, based on our prior imaging evidence of differential neural responses during imitation to actors from different racial outgroups, we predicted that social status would be more influential on imitation accuracy than self‐similarity. Consistent with our prediction, we found a significant main effect of SSS on imitation accuracy, b = −0.05, t (1) = −2.18, P = 0.03 and a nonsignificant trend of SES, b = −.01, t (1) = −1.43, P = 0.16, such that participants made more errors imitating actors from racial groups they associated with lower social status (no main effect of, or interaction with, the subject's race, all P > 0.5). Again, consistent with our prediction, we found no effects of model self‐similarity or interactions with subject race on imitation accuracy (all P > 0.2); only a main effect of model race was observed (model comparison χ2 (2) = 8.38, P = 0.02) such that participants made the most errors when imitating AA models (M = 0.98), fewer errors when imitating EA models (M = 0.76; AA vs. EA: P = 0.17), and the least errors when imitating CA models (M = 0.57; EA vs. CA: P = 0.03, AA vs. CA: P < 0.0001). These results are consistent with our hypothesis that participants had more difficulty imitating those from racial groups they perceive to be lower in social status, and that social status is more influential on imitation accuracy than self‐similarity.
Effects of Model Race During Imitation in AA Participants
We first examined which neural systems were modulated by the model's race during imitation in our AA participants. To do so we compared imitation of actors from the three different racial groups. Out of all possible pair‐wise racial comparisons, significant differences were found during imitation of AA > EA, AA > CA, and EA > CA models, the same three racial comparisons where differences were previously observed in our EA sample [Losin et al., 2011]. Also similar to what we previously found for the EA participants, we found increased activity during imitation of AA models compared with either EA or CA models in an extended bilateral network of regions previously shown to be important for imitation by a recent, large meta‐analysis [Caspers et al., 2010], including the inferior frontal gyrus and neighboring premotor cortex, the inferior and superior parietal lobules and visual regions including the fusiform gyrus and inferior and superior lateral occipital cortex (Fig. 2a,b, blue and green activity Table 3). In contrast, there was an absence of neural differences between imitation of EA and CA models in lateral fronto‐parietal regions. Instead, differences were observed mainly in primary and secondary visual regions (V1–V3) and the fusiform gyrus, with more activity present during imitation of EA compared with CA models (Fig. 2c, blue and green activity).
Table 3.
Anatomical regions differentiating between model races during imitation for AA participants
| Anatomical region | Side | x | y | z | Z |
|---|---|---|---|---|---|
| Imitate AA models > imitate EA models | |||||
| Superior frontal gyrus | L | −2 | 54 | 40 | 4.03 |
| Inferior frontal gyrus, po | R | 58 | 16 | 30 | 3.74 |
| Frontal pole | R | 54 | 44 | 8 | 3.18 |
| Postcentral gyrus | R | 48 | −24 | 42 | 3.37 |
| Supramarginal gyrus, ad | L | −44 | −38 | 42 | 3.35 |
| Temporal occipital fusiform | R | 36 | −42 | −20 | 4.60 |
| Temporal pole | L | −42 | 24 | −28 | 3.45 |
| Middle temporal gyrus, pd | R | 68 | −8 | −16 | 3.43 |
| Middle temporal gyrus,to | R | 64 | −50 | −8 | 3.06 |
| Lateral occipital cortex, sd | L | 44 | −80 | 18 | 4.69 |
| R | 28 | −60 | 42 | 4.00 | |
| Lateral occipital cortex, id | L | −36 | −66 | −14 | 5.40 |
| R | 38 | −74 | −12 | 5.74 | |
| Occipital pole | L | −34 | −94 | 0 | 4.53 |
| R | 14 | −88 | 34 | 3.46 | |
| Intracalcarine cortex | R | 14 | −76 | 6 | 3.20 |
| Amygdala | L | −20 | −4 | −20 | 3.80 |
| R | 20 | −6 | −14 | 4.69 | |
| Parahippocampal Gyrus, pd | L | −16 | −34 | −4 | 3.17 |
| Thalamus | R | 16 | −28 | 10 | 2.89 |
| Imitate AA models > imitate CA models | |||||
| Inferior frontal gyrus, po | R | 38 | 10 | 26 | 4.35 |
| Frontal pole | L | −2 | 64 | 24 | 3.76 |
| Precentral gyrus | L | −40 | 2 | 30 | 3.61 |
| R | 38 | −2 | 54 | 3.50 | |
| Frontal orbital cortex | L | −28 | 36 | 2 | 2.90 |
| R | 32 | 32 | −18 | 3.55 | |
| Paracingulate gyrus | L | −4 | 12 | 50 | 3.34 |
| Middle frontal gyrus | L | −32 | −4 | 62 | 3.16 |
| Superior frontal gyrus | L | −18 | 38 | 44 | 3.12 |
| Superior parietal lobule | L | −34 | −54 | 56 | 4.34 |
| Supramarginal gyrus, pd | R | 44 | −36 | 50 | 4.08 |
| Postcentral gyrus | L | −40 | −28 | 42 | 3.65 |
| R | 62 | −16 | 28 | 3.36 | |
| Angular gyrus | R | 56 | −50 | 24 | 3.28 |
| Amygdala | L | −16 | −8 | −14 | 4.30 |
| R | 18 | −6 | −14 | 4.60 | |
| Inferior temporal gyrus, to | R | 58 | −54 | −18 | 3.67 |
| Middle temporal gyrus, ad | R | 64 | −6 | −18 | 3.62 |
| Temporal pole | L | −38 | 20 | −24 | 3.34 |
| Occipital fusiform gyrus | R | 36 | −74 | −10 | 6.06 |
| Temporal occipital fusiform | L | −34 | −62 | −16 | 5.83 |
| Lateral occipital cortex, sd | L | −28 | −74 | 24 | 5.23 |
| R | 32 | −78 | 20 | 5.17 | |
| Occipital pole | L | −32 | −94 | −4 | 4.38 |
| Supracalcarine cortex | L | −4 | −86 | 10 | 3.72 |
| Lingual gyrus | R | 18 | −40 | −4 | 3.43 |
| Cerebellum | L | −6 | −84 | −42 | 3.61 |
| R | 34 | −74 | −54 | 3.63 | |
| Cingulate gyrus, pd | L | −4 | −48 | 32 | 4.00 |
| Precuneus cortex | L | −2 | −80 | 40 | 3.74 |
| Imitate EA models > CA models | |||||
| Superior frontal gyrus | L | −24 | 6 | 58 | 3.03 |
| R | 12 | 16 | 70 | 3.37 | |
| Paracingulate gyrus | 0 | 46 | 26 | 3.25 | |
| Postcentral gyrus | L | −6 | −48 | 68 | 3.44 |
| Cingulate gyrus, pd | R | 10 | −38 | 42 | 3.19 |
| Precuneus | R | 18 | −68 | 42 | 2.51 |
| Cuneal cortex | R | 8 | −84 | 18 | 3.94 |
| Occipital fusiform gyrus | L | −28 | −78 | 16 | 3.55 |
| Lateral occipital cortex, sd | L | −22 | −70 | 52 | 3.52 |
| Temporal occipital fusiform | L | −32 | −54 | −16 | 3.24 |
| Occipital fusiform gyrus | L | −18 | −88 | −14 | 3.09 |
| Caudate | R | 10 | 6 | 10 | 3.30 |
| Cerebellum | 0 | −62 | −16 | 3.77 | |
Bolded regions are those where a corresponding local maximum in the EA group fell in the same anatomical region. Local maxima were the highest Z values within activated regions falling at least 15 mm apart. Anatomical regions for each maximum were assigned using the Harvard‐Oxford Cortical and Subcortical probabilistic atlases. Only the first maximum within each anatomical region on each side of the brain is listed. Maxima are grouped by lobe in the following order: frontal, parietal, temporal, occipital, subcortical, cerebellum. po = pars opercularis, ad = anterior division, sd = superior division, id = inferior division, to = temporooccipital part.
Effects of Model Race During Imitation in AA vs. EA Participants
In order to discriminate between the similarity and status hypotheses, we next investigated whether the effects of the model's race on neural activity during imitation varied based on the race of the imitator. We did so by directly comparing model race effects during imitation between the AA participants to those previously observed in the EA participants. The status hypothesis predicts that the effect of the model's race will be similar regardless of the participants' own race as assessments of race‐associated status are typically invariant of the race of the assessor [Dunham et al., 2006; Wong et al., 1998], largely consistent with the status ratings of our own participants. In contrast, the similarity hypothesis predicts a model race x subject race interaction such that AA participants would exhibit more activity in response to imitating one or both of their racial outgroups (EA or CA), just as had been the case for the EA participants [Losin et al., 2011].
In support of the status hypothesis, we found that the effect of the model's race did not differ between AA and EA participants for two out of the three racial comparisons exhibiting these effects in each group (imitating AA vs. CA models and imitating EA vs. CA models). Furthermore, we found only a single cluster exhibiting differential responses between AA and EA participants for the third racial comparison, imitating AA vs. EA models. This cluster was located in the pre‐supplementary motor area (pre‐SMA) and extended into the anterior cingulate cortex (ACC) (Fig. 3d, Table 4). Plotting average parameter estimates extracted from this cluster (for imitation of AA and EA models compared with baseline) revealed greater activity during imitation of EA models for AA participants, and AA models for EA participants. In order to gain further insight into neural responses to race within this region, we also extracted parameter estimates for imitation of CA models and compared them with those for the other two racial groups using two‐tailed paired t‐tests (Fig. 3d). Both groups of participants exhibited no difference between imitation of CA models and models form their own racial group and less activity during imitation of CA models and their other racial outgroup (EA models for AA participants and AA models for EA participants), suggesting effects of model race within the pre‐SMA and ACC were not simply related to shared group membership.
Figure 3.
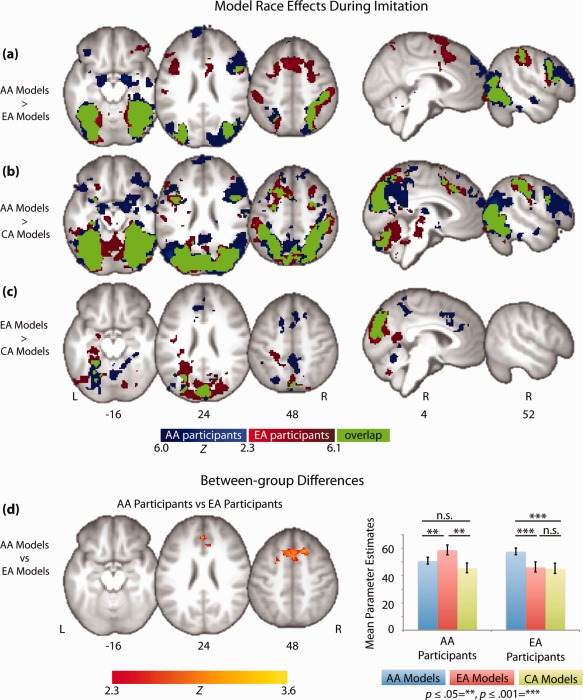
Comparison between neural regions differentiating between imitation of models from three different racial groups: European American (EA), Chinese American (CA), and African American (AA), in AA and EA participants. Functional activity is thresholded at Z > 2.3 with whole‐brain correction for multiple comparisons applied at the cluster level (P < 0.05), and overlaid on an average T1‐weighted structural scan across both groups of participants (n = 39). Values under brains represent the MNI coordinate of the axial (z) or sagittal slice (x). L = left and R = right side of the brain. (a–c) Whole‐brain racial comparisons yielding significant differences from all possible pairwise racial comparisons in AA participants (dark blue activity), EA participants (dark red activity) and their overlap (green activity). (d) Results from the only between‐group comparison (i.e. participant race x model race interaction) that yielded a significant difference during imitation. Parameter estimates are averaged across the entire significant cluster from the four conditions contributing to the interaction compared with baseline (red bars= EA models and blue bars = AA models). For comparison, parameters are also extracted from the same region for imitation of the CA group compared with baseline (green bars). Error bars represent within subject standard error of the mean, calculated with Cousineau's adaptation of Loftus & Masson's method with Morey's correction [Cousineau, 2005; Loftus and Masson, 1994; Morey, 2008].
Table 4.
Between‐group differences in anatomical regions differentiating between model races during imitation (two‐way interactions) and their differences with the non‐imitative conditions (three‐way interactions)
| Anatomical Region | Side | x | y | z | Z |
|---|---|---|---|---|---|
| AA participants vs. EA participants | |||||
| Two‐way interaction | |||||
| Imitate AA Actors vs. Imitate EA Actors | |||||
| Superior frontal gyrus | R | 16 | −8 | 60 | 3.62 |
| Superior frontal gyrus | L | −24 | 6 | 62 | 3.22 |
| Cingulate gyrus, ad | L | −2 | 6 | 40 | 3.32 |
| Three‐way interactions | |||||
| Imitate AA actors vs. imitate EA actors | |||||
| Gesture imitation > gesture observation | |||||
| Temporal occipital fusiform | R | 34 | −50 | −10 | 3.54 |
| Lateral occipital cortex, id | R | 52 | −62 | 14 | 3.14 |
| Occipital pole | R | 30 | −92 | −4 | 3.11 |
| Imitate AA actors vs. imitate EA actors | |||||
| Gesture imitation > portrait viewing | |||||
| Occipital fusiform gyrus | L | −28 | −74 | −10 | 3.75 |
| R | 28 | −70 | −4 | 3.25 | |
| Occipital pole | L | −28 | −96 | 14 | 2.94 |
Local maxima were the highest Z values within activated regions falling at least 15 mm apart. Anatomical regions for each maximum were assigned using the Harvard‐Oxford Cortical and Subcortical probabilistic atlases. Only the first maximum within each anatomical region on each side of the brain is listed. Maxima are grouped by lobe in the following order: frontal, parietal, temporal, occipital, subcortical, cerebellum. id = inferior division.
We observed a substantial degree of overlap between the neural regions modulated by the race of the model during imitation in the AA and EA participants (green areas in Fig. 3a–c), further strengthening support for the status hypothesis. For the imitate AA > EA and imitate AA > CA contrasts these regions included the fusiform gyrus and inferior and superior lateral occipital cortices, the inferior frontal gyrus and neighboring premotor cortex, and inferior and superior parietal lobules. For the imitate EA > CA contrast, these regions included visual regions V1–V2 and the fusiform gyrus. Taken together, these results revealed only a single between‐group difference in model race effects during imitation and a high degree of overlap between AA and EA participants. Thus, the race of the model modulates neural activity during imitation largely independently of the imitator's own race arguing against the similarity hypothesis in favor of the status hypothesis.
Effects of Model Race During Imitation Versus the Non‐imitative Conditions
We next sought to determine whether the same neural regions exhibiting effects consistent with the status hypothesis during imitation were exhibiting previously reported racial similarity effects when people passively view the faces and actions of others. Alternatively, it was possible that race‐associated status simply modulated activity within different neural regions during imitation than racial similarity did during passive face and action viewing. To address this question, we directly compared race effects across both groups during gesture imitation to those in the observe gesture and view portrait conditions (three‐way participant race × model race × condition interactions). We confined our investigation to neural regions exhibiting effects consistent with the status hypothesis (i.e. those exhibiting overlapping race effects in the EA and AA participants during imitation) using a post‐threshold mask (green regions in Fig. 3a–c).
If the same neural regions exhibiting effects consistent with the status hypothesis during imitation were instead modulated by racial similarity during the non‐imitative conditions, we predicted three‐way interactions in those regions. Specifically, we predicted that these three‐way interactions would result from the same region exhibiting more activity when (1) imitating AA compared with either EA or CA models and (2) when passively viewing the faces or actions of own‐race compared with other‐race models, as previously found. If race‐associated status and racial similarity simply modulated neural activity in different neural regions during imitation and the non‐imitative conditions, we also predicted three‐way interactions. In this case, however, we predicted these interactions would result from the regions exhibiting status effects during imitation not being modulated by the race of the model during passive action and face viewing and vise versa.
In line with the first prediction, we found clusters of activity in the fusiform gyrus that exhibited significantly different responses to the race of the model during gesture imitation than during either gesture observation or portrait viewing for the AA versus EA contrast (Fig. 3a,b). Parameter estimates revealed that both AA and EA participants exhibited more activity within the fusiform gyrus and lateral occipital cortex during imitation of AA versus EA models, consistent with the status hypothesis. However, during gesture observation and portrait viewing the same region exhibited more activity in response to own‐race compared with other‐race models (Fig. 3a,b, red and blue bars, Table 4), consistent with prior studies on neural responses to race during these tasks [Eberhardt, 2005; Ito and Bartholow, 2009].
To further test the status hypothesis during imitation and the similarity hypothesis during the non‐imitative conditions, we extracted parameters from the fusiform clusters exhibiting task‐related differences to AA versus EA models for the third group of models, CAs. CA individuals are racial outgroup members for both groups of participants and also a group considered to be higher in perceived status than AAs. Therefore, if racial similarity was driving the effects of model race on neural activity in the fusiform gyrus during passive action and face viewing, we expected to see less activity associated with CA individuals than participants' own racial group within these conditions. If the race of the model was influencing fusiform activity during imitation instead based on race‐associated status, we expected to see less activity associated with imitation of CA than AA models for both groups of participants as CAs are typically found to be higher in perceived status than AAs [Fiske et al., 2002, 1999]. Consistent with the status hypothesis during imitation, we found less activity during imitation of CA models relative to AA models in both groups of participants (Fig. 4a,b green bars). Additionally, consistent with the similarity hypothesis during the non‐imitative conditions, we found less activity during either observing the gestures or viewing the portraits of CA models than own‐race models for both group of participants, though this difference was only a nonsignificant trend for EA versus CA models in EA participants during portrait viewing. We also found a similar level of activity in response to the CA models as the other racial outgroup for each group of participants (EA models for AA participants and AA models for EA participants), in further support of the similarity hypotheses during passive face and action viewing (Fig. 3a,b green bars).
Figure 4.
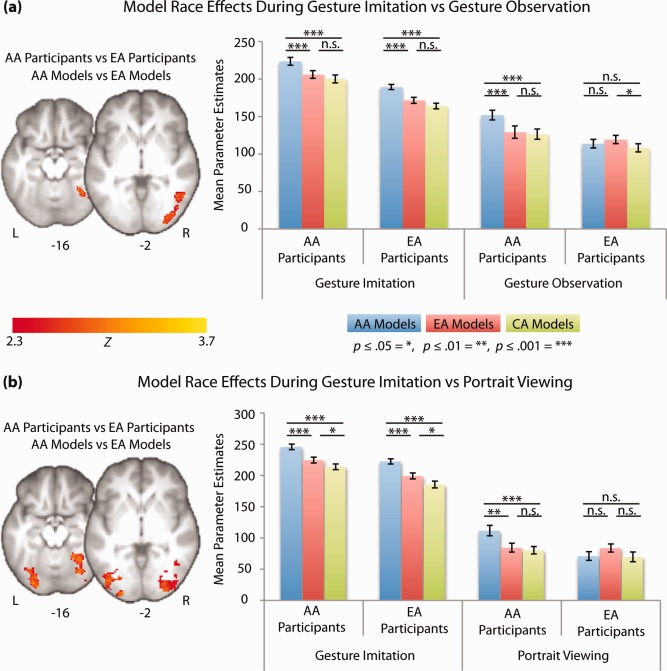
Regions exhibiting differential race effects (model race × participant race interactions) in the imitation condition compared with the non‐imitative conditions (three‐way interactions). Results are confined to those regions exhibiting effects consistent with the status hypothesis during imitation using a post‐threshold mask of overlapping activity between EA and AA participants during imitation (green regions in Figure III a–c). Bar graphs are of average parameter estimates from each condition contributing the interaction compared with baseline (red bars= EA models and blue bars = AA models). For comparison, parameters for the CA models (green bars) are also extracted from the same regions. Error bars represent within subject standard error of the mean, calculated with Cousineau's adaptation of Loftus & Masson's method with Morey's correction [Cousineau, 2005; Loftus and Masson, 1994; Morey, 2008]. (a) Regions exhibiting differential race effects between gesture imitation and gesture observation. (b) Regions exhibiting differential race effects between gesture imitation and portrait viewing.
Taken together, results from the three‐way interactions demonstrate that one of the neural regions exhibiting status effects during imitation, namely the fusiform gyrus, has activity consistent with the similarity hypothesis during the non‐imitative conditions across both EA and AA participants and models from three racial groups. Thus, these data suggest that the fusiform gyrus is differentially modulated by the race of the model depending on the task.
DISCUSSION
Our results suggest that racial similarity does not drive racial modulation of neural activity during imitation. Furthermore, our findings are consistent with the hypothesis that the social status associated with different racial groups influences neural responses to race during imitation due to previous status‐biased imitation. In Losin [2011], we found that European American (EA) participants exhibited more activity in lateral fronto‐parietal and visual regions when imitating African American (AA) compared with Chinese American (CA) or EA models. Because people preferentially imitate those from groups perceived to be high in status [Boyd and Richerson, 1987], and AAs are typically perceived to have lower social status than either EAs or CAs [Fiske et al., 2002, 1999], we hypothesized that imitation of models from racial groups perceived to be lower in social status may require greater recruitment of imitation‐related neural regions as a result of less familiarity with imitating these individuals in daily life (the status hypothesis) [Losin et al., 2011]. This hypothesis was further supported by studies demonstrating that imitating unfamiliar actions is associated with greater neural activity in some of the same sensory‐motor regions as were more active during imitation of AA models [Buccino et al., 2004; Vogt et al., 2007]. Importantly, because AAs were also a racial outgroup for the EA participants, the alternative explanation of this effect relating to racial group membership (the similarity hypothesis) could not be ruled out.
In the present study, we found that the race of the person being imitated influenced neural activity in AAs in largely the same manner as it had in EAs. Both EAs and AAs exhibited more activity when imitating AA compared with EA or CA models in visual and lateral fronto‐parietal regions. There was also a high degree of overlapping activity between AAs and EAs and only a single region exhibiting different responses between AAs and EAs when compared directly. Thus, our data suggest that self‐similarity is not driving neural responses to race during imitation. Importantly, as predicted, both AA and EA participants also rated AAs as being associated with lower subjective social status and socioeconomic status than either EAs or CAs, and made more imitation errors when imitating those from racial groups they perceived to be lower in social status. Thus, our data are consistent with the hypothesis that imitation‐related neural regions [Caspers et al., 2010] are recruited to a greater degree when people imitate individuals from groups they perceive to be lower in social status. As stated previously, this hypothesis was based on findings that people tend to imitate those from lower status groups less frequently than those from high status groups [Clark and Clark, 1947; Liebert et al., 1972; Neely et al., 1973; Thelen, 1971] and that decreased familiarity has been associated with increased neural activity during imitation [Buccino et al., 2004; Vogt et al., 2007]. Future studies are needed to test for a direct link between perceived social status and neural responses to race during imitation.
Our findings that the perceived social status associated with a the model's racial group may influence neural activity, as well as accuracy during imitation, are is consistent with cultural learning theories from evolutionary psychology, which posit that people preferentially imitate high status individuals, both in terms of prestige (similar to subjective social status) and success (similar to objective social status) [Boyd and Richerson, 1985, 1987; Henrich and Gil‐White, 2001; Henrich and McElreath, 2003; Laland, 2004]. Such imitative biases are thought to have evolved because they automatically direct attention to the individuals likely to exhibit high quality behaviors, thus increasing the efficiency with which these behaviors are learned and ultimately increasing the fitness of the imitator. Thus, our study provides neural data consistent with predictions made by theories regarding the evolution of human cultural capacities. Our interpretation of the neural responses to race found in the present study in terms of race‐associated status is also consistent with (1) studies demonstrating that individuals from lower status racial groups (mostly AAs) may preferentially imitate models from higher status racial groups (usually EAs), rather than their own [Clark and Clark, 1947; Liebert et al., 1972; Neely et al., 1973; Thelen, 1971], (2) evidence of a tight link between the perceptions of race and perceptions of social status [Freeman et al., 2011; Macrae and Bodenhausen, 2001; Penner and Saperstein, 2008; Tajfel, 1982], and (3) studies demonstrating that another persons' social status (not related to race) modulates neural activity in the lateral frontal and parietal cortices and the fusiform gyrus [Chiao et al., 2009; Ly et al., 2011; Zink et al., 2008].
Surprisingly, however, this is the first finding that cannot be easily accounted for in terms of self similarity in either the literature on neural mechanisms of action imitation/observation, or the literature on racial (face) perception. Although a few studies have investigated the effects of the race or ethnicity of the model during action observation, all of these studies have suggested that such effects were modulated by shared racial group membership (racial self‐similarity) [Désy and Théoret, 2007; Liew et al., 2010; Molnar‐Szakacs et al., 2007]. Similarly, among studies investigating the neural responses to faces of people from different racial groups, most studies drew distinctions between ingroup and outgroup to frame the interpretation of their findings [Eberhardt, 2005; Ito and Bartholow, 2009]. One possible reason for the dearth of interpretations other than those related to racial self‐similarity in these literatures is the infrequency with which such studies include participants from more than one racial group, or models from more than two racial groups, both of which can help disambiguate self‐similarity effects from others [Losin et al., 2010]. An exception is a study by Lieberman et al. [2005], who found increased activity in the amygdala of both EA and AA participants in response to AA compared with EA faces, which they interpret as relating to negative associations with AAs. Though this interpretation has been debated [Phelps and LeDoux, 2005], we propose that inclusion of two racial groups of participants in studies on race‐related neural mechanisms will reveal more race effects related to status as we propose in the present study as well as other factors aside from racial similarity.
The only neural region in our study that did not exhibit activity consistent with the status hypothesis during imitation was the pre‐supplementary motor area (pre‐SMA). Here EA participants showed heightened activity when imitating AA models whereas AA participants showed increased activity when imitating EA models, suggesting that activity in this region may be modulated by group membership (i.e., both EA and AA participants displaying higher responses to outgroup members). However, data from the additional outgroup used in the present study (CA) revealed that this interpretation is not accurate as both EA and AA participants' responses to CA models were similar to those observed for their respective ingroup. These findings generally caution against interpreting race effects in terms of ingroup versus outgroup biases in the absence of appropriate control conditions (i.e., more than one outgroup) and suggest that neural responses to race within the pre‐SMA are likely affected by the interaction of several factors (e.g., self‐similarity, social status, and majority/minority status). These findings also highlight another important contribution of studies comparing participants with differential cultural experience: the presence of differential neural mechanisms in the absence of behavioral differences. Here, EA and AA participants exhibited differential pre‐SMA activity in the absence of difference in imitation accuracy between AA and EA participants. Other such findings exist in the cultural neuroscience literature [e.g., Gutchess et al., 2006], suggesting that differential neural mechanisms may arise as the result of the habitual use of different cognitive strategies to produce the same behavioral outcome.
We also found that the fusiform gyrus and neighboring lateral occipital cortex are differentially modulated by another person's race during imitation compared with passive viewing of the actions or faces of others. While these regions exhibited the pattern consistent with the status hypothesis during imitation, during passive viewing of faces and actions, the same regions were more responsive to racial ingroup than outgroup members, as previous studies reported [Eberhardt, 2005; Ito and Bartholow, 2009]. Importantly, increased activity in response to ingroup relative to outgroup members was found across two racial outgroups of models in two racial groups of participants, providing more support than previous studies for increased activity in the fusiform gyrus in response to ingroup members when people passively observe other's faces and actions. More broadly, this finding demonstrates that neural regions encoding a person's race encode different racial associations based on the task performed, rather than exclusively encoding racial similarity, as suggested by previous studies on neural mechanisms of racial perception [Eberhardt, 2005; Ito and Bartholow, 2009]. The exhibition of this contextual modulation by the fusiform gyrus suggests fusiform gyrus activity related to race is not exclusively related to this region's sensitivity to familiarity and expertise [Tarr and Gauthier, 2000]. Instead, the present findings may relate to another known modulator of fusiform activity: attention [e.g., Vuilleumier et al., 2001]. Increased attention to ingroup faces is another explanation (as opposed to familiarity) proposed for previously reported increased fusiform gyrus activity in response to racial ingroup members [Golby et al., 2001; Pizzagalli et al., 2002]. This interpretation is supported by findings of better memory for ingroup faces [Golby et al., 2001] and by findings of increased fusirom activity to faces from a novel mixed‐race ingroup [Van Bavel et al., 2008]. By extension, these findings suggest that during imitation in the present study, increased attention may have been given to individuals from racial groups associated with higher social status, which could serve to increase memory for their actions. Effects of socially learned associations have previously been demonstrated within the fusiform gyrus [Singer et al., 2004], even in relation to social status [Chiao et al., 2009; Zink et al., 2008], albeit less frequently. Before the present study, however, such socially learned associations had not been demonstrated in the fusiform gyrus in relation to race.
It should be noted that low‐level visual features of the stimuli (e.g., contrast, spatial frequency, etc.) differed between models from different racial groups; however, we think these visual differences are unlikely to have impacted our main findings for two reasons. First and most importantly, low‐level visual features of the stimuli (i.e., actors, lighting, background, etc.) were identical in the imitation condition as during the portrait viewing and gesture observation conditions, but the pattern of activity seen during the imitation condition was only seen during this condition. Second, increased activity in response to AA models was not only seen in early visual areas but also throughout frontoparietal regions associated with imitation, that is, regions not known to be modulated by low‐level visual features of stimuli.
The present findings during imitation could also be related to any other association with race that both EA and AA participants may hold in reference to AAs. Nevertheless, given that social status and self‐similarity are the two model characteristics known to bias imitation and our findings clearly rule our self‐similarity and are consistent with social status, we believe that social status associations with different racial groups are the most likely explanation of our findings during imitation.
Finally, it is possible that different factors are driving increased activity in response to AAs in AA and EA individuals. A similar explanation was proposed by Phelps and LeDoux [2005], who suggested that the heightened amygdala responses to AAs observed in Lieberman [2005] were driven by the motivational salience of AAs for the AA participants and negative associations with AAs for the EA participants. We think this type of explanation of our findings is unlikely for two reasons: (1) effects were seen in sensory‐motor and association regions rather than exclusively in regions tied to motivational salience (e.g., amygdala and ventral striatum), and (2) both groups exhibited ingroup effects during action observation and portrait viewing making a two‐factor account for the similar activity observed during imitation less likely.
In conclusion, our findings demonstrate that the race of the person being imitated modulates neural activity and imitation accuracy independent of the imitator's own race. Furthermore, they suggest that social status, rather than racial similarity, is responsible for this racial modulation during imitation. In terms of the neural mechanisms underlying imitation, these findings suggest that complex socially learned associations beyond mere similarity can be represented in lower and higher order sensory‐motor systems. In terms of the neural responses to race, these findings suggest that the neural encoding of another person's race is flexibly modulated by specific task demands, rather than being based primarily on shared racial group membership. Finally, in terms of cultural learning, our findings provide the first, albeit indirect, neural evidence supporting evolutionary theories of imitation biases as adaptive mechanisms of cultural acquisition.
ACKNOWLEDGMENTS
The authors thank Kathleen Quach, Drew Morton, and Kambria Nguyen and Zarrar Shehzad for their contributions to stimulus creation, data collection and analysis, and Neil Losin, Katy Cross, and Jeff Rudie for their helpful discussions and comments on the manuscript.
REFERENCES
- Adler NE, Epel ES, Castellazzo G, Ickovics JR (2000): Relationship of subjective and objective social status with psychological and physiological functioning: Preliminary data in healthy, White women. Health Psychol 19:586. [DOI] [PubMed] [Google Scholar]
- Ardekani BA, Braun M, Hutton BF, Kanno I, Iida H (1995): A fully automatic multimodality image registration algorithm. J Comput Assist Tomogr 19:615. [DOI] [PubMed] [Google Scholar]
- Bandura A (1977):Social Learning Theory. New Jersey:Prentice‐Hall. [Google Scholar]
- Barratt W (2005):The Barratt Simplified Measure of social Status (BSMSS): Measuring SES. Terre Haute:Department of Educational Leadership, Administration, and Foundations, Indiana State University. [Google Scholar]
- Boyd R, Richerson PJ (1985):Culture and the Evolutionary Process. University of Chicago Press. [Google Scholar]
- Boyd R, Richerson PJ (1987): The evolution of ethnic markers. Cult Anthropol:65–79. [Google Scholar]
- Buccino G, Vogt S, Ritzl A, Fink GR, Zilles K, Freund HJ, Rizzolatti G (2004): Neural circuits underlying imitation learning of hand actions: An event‐related fMRI study. Neuron 42:323–334. [DOI] [PubMed] [Google Scholar]
- Caspers S, Zilles K, Laird AR, Eickhoff SB (2010): ALE meta‐analysis of action observation and imitation in the human brain. Neuroimage 50:1148–1167. [DOI] [PMC free article] [PubMed] [Google Scholar]
- Cheon BK, Im D, Harada T, Kim JS, Mathur VA, Scimeca JM, Parrish TB, Park HW, Chiao JY (2011): Cultural influences on neural basis of intergroup empathy. Neuroimage 57:642–650. [DOI] [PubMed] [Google Scholar]
- Chiao JY, Harada T, Oby ER, Li Z, Parrish T, Bridge DJ (2009): Neural representations of social status hierarchy in human inferior parietal cortex. Neuropsychologia 47:354–363. [DOI] [PubMed] [Google Scholar]
- Clark KB, Clark MP (1947): Racial identification and preference in Negro children In Hartley E. L. (Ed.) Readings in Social Psychology. New York: Holt, Reinhart, and Winston Read Soc Psychol; 169–178. [Google Scholar]
- Cousineau D (2005): Confidence intervals in within‐subject designs: A simpler solution to Loftus and Masson's method. Tutor Quant Methods Psychol 1:42–45. [Google Scholar]
- Cox RW (1996): AFNI: software for analysis and visualization of functional magnetic resonance neuroimages. Comput Biomed Res 29:162–173. [DOI] [PubMed] [Google Scholar]
- Cundiff JM, Smith TW, Uchino BN, Berg CA (2011): Subjective social status: Construct validity and associations with psychosocial vulnerability and self‐rated health. Int J Behav Med 20:1–11. [DOI] [PubMed] [Google Scholar]
- R Development Core Team (2010):R: A Language and Environment for Statistical Computing. R Foundation for Statistical Computing; Vienna, Austria. [Google Scholar]
- Désy MC, Théoret H (2007): Modulation of motor cortex excitability by physical similarity with an observed hand action. PLoS One 2:e971. [DOI] [PMC free article] [PubMed] [Google Scholar]
- Dunham Y, Baron AS, Banaji MR (2006): From American city to Japanese village: A cross‐cultural investigation of implicit race attitudes. Child Dev 77:1268–1281. [DOI] [PubMed] [Google Scholar]
- Eberhardt JL (2005): Imaging race. Am Psychol 60:181–190. [DOI] [PubMed] [Google Scholar]
- Feinman S (1980): Infant response to race, size, proximity, and movement of strangers. Infant Behav Dev 3:187–204. [Google Scholar]
- Festinger L (1954): A theory of social comparison processes. Hum Relat 7:117–140. [Google Scholar]
- Fiske ST, Cuddy AJC, Glick P, Xu J (2002): A model of (often mixed) stereotype content: Competence and warmth respectively follow from perceived status and competition. J Pers Soc Psychol 82:878. [PubMed] [Google Scholar]
- Fiske ST, Xu J, Cuddy AC, Glick P (1999): (Dis) respecting versus (dis) liking: Status and interdependence predict ambivalent stereotypes of competence and warmth. J Soc Issues 55:473–489. [Google Scholar]
- Freeman JB, Penner AM, Saperstein A, Scheutz M, Ambady N (2011): Looking the part: Social status cues shape race perception. PLoS One 6:e25107. [DOI] [PMC free article] [PubMed] [Google Scholar]
- Golby AJ, Gabrieli JDE, Chiao JY, Eberhardt JL (2001): Differential responses in the fusiform region to same‐race and other‐race faces. Nat Neurosci 4:845. [DOI] [PubMed] [Google Scholar]
- Gutchess AH, Welsh RC, Boduroglu A, Park DC (2006): Cultural differences in neural function associated with object processing. Cogn Affect Behav Neurosci 6:102–109. [DOI] [PubMed] [Google Scholar]
- Henrich J, Gil‐White FJ (2001): The evolution of prestige—Freely conferred deference as a mechanism for enhancing the benefits of cultural transmission. Evol Hum Behav 22:165–196. [DOI] [PubMed] [Google Scholar]
- Henrich J, McElreath R (2003): The evolution of cultural evolution. Evol Anthropol 12:123–135. [Google Scholar]
- Hollingshead ADB (1975): Four factor index of social status, Yale Univ., Department of Sociology.
- Ito TA, Bartholow BD (2009): The neural correlates of race. Trends Cogn Sci 13:524–531. [DOI] [PMC free article] [PubMed] [Google Scholar]
- Karunanayake D, Nauta MM (2004): The relationship between race and students' identified career role models and perceived role model influence. Career Dev Quart 225–234. [Google Scholar]
- Kelly DJ, Quinn PC, Slater AM, Lee K, Gibson A, Smith M, Ge L, Pascalis O (2005): Three‐month‐olds, but not newborns, prefer own‐race faces. Dev Sci 8:F31–F36. [DOI] [PMC free article] [PubMed] [Google Scholar]
- King MM, Multon KD (1996): The effects of television role models on the career aspirations of African American junior high school students. J Career Dev 23:111–125. [Google Scholar]
- Laland KN (2004): Social learning strategies. Learn Behav 32:4–14. [DOI] [PubMed] [Google Scholar]
- Lieberman MD, Hariri A, Jarcho JM, Eisenberger NI, Bookheimer SY (2005): An fMRI investigation of race‐related amygdala activity in African‐American and Caucasian‐American individuals. Nat Neurosci 8:720–722. [DOI] [PubMed] [Google Scholar]
- Liebert RM, Sobol MP, Copemann CD (1972): Effects of vicarious consequences and race of model upon imitative performance by black children. Dev Psychol 6:453–456. [Google Scholar]
- Liew SL, Han S, Aziz‐Zadeh L (2010): Familiarity modulates mirror neuron and mentalizing regions during intention understanding. Hum Brain Mapp 32:1986–1997. [DOI] [PMC free article] [PubMed] [Google Scholar]
- Loftus GR, Masson MEJ (1994): Using confidence intervals in within‐subject designs. Psychon Bull Rev 1:476–490. [DOI] [PubMed] [Google Scholar]
- Losin EA, Iacoboni M, Martin A, Cross K, Dapretto M (2011): Race modulates neural activity during imitation. Neuroimage 59:3594–3603. [DOI] [PMC free article] [PubMed] [Google Scholar]
- Losin EAR, Dapretto M, Iacoboni M (2010): Culture and neuroscience: Additive or synergistic? Soc Cogn Affect Neurosci 5:148–158. [DOI] [PMC free article] [PubMed] [Google Scholar]
- Ly M, Haynes MR, Barter JW, Weinberger DR, Zink CF (2011): Subjective socioeconomic status predicts human ventral striatal responses to social status information. Curr Biol 21:794–797. [DOI] [PubMed] [Google Scholar]
- Macrae CN, Bodenhausen GV (2001): Social cognition: Categorical person perception. Br J Psychol 92:239–255. [PubMed] [Google Scholar]
- Mathur VA, Harada T, Chiao JY (2012): Racial identification modulates default network activity for same and other races. Hum Brain Mapp 33:1883–1893. [DOI] [PMC free article] [PubMed] [Google Scholar]
- Mathur VA, Harada T, Lipke T, Chiao JY (2010): Neural basis of extraordinary empathy and altruistic motivation. Neuroimage 51:1468–1475. [DOI] [PubMed] [Google Scholar]
- Molnar‐Szakacs I, Wu AD, Robles FJ, Iacoboni M (2007): Do you see what I mean? Corticospinal excitability during observation of culture‐specific gestures. PLoS One 2:e626. [DOI] [PMC free article] [PubMed] [Google Scholar]
- Morey RD (2008): Confidence intervals from normalized data: A correction to Cousineau (2005). Reason 9:49–46. [Google Scholar]
- Neely JJ, Hechel RV, Leichtman HM (1973): The effect of race of model and response consequences to the model on imitation in children. J Soc Psychol 89:225–231. [Google Scholar]
- Oldfield RC (1971): The assessment and analysis of handedness: The Edinburgh inventory. Neuropsychologia 9:97–113. [DOI] [PubMed] [Google Scholar]
- Operario D, Adler NE, Williams DR (2004): Subjective social status: Reliability and predictive utility for global health. Psychol Health 19:237–246. [Google Scholar]
- Penner AM, Saperstein A (2008): How social status shapes race. Proc Natl Acad Sci USA 105:19628–19630. [DOI] [PMC free article] [PubMed] [Google Scholar]
- Phelps EA, LeDoux JE (2005): Contributions of the amygdala to emotion processing: From animal models to human behavior. Neuron 48:175–187. [DOI] [PubMed] [Google Scholar]
- Phinney JS (1992): The multigroup ethnic identity measure a new scale for use with diverse groups. J Adolesc Res 7:156–176. [Google Scholar]
- Pizzagalli DA, Lehmann D, Hendrick AM, Regard M, Pascual‐Marqui RD, Davidson RJ (2002): Affective judgments of faces modulate early activity (∼160 ms) within the fusiform gyri. Neuroimage 16:663–677. [DOI] [PubMed] [Google Scholar]
- Rubin M (2012): Group status is related to group prototypicality in the absence of social identity concerns. J Soc Psychol 152:386–389. [DOI] [PubMed] [Google Scholar]
- Sellers RM, Smith MA, Shelton JN, Rowley SAJ, Chavous TM (1998): Multidimensional model of racial identity: A reconceptualization of African American racial identity. Person Soc Psychol Rev 2:18–39. [DOI] [PubMed] [Google Scholar]
- Singer T, Kiebel SJ, Winston JS, Dolan RJ, Frith CD (2004): Brain responses to the acquired moral status of faces. Neuron 41:653–662. [DOI] [PubMed] [Google Scholar]
- Smith SM, Jenkinson M, Woolrich MW, Beckmann CF, Behrens TE, Johansen‐Berg H, Bannister PR, De Luca M, Drobnjak I, Flitney DE, Niazy RK, Saunders J, Vickers J, Zhang Y, De Stefano N, Brady JM, Matthews PM (2004): Advances in functional and structural MR image analysis and implementation as FSL. Neuroimage 23(Suppl 1):S208–S219. [DOI] [PubMed] [Google Scholar]
- Tajfel H (1982): Social psychology of intergroup relations. Annu Rev Psychol 33:1–39. [Google Scholar]
- Tarr MJ, Gauthier I (2000): FFA: A flexible fusiform area for subordinate‐level visual processing automatized by expertise. Nat Neurosci 3:764–770. [DOI] [PubMed] [Google Scholar]
- Tajfel H (1974): Social identity and intergroup behaviour. Soc Sci Inform 13:65–93. [Google Scholar]
- Thelen MH (1971): The effect of subject race, model race, and vicarious praise on vicarious learning. Child Dev 42:972–977. [Google Scholar]
- Van Bavel JJ, Packer DJ, Cunningham WA (2008): The neural substrates of in‐group bias: A functional magnetic resonance imaging investigation. Psychol Sci 19:1131–1139. [DOI] [PubMed] [Google Scholar]
- Van den Berghe PLB (1987): Ethnicity and other bases of sociality In:The Ethnic Phenomenon. Elsevere. Praeger Publishers Westport, CT. [Google Scholar]
- Vogt S, Buccino G, Wohlschläger AM, Canessa N, Shah NJ, Zilles K, Eickhoff SB, Freund HJ, Rizzolatti G, Fink GR (2007): Prefrontal involvement in imitation learning of hand actions: Effects of practice and expertise. Neuroimage 37:1371–1383. [DOI] [PubMed] [Google Scholar]
- Vuilleumier P, Armony JL, Driver J, Dolan RJ (2001): Effects of attention and emotion on face processing in the human brain: an event‐related fMRI study. Neuron 30:829–841. [DOI] [PubMed] [Google Scholar]
- Wong P, Lai CF, Nagasawa R, Lin T (1998): Asian Americans as a model minority: Self‐perceptions and perceptions by other racial groups. Soc Perspect 41:95–118. [Google Scholar]
- Zink CF, Tong Y, Chen Q, Bassett DS, Stein JL, Meyer‐Lindenberg A (2008): Know your place: Neural processing of social hierarchy in humans. Neuron 58:273–283. [DOI] [PMC free article] [PubMed] [Google Scholar]
- Zirkel S (2002): Is there a place for me? Role models and academic identity among white students and students of color. Teach Coll Rec 104:357–376. [Google Scholar]