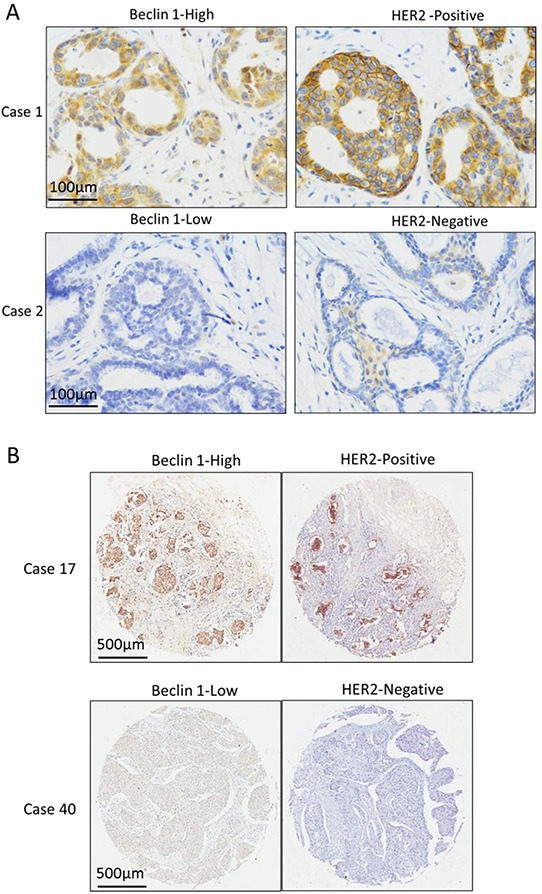
Figure 6. The expression relationship between Beclin 1 and HER2 in ER-positive breast cancer.

A. The Representative cases of Beclin 1 and HER2 expression in 28 ER-positive breast cancer tissue cohort. Scale bar= 100 μm. B. The Representative cases of Beclin 1 and HER2 expression in 105 ER-positive breast cancer TMA cohort. Scale bar= 500 μm.
