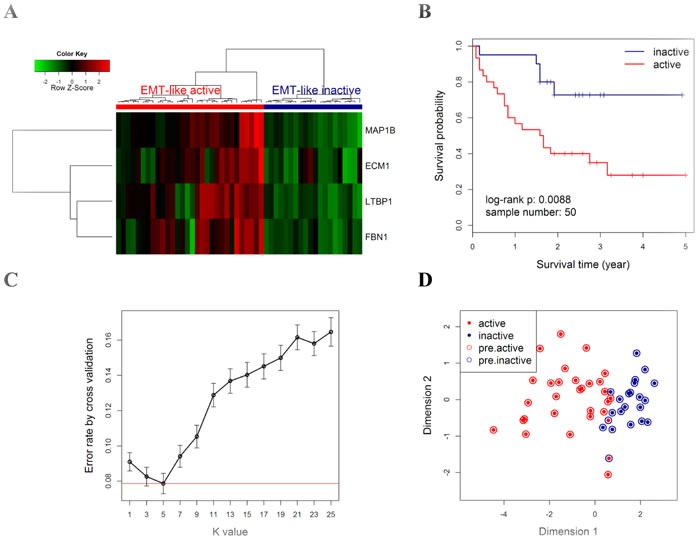
Figure 4. Prognostic value of EMT-like gene-expression pattern in the CICAMS cohort.

A. All patients (N = 50) were classified into two major groups (upper panel: red cluster, active; blue cluster, inactive) by unsupervised hierarchical clustering with the Euclidean distance and ward linkage method. The colored matrix indicates the relative expression levels of 4 genes by qPCR (red for higher expression, green for lower). B. Kaplan-Meier curves and log-rank tests were performed to compare the overall survival rates of the two groups of cases described in A. C. A 5-fold cross validation to select the best k value in kNN modeling for class prediction. For a series of k values (x axis), 5-fold cross validation was performed by 1000 random repeats, the mean (with 95% CI, error bars) of error rate is indicated (y axis). Red line indicates the lowest error rate (0.078) with k value = 5. D. Scatter plot for kNN training (k = 5) results of CICAMS dataset. All samples (each point) were mapped into a 2-dimension map by classical multidimensional scaling using the Euclidean distance. Solid points indicate the actual subtype, with red indicating the active pattern (active) and blue for the inactive pattern (inactive). Circles indicate the predicted subtype by kNN model, with red indicating the predicted active pattern (pre.active) and blue for the predicted inactive pattern (pre.inactive).
