

Abstract
Objective
To assess the test-retest variability of hearing thresholds obtained with an innovative, mobile wireless automated hearing-test system (WAHTS) with enhanced sound attenuation to test industrial workers at a worksite as compared to standardized automated hearing thresholds obtained in a mobile trailer sound booth.
Design
A within-subject repeated-measures design was used to compare air-conducted threshold tests (500 to 8000 Hz) measured with the WAHTS in six workplace locations, and a third test using computer-controlled audiometry obtained in a mobile trailer sound booth. Ambient noise levels were measured in all test environments.
Study sample
Twenty workers served as listeners and 20 workers served as operators.
Results
On average, the WAHTS resulted in equivalent thresholds as the mobile trailer audiometry at 1000, 2000, 3000 and 8000 Hz and thresholds were within ±5 dB at 500, 4000, and 6000 Hz.
Conclusion
Comparable performance may be obtained with the WAHTS in occupational audiometry and valid thresholds may be obtained in diverse test locations without the use of sound-attenuating enclosures.
Keywords: Wireless audiometer, hearing threshold, Audiometry, automated audiometry, test-retest variability, occupational health
Introduction
Hearing conservation programs monitor the hearing of hazardous noise-exposed workers by measuring air-conduction pure-tone thresholds. In the U.S. and other countries, government regulations, standards, and policies specify the test equipment and test environment criteria used for occupational hearing tests conducted as part of a hearing loss prevention program. Because pure-tone audiometric results can lead to medical and legal decisions, it is critical that the procedures be standardized and comparable when obtained in different settings. In the U.S., audiometric monitoring requirements are specified by the Occupational Safety and Health Administration (OSHA) 29 CFR 1910.95 (OSHA, 1983) for manufacturing and general industry, by the Mine Safety and Health (MSHA) for mining (MSHA, 2000), and by the Federal Railroad Administration (FRA) for railroad employers (FRA, 2007). Best-practice guidelines are published by the National Institute for Occupational Safety and Health (NIOSH, 1998). Within the context of occupational hearing loss prevention programs, serial audiograms are compared to a baseline audiogram to identify threshold shifts that warrant follow-up for early identification of, and intervention for noise-induced hearing loss (NIHL). Workers’ compensation insurance and OSHA injury and illness reports rely on serial audiometric records to determine work-relatedness. Each of these applications requires standardized audiometric procedures that assure consistent test validity and reliability each time a hearing test is administered.
Ambient Noise
Audiometry requires the listener to respond to the lowest signal level (softest sound) detected at least 50% of the time (ANSI S3.21, 2004). Accurate responses are dependent upon the ability of the listener to distinguish the test signal from background noise in the test room (ambient noise) and the ambient noise in the test space must not influence the test signal. In fact, the ambient noise must be significantly below the sound pressure level (SPL) of the test signal (Williams, 2010). The validity of an occupational audiogram is dependent on several factors, one of which is the ambient noise present in the test environment. The American National Standards Institute (ANSI) S3.1-R2013 specifies the maximum permissible ambient noise levels (MPANLs) allowed within a test room which will allow hearing threshold measurements down to 0 dBHL (decibel hearing level) when tested with supra-aural earphones. NIOSH (1998) recommends that audiometric test environments meet the ANSI S3.1 specifications as a hearing conservation best practice. The International Standards Organization (ISO) 8253 Part 1 (2010) is used internationally and may have application to employer hearing conservation programs related to compliance with local jurisdiction requirements for global enterprises. OSHA (1983) is considerably less stringent (higher levels allowed) in terms of MPANLs than ANSI S3.1. Reportedly, this is due to OSHA historically adopting MPANLs, which were dated at the time by 23 years, from ANSI S3.1–1960 (Frank & Williams, 1993). Further, OSHA was concerned that more stringent requirements would not be obtainable when hearing testing is performed in industrial settings and was willing to sacrifice accurate threshold measurement to 0 dBHL at the time the standard was promulgated (OSHA, 1983). The MSHA (2000) and the FRA (2007) regulations reference the outdated OSHA (1983) ambient noise levels. In 1994, the National Hearing Conservation Association (NHCA) and the American Speech-Language-Hearing Association (ASHA) submitted recommendations to OSHA suggesting MPANLs that were based on a 5 dB relaxation of the ANSI S3.1 (1999) at 500 Hz (NHCA, 1994).
Table 1 provides a comparison of the ambient noise levels relevant to industrial audiometry conducted with supra-aural earphones. It should be noted that OSHA neglects to specify octave-band criteria below 500 Hz and thereby overlooks the potential for an adverse upward spread of masking effect on measured thresholds at higher frequencies (Franks et al., 1992). Evidence exists that hearing thresholds will be elevated when hearing testing is performed in test environments meeting the OSHA MPANLs with supra-aural earphones as opposed to an environment meeting ANSI S3.1 MPANLs (Berger & Killion, 1989; Frank & Williams, 1993).
Table 1.
Maximum permissible ambient noise levels (MPANLs) for supra-aural earphones.
| Octave Bands (Hz)
|
|||||||
|---|---|---|---|---|---|---|---|
| Criteria (dB SPL) |
125 | 250 | 500 | 1000 | 2000 | 4000 | 8000 |
| ANSI S3.1-1960 | - | - | 40 | 40 | 47 | 57 | 67 |
| ANSI S3.1-1999 (R2013) | 49 | 35 | 21 | 26 | 34 | 37 | 37 |
| ISO 8253: 2010 | 47 | 33 | 18 | 20 | 27 | 34 | 33 |
| OSHA (1983) | - | - | 40 | 40 | 47 | 57 | 62 |
| NHCA (1994) | - | - | 24.5 | 26.5 | 28 | 34.5 | 43.5 |
OSHA specifies the permissible ambient noise levels during hearing testing. OSHA further clarified this expectation in a Standard of Interpretation dated February 14, 2005 stating that the intent of the standard is that the ambient noise levels are met every time an audiometric test is performed, but go on to state that for stationary sound booths, the ambient noise levels need only be measured once a year (OSHA, 2005). In the case of mobile vans or trailers, OSHA advises repeating ambient noise level testing whenever the mobile unit is relocated to a new location. For open-room environments, OSHA suggests monitoring noise levels whenever an audiometric test is administered. NIOSH recommends that ambient noise requirements be checked annually for permanent, onsite test areas (sound booth or open room). For mobile units, the ambient noise requirements should be re-established daily or each time the mobile unit is relocated, whichever is more frequent. In addition, the ambient noise levels should be measured during audiometric testing and recorded for each audiogram collected. NIOSH further specifies that the ambient noise measurements should be taken in the location near the workers’ head and with all lights, heaters, and/or air conditioners operating as expected during hearing testing.
Ambient noise levels in single-walled test rooms located at industrial settings and in mobile trailers can yield levels below OSHA requirements. Lankford et al. (1999) evaluated the ambient noise levels in 13 audiometric tests booths contained in 12 different industrial mobile test vans and trailers operating in the Midwest region of the U.S. All of the industrial mobile test units complied with the 1983 OSHA permissible ambient noise levels. The majority (62%) of the mobile test facilities were out of compliance with ANSI S3.1–1991 MPANLs due to excess octave-band sound pressure levels at 125, 250, and 500 Hz. Frank and Williams (1994) obtained ambient noise measurements from 490 industrial audiometric test booths for the previous five years from eight employers with hearing conservation programs. One-hundred percent of the test rooms met the OSHA ambient noise requirements, whereas only 33% met the more stringent ANSI S3.1–1999 MPANLs, with more rooms failing to meet the lower octave bands (125, 250, and 500 Hz) as opposed to the higher octave bands (4000 and 8000 Hz).
Strategies to control ambient noise levels for the purposes of hearing testing in industry typically include portable or permanent prefabricated sound-isolating enclosures (sound booths), passive noise-reducing earphone enclosures (Amplivox Audiocups), and insert earphones. Sound booths are available in both single-walled and double-walled construction, with the latter offering greater sound isolation from the surrounding environment at a higher cost. Ultimately, the attenuation effectiveness of a sound booth is dependent on the construction (panel thickness), installation, location, and maintenance of the structure over time. For industrial test locations, stationary single-walled sound booths, transportable “mini” sound booths, or open-rooms are the practical norm. Mobile test units typically employ single-walled units, due to booth cost, as well as increased weight and fuel costs for double-walled sound booths. Franks (2001) reported the octave-band center frequency attenuation for transportable “mini” sound booths as 12 dB at 125 Hz, 26 dB at 250 Hz, 27 dB at 500 Hz, 30 dB at 2000 Hz, 35 dB at 4000 Hz, and 35 dB at 8000 Hz. Single-walled stationary sound booths with 10 cm panels provide greater attenuation: 28 dB at 125 Hz, 36 dB at 250 Hz, 48 dB at 500 Hz, 57 dB at 1000 Hz, 61 dB at 2000 Hz and 4000 Hz, and 57 dB at 8000 Hz.
Amplivox Audiocups are circumaural devices that are designed to have a standard supra-aural earphone mounted within the enclosure. ANSI S3.6 Specifications for Audiometers (2010) does not standardize the reference threshold level calibration of earphone enclosures nor does ANSI have a standard governing the permissible ambient noise levels when they are utilized. Frank et al. (1997) evaluated hearing threshold repeatability and attenuation values for four passive-noise-reducing earphone enclosures containing a supra-aural earphone mounted in a plastic dome. Due to limited additional attenuation, threshold elevation and poor threshold repeatability for all the devices, Frank et al. did not recommend the use of the passive noise-reducing enclosures. Rather, the authors suggested that test environments be purposely located in quiet environments and the use of insert earphones be considered as an alternative since they provide greater attenuation than supra-aural earphones. NIOSH (1998) does not directly address the use of supra-aural passive earphone enclosures, but does so indirectly by recommending that audiometers conform to the ANSI S3.6–1996 standard for Type 4 audiometers. Besides providing greater attenuation than supra-aural earphones, insert earphones are advantageous in terms of greater interaural attenuation, elimination of collapsed ear canal artifact, greater listener comfort, greater flexibility in fitting different head sizes, and improved infection control (Killion, 1984; Killion et al. 1985; Clark & Roeser, 1988; Gross, 2005). OSHA only recently permitted the use of insert-earphones without additional dual-testing when converting from supra-aural earphones (OSHA, 2013). The increased cost of the individual ear tips and the additional time required for the technician or audiologist to fit the earphones have impeded routine adoption of this earphone style for industrial testing despite the aforementioned benefits.
Occupational Test Reliability and Validity
Reliability in this context refers to the ability to obtain consistent hearing test results when applied more than once to the same listener. In this case, the variability is inherent to the test itself and is not due to differences across listeners. Dobie (1983) found that test-retest variability in industry is similar to that reported for clinical settings (±5 dB) and dependent on the frequency under consideration. He noted that “workers referred for otologic evaluation were found to have hearing levels which were, on average, about 5 dB better than indicated by plant audiometry.”
Reliability of occupational audiometry has been reported in the literature, often with differing experimental methods and analysis metrics (e.g., correlation coefficients, standard error of threshold measurement, standard deviations of the test-retest difference scores [SDdiff]). In Dobie (1983), the two most recent audiograms from 260 workers were randomly selected from 13 Kaiser Aluminum and Chemical Corporation plants. The audiograms were collected as part of the plant hearing conservation program and were separated by six to 18 months and conducted between 1977 and 1979. Some audiograms were collected onsite, and others were collected by the mobile service provided. The SDdiffs ranged from 6.8 to 10 dB for test frequencies between 500 and 8000 Hz. Dobie (1983) concluded that industrial audiometry is less reliable than clinical audiometry since SDdiffs were all greater than reported for clinical studies.
Validity of Automated Threshold Audiometry
Occupational audiology has embraced the use of automated testing for decades and its use is only beginning to expand to other settings in response to the demand for global hearing health care that exceeds current service provision models (Margolis & Morgan, 2008; Swanepoel et al., 2010). Mahomed et al. (2013) provides a detailed systematic review and meta-analysis of the literature comparing automated pure-tone air-conduction threshold audiometry with the gold standard of manual threshold audiometry. The researchers conclude that automated audiometry provides an accurate measure of hearing threshold using air-conducted pure-tones as stimuli. The advances in automated audiometry have further driven the desire to advance technology in order to afford hearing testing outside of a controlled test environment.
Hearing Testing Outside of Sound Treated Environments
Industrial settings need the ability to conduct valid hearing tests outside of a sound-treated room. Access to industrial hearing test services is a challenge for many industries, especially those with rural or remote workers. Mobile audiometric services meet this demand at least annually, but otherwise workers are left to drive miles to obtain hearing testing in clinical settings, with sound booths and personnel with the appropriate technical (e.g., CAOHC certification) or professional (audiologist) training. The alternative is for employers to implement onsite hearing testing in an open room or single-walled test booth and invest in the training of their own personnel to administer the tests. Both of these alternatives include additional personnel and equipment costs and may not assure valid audiometric results, especially when conducted near noisy industrial processes.
Three studies have been conducted using the KUDUwave automated audiometer to validate the instrumentation and demonstrate the feasibility of testing hearing outside of a treated environment in a school, retirement home and clinical setting (MacLennan-Smith et al., 2013; Swanepoel et al., 2013; Brennan-Jones et al., 2016). The average difference between the sound booth and school environment mean thresholds was 0 dB (SD ±3.6). The average difference between mean thresholds obtained in the sound booth and retirement home was 0–5 dB in 95% of the comparisons. Lastly, absolute mean threshold differences between the sound booth and a quiet clinical room ranged across frequencies between 4.8 to 9.2 dB.
Although the KUDUwave has the potential to enable testing outside of typical clinical settings, it is primarily designed as a diagnostic device to be used by trained individuals. To facilitate hearing testing in typical worksite locations, industry needs technology that is easily operated, portable, economical, reliable, and compliant with regulatory requirements and best practice guidelines.
Objective
This study was conducted to assess the test-retest variability of hearing thresholds obtained with an innovative mobile, wireless automated hearing test system (WAHTS) with enhanced sound attenuation to test industrial workers at a worksite. Test-retest variability of the WAHTS was also compared to standardized automated hearing thresholds obtained in a mobile trailer sound booth.
Materials and Methods
Design
The study was designed to evaluate the following: (1) within-subjects test-retest hearing threshold reliability of the WAHTS and (2) within-subject comparison of the WAHTS thresholds with standard automated mobile van audiometric thresholds measured within a sound booth. Descriptive studies were also designed to provide a comparative analysis of the ambient noise levels of the test environments.
Participants
Twenty pairs of listeners (manufacturing workers) and untrained test operators (administrative workers) were recruited from a large local craft brewery. Workers were eligible to participate in the study if they were aged 18 years or older, able to understand written and spoken English sufficient to follow hearing test instructions and could operate a mobile computer device such as an iPad (Apple, Cupertino, CA, USA). Listeners were manufacturing workers who were not included in the plant’s hearing conservation program and had not had their hearing tested as part of the company’s annual audiometry for OSHA compliance. Hearing status was not a condition of enrollment in the study. WAHTS operators were administrative workers employed in environmental health and safety, human resources, or supervisory and management roles at the brewery. The research study was conducted in accordance with an approved local ethical Institutional Review Board (IRB) at the University of Northern Colorado and informed consent was given by all participants. All participants received monetary compensation in the form of gift cards for their time. The employer was extremely cooperative and permitted employees to participate in the study during routine work hours.
Test Environments
Audiometric testing with the WAHTS took place in six conference rooms located within brewery buildings. The rooms were selected by two representatives of the plant’s environmental health and safety staff with regard to available plant space that could potentially be available for onsite hearing testing if feasible in the future. No other requirements or room specifications were given with regard to room size, acoustics. or location. Four of the six rooms were utilized for at least three test sessions. The plant operates 24 hours a day, and the majority of testing took place during the day shifts when plant work activity is the greatest.
Standardized industrial hearing testing took place in a university-based mobile trailer (used for contracted occupational audiometric services) within a single-walled Acoustic Systems RE120 sound booth meeting OSHA 29 CFR 1910.95 ambient noise specifications (OSHA, 1983). The research site and protocol were scheduled to align with the onsite use of the trailer for routine annual audiometry of workers enrolled in the company hearing conservation program. The trailer was parked onsite adjacent to manufacturing buildings during the month of July, and air-conditioning was turned off during hearing testing to provide as quiet a test environment as possible. However, the cooling system was operational between tests to maintain a comfortable test environment. The plant is routinely serviced by trucks and a railroad track with horn signals is within three blocks of the plant.
Instrumentation: Ambient Noise Levels
A Quest 2900 Type II sound level meter (3M, Oconomowoc, WI) with a Q-300 one-third octave-band analyser was used to obtain pre- and post-test ambient noise levels in the worksite test environments. Ambient sound pressure level (SPL) measurements were obtained at 125, 250, 500, 1000, 2000, 3150, 4000, 6300, and 8000 Hz. The in-line Type 2 Benson Acoustic Simulator (BAS) model 200slm sound level meter and octave-band filter system was utilized to automatically record ambient SPLs at 500, 1000, 2000, 4000, and 8000 Hz at the time of threshold measurement for mobile trailer hearing testing. When the BAS 200slm is used in combination with the CCA-200 minicomputer-controlled audiometer, the hearing test is automatically paused when ambient noise levels at the test frequency exceed values permitted in Appendix D of OSHA 29 CFR 1910.95 and resumes when values are acceptable (Benson Medical Instruments, Minneapolis, MN). Consequently, all thresholds are recorded only when ambient noise levels meet the OSHA test requirements. It should be noted that OSHA does not specify MPANLs for 3000 and 6000 Hz and the Benson system does not report ambient noise levels for these test frequencies; however, the levels are monitored relative to the 4000 Hz and 8000 Hz octave bands, respectively. Additionally, the CCA-200 and BAS 200slm instrumentation does not offer an option to require tests to meet ANSI S3.1 ambient noise levels.
Instrumentation: Mobile Trailer
A computer-controlled Benson CCA-200 mini audiometer coupled to TDH-39P earphones was used to automatically obtain hearing thresholds within the single-walled test booth located in a mobile trailer. The Benson CCA-200 mini audiometer meets the ANSI S3.6 (2010) audiometer standard. A hearing threshold was obtained using a modified Hughson-Westlake method (Carhart & Jerger, 1959) and recorded after the listener responded to a series of three pure-tones at a minimal level in two of three ascending presentations. The audiometer passed a comprehensive electroacoustic calibration six months prior to testing; earphone output levels were objectively calibrated before and after each day of testing to confirm reference values.
Instrumentation: Wireless Automated Hearing Test System (WAHTS)
The WAHTS was developed to increase access to hearing health care in settings not specifically designed for hearing testing (e.g., no sound booth, minimally trained test administrators). The design objectives were to: (1) maximize passive attenuation, while keeping the headset comfortable enough to wear for the duration of a typical hearing test, (2) leverage mobile technologies and eliminate cables, and (3) meet ANSI S3.6 and IEC 60645-1 standards for (Type 4) audiometers. Figure 1 shows an exploded view of the components contained within the ear cup and the completed headset. The ear cup shell is relatively large, stiff, and heavy, attributes which all contribute to passive attenuation. The ear cup is lined with thick polyurethane foam to attenuate higher frequencies. Closer to the listener’s ear, the right ear cup contains a wireless, audiometer circuit, while the left cup contains a rechargeable lithium ion battery. Next, a speaker and a small microphone are mounted within a plastic face plate and covered with a thin protective fabric. Although not used in the present study, the microphone will enable measurement of the sound level inside the ear cups at the listener’s ear. Lastly, an ear seal from X-series hearing protectors (3M, St. Paul, MN) snaps into the ear cup.
Figure 1.

Wireless audiometric headset. Attenuation data for an early prototype headset was conducted by an outside lab and is included in the appendix (Michael & Associates, State College, PA, USA).
Because audiometric headsets need to be fit quickly and easily, especially for screening applications, the headband uses a “frictionless fit” to enable quick adjustment of the ear cups over the listener’s ears. Typical hearing protectors and audiometric headsets require forcefully sliding the ear cups up or down to align transducers with the listener’s ear and then rely on the friction with the headband wires to hold their position. To enable a more intuitive adjustment, this new design minimizes friction between the headband wires and ear cups and relies on two separate springs: one provides the tension required ensuring a good seal around the ears, and the second allows for weight-bearing of the ear cups on the head. As a result, the ear cups may be quickly and accurately positioned over the listener’s ears, either by the test operator or by the listener.
To measure thresholds, the wireless headset executed an automated algorithm based on the modified Hughson-Westlake procedure (Carhart & Jerger, 1959). Each presentation to the listener occurred as three short beeps (the pulse train) in the form of pure tones at the prescribed test level. Thresholds were tested beginning with 1000 Hz, proceeded through the higher frequencies to 8000 Hz, returned to 1000 Hz for a retest before it measured the last threshold at 500 Hz. Thresholds were identified as the lowest intensity heard at least 50% of the time following a minimum of three ascending presentations (NHANES, 2011; section 3.5.3.3). The interval between the end of one stimulus and the start of the next (inter-stimulus interval) varied randomly between one and three seconds (uniform distribution), and participants were given up to one second after the end of a stimulus to respond.
Headsets were calibrated using a Bruel and Kjaer (B&K, Denmark) 4153 ear simulator, which complies with International Electrotechnical Commission (IEC) 60381-1 (1982). Output from the B&K ear simulator was amplified with a B&K Nexus 2692 charge amplifier and sampled with a National Instruments PXI-4462 data acquisition card. A custom MATLAB program controlled the wireless headset over Bluetooth, recorded the sound level sampled by the data acquisition system, and automatically adjusted headset calibration gains. Additionally, to report thresholds in units of dB HL, a preliminary study to determine reference equivalent sound pressure levels for these headsets was conducted according to ISO 389-9 (manuscript in preparation).
The wireless headsets support a Bluetooth Low Energy (4.0+) interface that allows a connected device to initiate an automated threshold test and receive the results. For this study, Apple iPad Air tablets ran a version of an application (app) developed by Creare, Inc. (Hanover, New Hampshire). The app, called TabSINT, enables researchers to administer customized tests and questionnaires on mobile devices located across multiple sites. The app includes a specially developed plugin that allows TabSINT to communicate directly with the WAHTS through Bluetooth (Shapiro, 2016). The app guided test administrators to enter the relevant study data, e.g., listener and room identifiers, and the background noise levels recorded by the sound level meter. Once the data entry portion was complete, the app instructed the administrator to give the tablet to the hearing test operator who was instructed to place the headset on the subject and hand the iPad to the listener. The app screen then displayed a large response button graphic that responded to touch. At the conclusion of each session, the audiogram was displayed and data were uploaded to a password protected webserver.
Experimental Procedure
Once participant pairs were recruited and consented, the participants accompanied the researcher to one of the six test environments depending on availability. Ambient noise level measurements were conducted and manually entered into the Creare TabSINT app. The researcher selected the ear to test first and the choice of start ear was counter-balanced across all listeners. Once the initial data entry was completed, the iPad was handed to the test operator who read the instructions for preparing the test participant and placing the headset on the listener. The test operator then placed the headset on the listener’s ears and handed the iPad to the listener. Listeners were allowed to make minor adjustments to the headset placement for each test. The listener was then given written instructions for taking the hearing test via the iPad, and a practice threshold at 1000 Hz was obtained. A repeat practice trial was available if the initial practice session did not result in a measurable threshold at 1000 Hz. Once the initial automated hearing test (500 to 8000 Hz) was completed for both ears, the listener returned the iPad to the test operator. The operator was then instructed to completely remove the headset, and then immediately reposition it on the listener for a repeat hearing test. The repeat hearing test was completed in the same manner as the initial test. Upon completion of the second hearing test, the operator was instructed to remove the headset and the researcher completed data entry of post-test ambient noise levels.
Next, the participants moved to the mobile trailer and the researcher administered the computer-controlled automated hearing test to the listener in the sound booth beginning with the left ear in all participants, as is standard in industrial audiometry.
Analysis
Data aggregated on the webserver were analysed using Jupyter Notebooks and iPython (Pérez, 2007). Jupyter Notebooks provide an open source, web application front-end that interacts with a variety of programming languages. For these analyses, all computations were performed with iPython and open-source plotting and numerical packages, including matplotlib (Hunter, 2007), pandas (McKinney, 2010), scipy (Jones, 2001), and seaborn (Waskom, 2014). Pre- and post-test ambient noise levels were averaged, and then overall average and standard deviations were calculated for the conference rooms and the mobile trailer measurements. For the hearing thresholds, two sets of within-subject differences were computed: (1) between the repeated hearing tests with the wireless headset, and (2) between the first wireless headset test and the mobile trailer test.
Results
Twenty listeners (9 male, 11 female) aged 39.4 years (±10.4) participated (n=40 ears) and 20 adult operators (7 male, 13 female) participated in the study. The operator group consisted of 10 environmental health and safety staff, seven administrative staff from human resources, information technology, and marketing, and three supervisory staff from the brewery. Ninety-five percent (n=19) of the operators had never received formal training in hearing testing and were unexperienced in conducting hearing tests. The one operator who had taken a Council for Accreditation in Occupational Hearing Conservation (CAOHC) training course several years prior had never administered hearing tests afterwards.
Hearing Profile
A composite audiogram based on the mobile trailer audiometry for all 20 listeners is provided in Figure 2. As no specific threshold criteria were used for inclusion, the population appears to be representative of what might be expected in manufacturing workers not enrolled in an occupational hearing conservation program. The majority of listener participants had hearing thresholds less than 10 dBHL for test frequencies 500 to 3000 Hz, and less than 20 dBHL for higher frequencies. A few listeners had moderate hearing loss, exhibiting thresholds above 40 dBHL at 4, 6, and 8 kHz.
Figure 2.
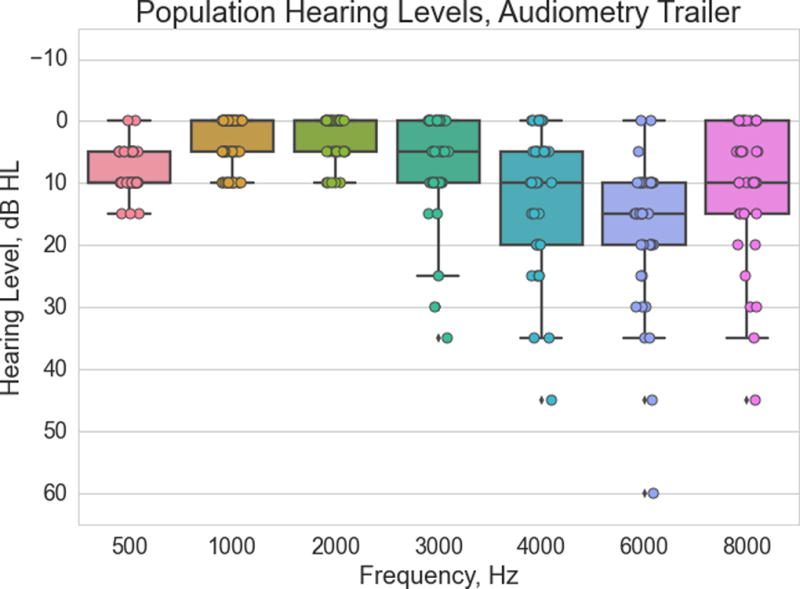
Boxplot of study population hearing levels measured in the mobile trailer sound booth. Boxes span the interquartile range (IQR), the whiskers extend 1.5 times the IQR, and the horizontal lines within boxes indicate medians (n=40 ears).
Background Noise Levels
Wireless hearing testing data collection took place in five conference rooms and one security trailer. The physical characteristics of the test rooms varied. Sizes ranged from 6×6 feet to 35×20 feet. Three rooms had vaulted ceilings and 3 had acoustic tiled ceilings. Flooring included bamboo, laminate tile, concrete, and carpeting. Four rooms had at least two windows each (two rooms with coverings and two rooms without coverings). All of the conference rooms had air conditioning operating at the time of testing. The security trailer was not air conditioned. Ambient noise sources included voices from nearby offices, hallway traffic including visitor tour groups, patio break and lunch areas, mechanical water pumps, bottle assembly, and truck/vehicle traffic.
Figure 3 summarizes ambient noise level measurements obtained in each conference room and in the mobile trailer. Although some of the individual conference rooms were generally noisier than others, no obvious correlation with thresholds obtained with the wireless headset compared to the mobile trailer thresholds was observed, thus the noise levels were aggregated to simplify comparison with the mobile trailer sound booth levels. The mobile trailer had significantly lower noise levels at 500, 1000, and 2000 Hz, while the conference rooms were quieter for 125, 250, and 8000 Hz (p <0.01 (Bonferroni correction applied for multiple comparisons). At 4000 Hz, the average noise level in the conference rooms was also lower; however, it did not reach significance (p = 0.013). All test locations met the OSHA 29 CFR 1910.95 Appendix D MPANLs with the exception of the conference rooms at 500 Hz (Figure 3A). Ambient noise levels exceeded the ANSI S3.1 and ISO 8253 MPANLs for test frequencies at or below 2000 Hz in all test environments.
Figure 3.
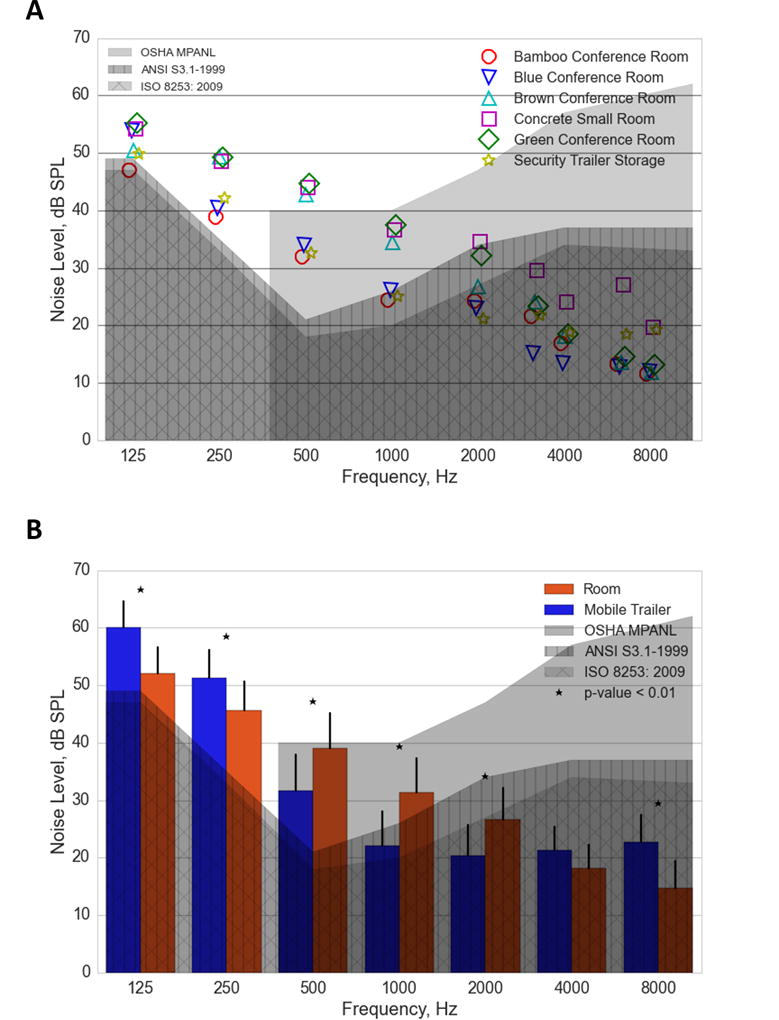
Ambient Noise Level Measurements. Noise levels in conference rooms (A) and comparison of mean ambient noise levels between mobile trailer and conference rooms (B). The OSHA (solid gray) and ANSI S3.1-R2013 (gray with vertical lines) and ISO 8253-1 (2010) (gray with crossed-lines) maximum permissible ambient noise levels are overlaid for visual reference.
Thresholds Measured with Wireless System
Figure 4 summarizes the thresholds obtained on participant’s first measurements with the wireless headset.
Figure 4.
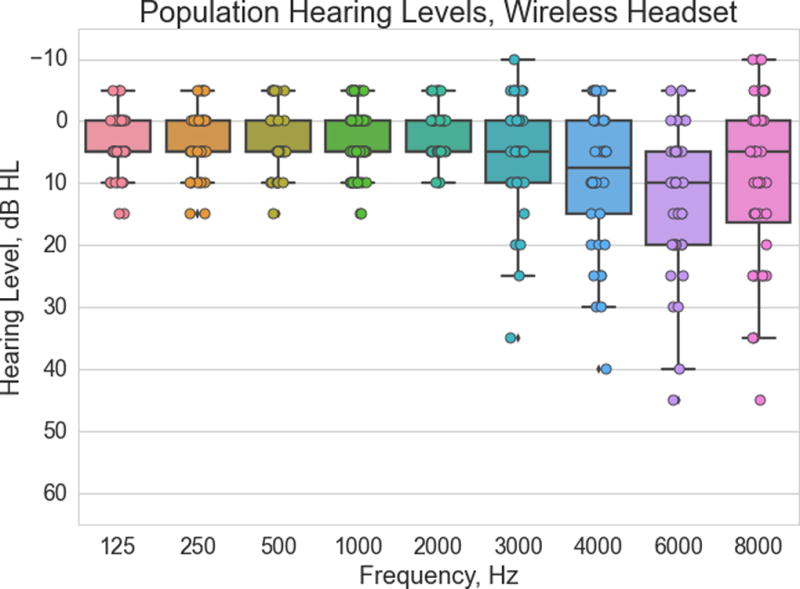
Boxplot of hearing thresholds measured during subject’s first measurement with the wireless headset (n=40 ears).
Similar to Figure 2, it is apparent a few listeners had moderate high-frequency hearing loss, exhibiting thresholds above 40 dB HL at 4, 6, and 8 kHz. In addition to the seven frequencies measured in the mobile trailer sound booth, thresholds were measured at two lower frequencies, 125 and 250 Hz. Thresholds of 0 dB HL (or lower) were measured for at least 50% of the participants up to 3 kHz. None of the listeners required a repeat practice trail for the initial 1000 Hz threshold measurement.
Threshold Repeatability with Wireless System
Table 2 presents the differences in thresholds after removing and replacing the wireless headset for the nine test frequencies. Additionally, the repeatability of participant’s thresholds averaged across 2, 3, and 4 kHz (OSHA standard threshold shift), showed differences of −0.4 dB with a standard deviation of 2.2 dB.
Table 2.
Hearing threshold repeatability for the wireless automated hearing test system (n=40 ears).
| Frequency (Hz) | 125 | 250 | 500 | 1000 | 2000 | 3000 | 4000 | 6000 | 8000 | 2,3,4 kHz |
|---|---|---|---|---|---|---|---|---|---|---|
| Average Difference (dB) | −0.5 | 0.0 | −1.0 | −0.8 | −0.3 | −0.6 | −0.4 | −0.5 | −1.1 | −0.4 |
| Standard Deviation (dB) | 4.1 | 2.8 | 3.2 | 3.1 | 3.2 | 3.4 | 3.6 | 4.4 | 5.1 | 2.2 |
Threshold Comparison with Mobile Trailer Sound Booth
Thresholds obtained with the wireless headset showed a slight negative bias (Table 3). Across all frequencies, thresholds measured with the wireless headset were 1.3 dB lower than those measured with the audiometer in the mobile trailer sound booth with a standard deviation of 4.9 dB. Reviewing individual frequencies, 8000 Hz showed the largest standard deviation (6.0 dB), indicating the greatest disagreement between thresholds measured with the two systems. Note that the Benson audiometer did not measure thresholds below 0 dB HL, but the WAHTS measured thresholds as low as −10 dB HL. Therefore, for this comparison, all WAHTS thresholds that were below 0 dB HL were rounded up to 0 dB HL
Table 3.
Threshold differences between wireless audiometry and audiometry in mobile trailer sound booth (n=40 ears).
| Frequency (Hz) | 500 | 1000 | 2000 | 3000 | 4000 | 6000 | 8000 | All |
|---|---|---|---|---|---|---|---|---|
| Average Difference (dB) | −3.7 | −0.5 | −0.1 | −0.7 | −2.1 | −5.5 | −0.3 | −1.3 |
| Standard Deviation (dB) | 4.3 | 2.9 | 3.0 | 4.4 | 5.5 | 5.8 | 6.0 | 4.9 |
Discussion
Test Retest Reliability
The test-retest repeatability results for the wireless automated hearing test system demonstrate that the system functions on par or better than previously reported test-retest ranges in multiple settings. These findings are shown in Table 4, which presents the standard deviation of the difference between two consecutive threshold measurements. Stuart et al. (1991) tested their participants twice on three different sets of earphones (only two sets included in the table: the TDH-50P and the ER-3A inserts with foam tips); the measurements were all made during the same session, using manual audiometry, with subjects sitting in a sound booth. Swanepoel et al. (2010) also tested all listeners on the same day using both manual and automated audiometry (only automated reported in Table 4), using insert earphones under circumaural ear cups. Flamme et al. (2014) tested listeners on multiple sessions (all sessions combined in the reported data) using a TDH-39 and an HDA200 (only HDA200 with pure tones included in the table). Although the Flamme (2014) data were not obtained all during a single session, the data are included to provide a comparison with circumaural earphones test-retest. The key however, is that the outcomes for the current study were achieved in an industrial setting, outside of a sound booth, and with untrained operators. The noise present in the rooms in which participants were tested did not meet the ANSI standard for audiometric testing, and was above the OSHA standard requirement at 500 Hz, and yet test-retest average at all frequencies was less than 1 dB at all frequencies below 8 kHz, and 1.1 dB at 8 kHz. This is better than what has been obtained in a soundproof booth with insert or TDH-39 earphones (Stuart et al., 1991; Swanepoel, 2010). As presented in the appendix below, the attenuation provided by the ear cups is likely better than that provided by a single-wall transportable mini sound booth at the lower frequencies. Another reason for the high repeatability may be due to the automated nature of the test. Automated audiograms have been shown to be reliable, and as discussed earlier, the technique is commonly used in industrial audiometry.
Table 4.
Comparison of the test-retest standard deviation (of the difference between two consecutive audiograms) from the current study and other earphones reported in the literature. All except Flamme et al., 2015 did two consecutive measurements during a single session. Flamme data is included to provide a comparison with circumaural earphones. The number of ears tested is also provided.
| Frequency (Hz) |
WAHTS (this study; N=40) |
TDH-39 (Stuart et al, 1991; N=10) |
ER-3A (Stuart et al, 1991; N=10) |
ER-3A (Swanepoel et al, 2010; N=60) |
HDA200 (Flamme et al, 2015; N=49) |
|---|---|---|---|---|---|
| 125 | 4.1 | - | - | 4.8 | - |
| 250 | 2.8 | 3.3 | 4.4 | 3.5 | - |
| 500 | 3.2 | 5.2 | 3.2 | 3.6 | 3.7 |
| 1000 | 3.1 | 4.2 | 6.2 | 3.2 | 3.9 |
| 2000 | 3.2 | 5.3 | 5.7 | 4.1 | 4 |
| 3000 | 3.4 | - | - | - | 4.2 |
| 4000 | 3.6 | 4.6 | 2.6 | 4.1 | 4.1 |
| 6000 | 4.4 | - | - | - | 4.5 |
| 8000 | 5.1 | 4.6 | 5.9 | 3.2 | 5.6 |
The standard deviation of the difference (SDdiff in Dobie, 1983) also has to be interpreted in the context of the 5 dB step size typically used in audiometric testing for hearing conservation purposes. Dobie (1983) noted that SDdiff is the most useful for the purposes of assessing the reliability of industrial audiometry. Dobie’s rationale was that industrial audiometry is most concerned with detecting small changes in hearing status that might reflect an early indication of NIHL, and is less concerned with how well the test predicts the listener’s actual thresholds. Reliability may also be an important metric when considering changes in instrumentation (e.g., converting to a new earphone type for hearing testing).
Threshold Shift Implications
The early detection of NIHL in young healthy ears is especially important since hearing loss is more likely to occur in the first 10 years of hazardous noise exposure. Therefore, the ideal criterion for detection of a significant threshold shift must tag workers with a true temporary threshold shift prior to the development of a permanent threshold shift. The significant threshold criterion recommended by NIOSH (1998) occurs when a 15 dB shift from the baseline audiogram is noted at any frequency (500 to 6000 Hz) when confirmed with an immediate retest after earphone repositioning or within 30 days of testing. Agencies have advocated using a three-frequency average threshold worsening of 10 dB or more for the 2, 3, and 4 kHz on the basis of a need to reduce individual threshold variability. The current study also demonstrates that variability is reduced approximately 1 dB when using frequency averaging (2, 3, 4 kHz).
Expansion of Hearing Test Environments
For the frequencies where the majority of the study population had normal thresholds (less than 3 kHz), it was possible to measure thresholds of 0 dB HL and lower for more than 50% of subjects, including thresholds at 125 and 250 Hz. Measurements at 125 and 250 Hz are typically not performed outside of the clinical setting due to difficulties obtaining reliable measurements uncontaminated by background noise. This suggests that the headset can be used for other purposes besides occupational audiometric monitoring such as screening at low frequencies for otologic pathology related to other etiologies (e.g., otitis media, Ménière’s disease, otosclerosis). This would potentially permit the expansion of hearing testing services beyond traditional clinical audiological settings, and perhaps improve the reliability of screenings and diagnostic testing performed in less than ideal ambient noise conditions.
Comparison with the Mobile Trailer Audiometer
Thresholds were slightly improved (average difference of −1.3 dB) when measured with the WAHTS as compared to the mobile test trailer automated test at all test frequencies. This is especially noteworthy when the ambient noise levels at 500, 1000, and 2000 Hz were elevated as compared to the mobile trailer mini-test booth. This may also be related to the slightly lower ambient noise levels for the conference rooms at 125 and 250 Hz which reduced the influence of any upward spread of masking. Listeners gave a strong indication that the WAHTS provided an adequate seal against outside noise and perceived the test to be as accurate as the mobile trailer testing. We also recognized that reference equivalent threshold sound pressure level (RETSPL) values for the WAHTS were obtained with only one study population which could potentially slightly bias the results (up or down) and thus influence the extent to which there is, in fact, a difference in the absolute threshold measurements. Accurate RETSPLs should be obtained by combining RETSPL values obtained in multiple studies and laboratories. Future studies will need to be conducted to further establish the accuracy of the RETSPLs.
Usability
In terms of usability, the listeners did not experience any difficulty wearing the headset or responding to pure-tones with the iPad. The untrained operators indicated that the WAHTS was simple to understand, easy to operate, intuitive, and the on-screen directions were easy to follow. Operators also were in strong agreement that they would use this device again if given the opportunity. Perhaps less evident in the results are the observations of the researchers who noted that each test operator functioned primarily as a test proctor, just visually monitoring the progress of the testing once the headset was positioned on the listener. Listeners actually expressed a desire to position the headset on their own ears. This protocol adaptation should be further explored in future studies using the WAHTS as it may inform the potential deployment of the device in the context of group testing, such as that conducted in the military or by larger occupational mobile service providers who test eight to 10 workers simultaneously.
Future Work
Future studies will need to evaluate the accuracy and usefulness of the two microphones located in the ear cups. These microphones were added because the headset is designed specifically to enable testing in relatively noisy, uncontrolled settings, where the noise level may be high enough to mask thresholds, especially for normal ears. The vision is to use the microphones to monitor the noise at the ear in near-real time during a threshold test. Ideally, to permit accurate interpretation, the measurement would be paused or repeated if the noise level is too high during a test, or, if the noise cannot be reduced, the noise level would be reported along with the threshold. This would enable individuals with excellent hearing to get a valid measurement and provide a clear indication when noise levels are sufficiently high to elevate thresholds. Initial tests show that this can be accomplished, however, additional studies will need to evaluate the specific levels that can be tolerated without any masking effect, as measured in the ear cup. There is no standard for this novel approach at this time, and instead, the standards set the Maximum Permissible Ambient Noise Levels based on the known and measured attenuation of the ear cups.
SUMMARY
A newly developed wireless automated hearing test system (WAHTS) was successfully deployed at an occupational setting using untrained operators. Hearing test thresholds obtained in untreated open rooms exhibited within-subject test-retest reliability comparable to thresholds obtained using conventional computer-automated audiometry conducted in a single-walled sound-treated booth in a mobile trailer. Test-retest reliability of the WAHTS was on par or better than that obtained with TDH-39 supra-aural, insert, and circumaural earphones. This small initial study demonstrates that the attenuation afforded by the WAHTS is sufficient to obtain valid hearing thresholds in diverse workplace test locations without the use of sound-attenuating enclosures. A larger multi-site study is warranted to further investigate the applicability and test-retest reliability when implemented in diverse workplaces.
Acknowledgments
Appreciation is extended to the workers for their support and participation in this research. It is also a pleasure to acknowledge the helpful skills of Dania Fiorito, graduate research assistant at the University of Northern Colorado, who assisted with data collection.
DECLARATION OF INTEREST
Research reported in this publication was supported by the National Institute on Deafness and Other Communication Disorders of the National Institutes of Health under Award Number R44DC012861. The content is solely the responsibility of the authors and does not necessarily represent the official views of the National Institutes of Health. The research grant funding provided financial support to the institution employing each author for their respective work on this research.
Abbreviations
- ANSI
American National Standards Institute
- ASHA
American Speech-Language Hearing Association
- CAOHC
Counsel for Accreditation in Occupational Hearing Conservation
- dB
decibel
- dBA
decibel, A-weighted
- dBHL
decibel hearing level
- FRA
Federal Railroad Administration
- Hz
hertz
- IEC
International Electrotechnical Commission
- IQR
interquartile range
- IRB
Institutional Review Board
- ISO
International Standards Organization
- MPANL
maximum permissible ambient noise level
- MSHA
Mine Safety and Health Administration
- NHCA
National Hearing Conservation Association
- NIHL
Noise-induced hearing loss
- NIOSH
National Institute for Occupational Safety and Health
- OSHA
Occupational Safety and Health Administration
- RETSPL
reference equivalent threshold sound pressure level
- SD
standard deviation
- SPL
sound pressure level
- U.S.
United States
- WAHTS
wireless automated hearing-test system
APPENDIX: Wireless Headset attenuation
Attenuation measurements were performed according to the American National Standards Institute (ANSI) Specifications, ANSI S12.6-2008 using the experimenter-fit protocol (Method A) on the Creare Small Wireless prototype. The specified threshold measurements data were obtained using twenty normally-hearing listeners. These listeners were selected randomly as specified in ANSI S12.6-2008. Results provided by the independent laboratory performing the measurements are provided below.
Table 5.
Attenuation Values (dB SPL) versus Frequency for the Creare Wireless Automated Hearing-Test System Prototype
| Frequency (Hz) | 125 | 250 | 500 | 1000 | 2000 | 4000 | 8000 |
|---|---|---|---|---|---|---|---|
| APV80 | 25.1 | 29.0 | 35.8 | 35.2 | 33.8 | 40.8 | 44.2 |
| Average | 27.0 | 30.7 | 37.7 | 37.6 | 36.8 | 44.1 | 46.6 |
| Standard Deviation (dB) | 2.3 | 2.0 | 2.3 | 2.9 | 3.6 | 3.9 | 2.9 |
Note. For testing down to 0 dB HL, test frequency range of 500 to 8000 Hz ears covered (supra-aural earphone). Adapted from “Maximum Permissible Ambient Noise For Audiometric Test Rooms (ANSI S3.1-1999 [R2013])” by American National Standards Institute, 2008, p. 4. Adapted from Table 2 of ISO 8253-1 Acoustics – Audiometric test methods – Part 1: basic pure tone air and bone conduction threshold audiometry, International Organization for Standardization, 2010, Geneva, Switzerland. Adapted from “Occupational Noise Exposure: Hearing Conservation Amendment; Final Rule” by Occupational Safety and Health Administration, 29 CFR 1910.95, 1983, Federal Register, 48. Adapted from “Comments and Recommendations on Noise and Hearing Conservation Regulations” by the National Hearing Conservation Association and the American Speech-Language-Hearing Association, May 26, 1994.
References
- ANSI S3.1-1960. Criteria for Background Noise in Audiometer Rooms. New York: American National Standards Institute, Inc.; [Google Scholar]
- ANSI S3.6-2010. Specifications for Audiometers. New York: American National Standards Institute, Inc.; [Google Scholar]
- ANSI S3.1-1999. Maximum Permissible Ambient Noise Levels for Audiometric Test Rooms. New York: American National Standards Institute, Inc.; R2008. [Google Scholar]
- ANSI S3.21-2004. Methods for Manual Pure-Tone Threshold Audiometry. New York: American National Standards Institute, Inc.; R2009. [Google Scholar]
- ANSI S12.6-2008. Methods for Measuring the Real-Ear Attenuation of Hearing Protectors. New York: American National Standards Institute, Inc.; [Google Scholar]
- Bell-Lehmkuhler B, Meinke DK, Sedey A, Tuell C. Reliability of audiometric thresholds obtained with insert earphones when used by certified audiometric technicians. Noise Health. 2009;11(42):59–68. doi: 10.4103/1463-1741.48563. [DOI] [PubMed] [Google Scholar]
- Berger EH, Killion MC. Comparison of the noise attenuation of three audiometric earphones with additional data on masking new threshold. J Acoust Soc Am. 1989;86(4):392–1403. doi: 10.1121/1.398699. [DOI] [PubMed] [Google Scholar]
- Berger EH, Kieper RW, Gauger D. Hearing protection: Surpassing the limits to attenuation imposed by the bone-conduction pathways. J Acoust Soc Am. 2003;114(4, Pt. 1):1955–1967. doi: 10.1121/1.1605415. [DOI] [PubMed] [Google Scholar]
- Brennan-Jones CG, Eikelboom RH, Swanepoel DW, Friedland PL, Atlas MD. Clinical validation of automated audiometry with continuous noise-monitoring in a clinically heterogeneous population outside a sound-treated environment. Int J Audiol. 2016 doi: 10.1080/14992027.2016.1178858. [DOI] [PubMed] [Google Scholar]
- Carhart R, Jerger J. Preferred method for clinical determination of pure-tone thresholds. J Speech Hear Disord. 1959:1–14. [Google Scholar]
- Clark JL, Roeser RJ. Three studies comparing performance of the ER-3A tubephone with the TDH-50P earphone. Ear Hear. 1988;9(5):268–274. doi: 10.1097/00003446-198810000-00007. [DOI] [PubMed] [Google Scholar]
- Dobie RA. Reliability and validity of industrial audiometry: Implications for hearing conservation program design. Laryngoscope. 1983;93:906–927. doi: 10.1288/00005537-198307000-00014. [DOI] [PubMed] [Google Scholar]
- Flamme GA, Geda K, McGregor KD, Wyllys K, Deiters KK, Murphy WJ, Stephenson MR. Stimulus and transducer effects on threshold. Int J Aud. 2015;54(sup1):S19–S29. doi: 10.3109/14992027.2014.979300. [DOI] [PMC free article] [PubMed] [Google Scholar]
- Frank T, Williams DL. Effects of background noise on earphone thresholds. J Am Acad Audiol. 1993;4:201–212. [PubMed] [Google Scholar]
- Frank T, Williams DL. Ambient noise levels in industrial audiometric test rooms. Am Ind Hyg Assoc J. 1994;55(5):433. doi: 10.1080/15428119491018871. Retrieved from http://0-search.proquest.com.source.unco.edu/docview/236261162?accountid=12832. [DOI] [PubMed] [Google Scholar]
- Frank T, Greer AC, Magistro DM. Hearing thresholds, threshold repeatability, and attenuation values for passive noise-reducing earphone enclosures. American Industrial Hygiene Association Journal. 1997;58(11):772–778. doi: 10.1080/15428119791012261. [DOI] [PubMed] [Google Scholar]
- Franks JR. Hearing measurement. In: Goelzer B, Hansen CH, Sehrndt GA, editors. Occupational Exposure to Noise: Evaluation, Prevention and Control. Vol. 2. Geneva: World Health Organisation; 2001. pp. 183–231. [Google Scholar]
- Franks JR, Engle DP, Themann CL. Real ear attenuation at threshold for three audiometric headphone devices: Implications for maximum permissible ambient noise level standards. Ear & Hear. 1992;13(1):2–10. doi: 10.1097/00003446-199202000-00004. [DOI] [PubMed] [Google Scholar]
- Gross AH. Insert earphones for occupational hearing conservation testing. Aud Today. 2005;17:21–24. [Google Scholar]
- High WS, Glorig A. The reliability of industrial audiometry. J Aud Res. 1962;2:56–65. [Google Scholar]
- High WS, Gallo RP. Audiometric reliability in an industrial hearing conservation program. J Aud Res. 1963;3:15–34. [Google Scholar]
- Howell RW, Hartley BPR. Variability in audiometric recording. Br J Ind Med. 1972;29:432–435. doi: 10.1136/oem.29.4.432. [DOI] [PMC free article] [PubMed] [Google Scholar]
- Hunter JD. Matplotlib: A 2D graphics environment, computing in science & engineering. 2007;9:90–95. doi: 10.1109/MCSE.2007.55. [DOI] [Google Scholar]
- IEC 60645-1. Electroacoustics - Audiological equipment. Part 1 - Equipment for pure tone audiometry. Geneva, Switzerland: International Electrotechnical Commission; 2012. [Google Scholar]
- IEC-60381-1. Analogue signals for process control systems. Part 1: Direct current signals. Geneva, Switzerland: International Electrotechnical Commission; 1982. [Google Scholar]
- ISO 389-9. Acoustics - Reference zero for the calibration of audiometric equipment. Part 9: Preferred test conditions for the determination of reference hearing threshold levels. Geneva, Switzerland: International Standardization Organization; 2009. [Google Scholar]
- ISO 8253-1. 1 Acoustics – Audiometric test methods – Part 1: basic pure tone air and bone conduction threshold audiometry. International Organization for Standardization; Geneve, Switzerland: 2010. [Google Scholar]
- Jones E, Oliphant E, Peterson P, et al. SciPy: Open source scientific tools for Python. 2001 Retrieved from: http://www.scipy.org/, June 7, 2016.
- Killion MC. New insert earphones for audiometry. Hear Instr. 1984;36:28–46. [Google Scholar]
- Killion MC, Wilber LA, Gudmundsen GL. Insert earphones for more interaural attenuation. Hear Instr. 1985;36(2):34–35. [Google Scholar]
- Lankford JE, Perrone DC, Thunder TD. Ambient noise levels in mobile audiometric testing facilities: Compliance with industry standings. AAOHN Journal. 1999;47(4):163–167. Retrieved from: http://0-search.proquest.com.source.unco.edu/docview/219332789?accountid=12832. [PubMed] [Google Scholar]
- Maclennan-Smith F, Swanepoel DW, Hall JW., III Validity of diagnostic pure-tone audiometry without a sound-treated environment in older adults. International journal of audiology. 2013;52(2):66–73. doi: 10.3109/14992027.2012.736692. [DOI] [PubMed] [Google Scholar]
- Mahomed F, Eikelboom RH, Soer M. Validity of automated threshold audiometry: a systematic review and meta-analysis. Ear and hearing. 2013;34(6):745–752. doi: 10.1097/01.aud.0000436255.53747.a4. [DOI] [PubMed] [Google Scholar]
- Margolis RH, Morgan DE. Automated pure-tone audiometry: An analysis of capacity, need and benefit. Am J Audiol. 2008;17:109–113. doi: 10.1044/1059-0889(2008/07-0047). [DOI] [PubMed] [Google Scholar]
- Margolis RH, Frisina R, Walton JP. AMTAS: Automated method for testing auditory sensitivity: II. Air conduction audiograms in children and adults. Internat J Audiol. 2011;50:434–439. doi: 10.3109/14992027.2011.553206. [DOI] [PubMed] [Google Scholar]
- Margolis RH, Saly GL, Le C, Laurence J. Qualind: A method for assessing the accuracy of automated tests. J Am Acad Audiol. 2007;18:78–89. doi: 10.3766/jaaa.18.1.7. [DOI] [PubMed] [Google Scholar]
- McKinney W. Data structures for statistical computing in Python. Proceedings of the 9th Python in Science Conference. 2010:51–56. ( http://conference.scipy.org/proceedings/scipy2010/pdfs/mckinney.pdf)
- National Hearing Conservation Association and the American Speech-Language-Hearing Association. Comments and recommendations on noise and hearing conservation regulations. 1994 Retrieved from: http://www.hearingconservation.org/?page=14 on June 13, 2016.
- National Health and Nutrition Examination Survey (NHANES) Audiometry Procedures Manual. Centers for Disease Control and Prevention (CDC) 2011 Retrieved from: http://www.cdc.gov/nchs/data/nhanes/nhanes_11_12/Audiometry_Procedures_Manual.pdf on June 13, 2016.
- NIOSH. Revised criteria for a recommended standard: Occupational noise exposure (No. NIOSH Publication 98–126) Cincinnati U.S. Department of Health and Human Services, Public Health Service, Centers for Disease Control and Prevention. National Institute fo Occupational Safety and Health, DHHS; 1998. [Google Scholar]
- OSHA. Frequency of evaluating audiometric testing rooms to meet the specifications in Appendix D of the Occupational Noise standard 1910.95(h)(4) 2005 Retrieved from: https://www.osha.gov/pls/oshaweb/owadisp.show_document?p_table=INTERPRETATIONS&p_id=25072 on June 3, 2016.
- OSHA. Occupational injury and illness recording and reporting requirements. 29 CFR 1904.10: U.S. Department of labor, Occupational Safety and Health Administration. Fed. Reg. 2002;67(242):77165–77170. December 17, 2002. [Google Scholar]
- OSHA. Use of insert earphones for obtaining audiograms for OSHA 1910.95(g) compliance. 2013 Retrieved from: https://www.osha.gov/pls/oshaweb/owadisp.show_document?p_table=INTERPRETATIONS&p_id=29255 on June 3, 2016.
- Palmear PL, Hughes BJ. Self-recording audiometry in industry. Br J Ind Med. 1974;31:304–309. doi: 10.1136/oem.31.4.304. [DOI] [PMC free article] [PubMed] [Google Scholar]
- Pérez F, Granger BE. IPython: A system for interactive scientific computing. Comput Sci Eng. 2007;9(3):21–29. doi: 10.1109/MCSE.2007.53. URL: http://ipython.org. [DOI] [Google Scholar]
- Shapiro M, Galloza H. Open source mobile software platform for distributed studies of hearing; Presented at the American Auditory Society Conference; Scottsdale, AZ. March 2016; 2016. Also available on the web at http://creare-com.github.io/tabsint/ [Google Scholar]
- Sparks DW. The feasibility of computerized audiometry. J Aud Res. 1972;12:62–66. [Google Scholar]
- Stuart A, Stenstrom R, Tompkins C, Vandenhoff S. Test-retest variability in audiometric threshold with supraaural and insert earphones among children and adults. Audiology. 1991;30(2):82–90. doi: 10.3109/00206099109072873. [DOI] [PubMed] [Google Scholar]
- Swanepoel W, Maclennan-Smith F, Hall JW. Diagnostic pure-tone audiometry in schools: Mobile testing without a sound-treated environment. J Acad Audio. 2013;24:992–1000. doi: 10.3766/jaaa.24.10.10. [DOI] [PubMed] [Google Scholar]
- Swanepoel W, Mngemane S, Molemong S, et al. Hearing assessment-reliability, accuracy, and efficiency of automated audiometry. Telemed J E-Health: the official journal of the American Telemedicine Association. 2010;16:557–563. doi: 10.1089/tmj.2009.0143. [DOI] [PubMed] [Google Scholar]
- U.S. Mine Safety and Health Administration. Health standards for occupational noise exposure; Final rule. U.S. Department of Labor, Mine Safety and Health Administration, 30 CFR Part 62, 64. Fed. Regist. 2000:49458–49634. 49636–49637. [PubMed] [Google Scholar]
- U.S. Occupational Safety and Health Administration. Occupational noise exposure; hearing conservation amendment; Final rule (29 CFR 1910.95) Fed Regist. 1983;48(46):9738–9785. [Google Scholar]
- Waskom M. http://dx.doi.org/10.5072/zenodo.12710.
- Williams W. The calculation of maximum permissible ambient noise levels for audiometric testing to a given threshold level with a specified uncertainty. National Acoustics Lab Report No. 133. 2010:1–11. [Google Scholar]