

Abstract
Despite insufficient laboratory data, radiotherapy after intratumoral injection of hydrogen peroxide (H2O2) is increasingly being used clinically for radioresistant tumors. Especially, this treatment might become an alternative definitive treatment for early and advanced breast cancer in patients who refuse any type of surgery. The purpose of this study was to investigate the biological effects and appropriate combination methods of irradiation and H2O2 in vivo. SCCVII tumor cells transplanted into the legs of C3H/HeN mice were used. Chronological changes of intratumoral distribution of oxygen bubbles after injection of H2O2 were investigated using computed tomography. The effects of H2O2 alone and in combination with single or five‐fraction irradiation were investigated using a growth delay assay. The optimal timing of H2O2 injection was investigated. Immunostaining of tumors was performed using the hypoxia marker pimonidazole. Oxygen bubbles decreased gradually and almost disappeared after 24 h. Administration of H2O2 produced 2–3 days’ tumor growth delay. Tumor regrowth was slowed further when H2O2 was injected before irradiation. The group irradiated immediately after H2O2 injection showed the longest tumor growth delay. Dose‐modifying factors were 1.7–2.0 when combined with single irradiation and 1.3–1.5 with fractionated irradiation. Pimonidazole staining was weaker in tumors injected with H2O2. H2O2 injection alone had modest antitumor effects. Greater tumor growth delays were demonstrated by combining irradiation and H2O2 injection. The results of the present study could serve as a basis for evaluating results of various clinical studies on this treatment.
Keywords: Hydrogen peroxide, hypoxia, oxygen bubbles, radiotherapy, sodium hyaluronate
The decrease in therapeutic effects of radiotherapy for large tumors, compared with small tumors, is well known from various experimental and clinical data. One of the reasons for this decrease is the presence of hypoxic cells.1, 2 Other causes of radioresistance include the presence of anti‐oxidative enzymes such as peroxide and catalase that neutralize reactive oxygen species produced by irradiation.1 So far, various strategies to enhance radiation effects have been developed and tested in clinical trials. These include hyperbaric oxygen, nitroazole sensitizers and hypoxic cytotoxin.3, 4 Hypoxic cell radiosensitizers have been investigated extensively, but the results remain inconclusive; they may have effects when combined with high‐dose‐per‐fraction radiotherapy such as intraoperative radiotherapy,5, 6 whereas with conventional fractionated radiotherapy, it may be rather difficult to demonstrate clinical efficacy.
To overcome the radioresistance of large tumors undergoing radiotherapy, Kochi Oxydol‐Radiation Therapy for Unresectable Carcinomas (KORTUC) using hydrogen peroxide (H2O2) as a radiosensitizer was developed at the Department of Radiology, Kochi University, Japan.7, 8 In this treatment, H2O2 mixed with sodium hyaluronate is injected intratumorally two or three times every week during radiotherapy. The treatment has spread steadily and remarkable efficacy has been reported clinically.9, 10 KORTUC has shown definite effects even when combined with conventionally fractionated radiation therapy. Based on these encouraging results, a clinical trial was started also in the United Kingdom.
Despite the progress of clinical studies, however, biological data to support the efficacy of this approach is still insufficient. The investigators at Kochi University only reported partial laboratory data showing the efficacy of once‐weekly administration of H2O2 with gelatin‐based hydrogel (instead of sodium hyaluronate) and irradiation in tumor‐bearing mice using a small number of mice (n = 6 per group).11 However, the optimal timing of H2O2 administration, the magnitude of enhancement and the efficacy when combined with fractionated irradiation have not been investigated. The purpose of this study was to thoroughly investigate the biological effects and appropriate combination methods of irradiation and H2O2 in vivo.
Materials and Methods
Tumors, mice, hydrogen peroxide preparation and irradiation
All experiments were approved by the Animal Ethics Committee and were conducted in accordance with the principles of Nagoya City University in Japan. SCCVII cells (a squamous cell carcinoma line) and female C3H/HeN mice were used throughout the study. Characteristics of the tumors were described in detail previously.12 The treatment for the right hind legs of the mice could be most readily and quickly performed compared with that for other sites. Therefore, it was considered suitable to transplant SCCVII cells into the right hind legs of the mice. SCCVII cells cultured in vitro were transplanted subcutaneously into the right hind legs (5 × 10⁵ cells per leg) of 8‐week‐old mice. Experiments were carried out when the mean diameter of the tumors reached approximately 10 mm at 11 or 12 days after tumor cell inoculation, except for the experiments to investigate oxygen bubble distribution using computed tomography (CT). Twelve mice were used for each irradiated group. In all experiments, 0.5% w/v (0.147 mol/L) H2O2 (Oxydol; Ken‐ei Pharmaceutical Co. Ltd., Osaka, Japan) was prepared with sodium hyaluronate (ARTZ Dispo; Seikagaku Corporation, Tokyo, Japan) in accordance with the regimen of previous investigations.13 Sodium hyaluronate was used to relieve pain at the site of injection and preserve high intratumoral oxygen concentration.13 The tumor‐bearing legs of the mice were fixed with adhesive tape without anesthesia at the time of injection and irradiation, in accordance with the method described in detail previously;14 this method appeared not to excessively stress the mice. A thin needle (26 G needle for Tuberculin; Terumo Corporation, Tokyo, Japan) was used for injection. H2O2 was injected into the centers of the tumors slowly over approximately 15 s, paying attention not to cause pain to the mice. The whole body was shielded using thick lead except for the tumor‐bearing leg. Irradiation was performed using a 210‐kVp X‐ray machine (10 mA with a 2‐mm Al filter; Chubu Medical Co., Matsusaka, Japan) at a dose rate of 2.2 Gy/min as described in detail previously.15
Distribution of oxygen bubbles in tumor
First, changes of intratumoral distribution of oxygen bubbles over time after injection of H2O2 were investigated using a 16‐row multislice CT (Optima CT 580W; General Electric, Fairfield, CT, USA) with three mice per group. The tube voltage, tube current, field of view, and matrix size were 120 kV, 344 mA, 50.0 cm, and 512 pixels, respectively. This experiment was carried out when the mean diameter of the tumors reached about 14 mm, considering the ease of observing oxygen bubbles on CT. Three volumes (0.25, 0.5 and 1.0 mL) of 0.5% w/v H2O2 prepared in sodium hyaluronate were investigated. For control groups, 0.5 mL sodium hyaluronate was injected. The tumors were serially scanned until 24 h after H2O2 injection. The proportion of oxygen bubbles in the tumor was analyzed quantitatively on CT slices of maximal tumor size using ImageJ Version 1.49, an open source image processing software developed at the National Institutes of Health (Bethesda, MD, USA).16
Tumor growth delay assay
First, to investigate the effects of sodium hyaluronate and H2O2 injection alone, 0.5 mL sodium hyaluronate with or without 0.5% w/v H2O2 was administered intratumorally. The solutions were injected once, three times every other day, or five times every other day. To investigate the effect of sodium hyaluronate, 0.5 mL saline was injected for comparison.
Second, the combined effects of single irradiation and H2O2 were examined, with 0.5 mL 0.5% w/v H2O2 administered intratumorally. The tumors were irradiated with 18 Gy immediately (about 1 min) after injection or 15, 30, 60 or 120 min later. As a control, the tumors were also irradiated with 18 Gy after injection of 0.5 mL sodium hyaluronate.
Third, to estimate the dose‐modifying factor of this treatment, the tumors were irradiated with graded doses of 7, 14 and 21 Gy immediately after injection of sodium hyaluronate with or without H2O2.
Fourth, the combined effects of H2O2 and fractionated irradiation were examined; 2, 3, 4 or 5 Gy was administered five times over 5 days, once a day, with or without H2O2. The irradiation interval was 24 h. H2O2 was administered just before irradiation every other day (first, third and fifth days), simulating the clinical situation, for a total of three times.
In all experiments, the three dimensions of each tumor were measured every other day using a caliper. The tumor volumes were calculated as V = π/6 × products of the three dimensions. The tumor growth time (TGT) was defined as the time required for a tumor to reach 2.5 times the initial volume. The tumor growth delay time (TGDT) was calculated as the TGT in each treated group minus the TGT in the control group.
Immunofluorescence staining
To evaluate hypoxic regions in tumors, a hypoxia marker, pimonidazole, was used.17 Initially, 0.5 mL 0.5% w/v H2O2 was injected into 1‐cm sized tumors. After 15 min, pimonidazole HCl (Hypoxyprobe‐1; Hypoxyprobe Inc., Burlington, MA, USA) was administered intravenously to treated mice as a single 60 mg/kg dose. After 60 min, the mice were killed and the tumors were quickly removed. The tumors were fixed in 4% v/v formaldehyde, embedded in paraffin and sectioned at 5‐μm thickness with a microtome. Each slide was stained with fluorescein isothiocyanate‐conjugated anti‐pimonidazole mouse monoclonal IgG1 antibody (FITC‐MAb1 included in the Hypoxyprobe‐1 kit). Images were captured using a fluorescence microscope. The proportions of pimonidazole‐positive areas in the tumor specimen were analyzed quantitatively on the slide of maximal tumor size using ImageJ.
Statistical analysis
All statistical analyses were carried out using an open source software R Version 3.2.3 (The R Foundation for Statistical Computing, Vienna, Austria). Differences between pairs of growth delay curves were analyzed by two‐way analysis of variance, followed by post hoc Tukey's HSD (honestly significant difference) test. Differences in the proportion of oxygen bubbles on CT images between the groups injected with H2O2 at different timings were analyzed by Tukey's HSD test. Differences in the proportion of pimonidazole‐positive areas between the H2O2‐injected and control groups were analyzed by Student's t‐test.
Results
Distribution of oxygen bubbles in the tumor
Figure 1 shows CT images of the tumors at various times after injection of sodium hyaluronate with or without H2O2. For each group, one mouse showing representative images was chosen among the three mice per group. After injection of sodium hyaluronate alone, no bubbles were seen at 0 and 24 h after injection. On the other hand, oxygen bubbles were seen in all groups until 12 h after H2O2 + sodium hyaluronate injection, and at 24 h in one mouse in each group (three of the nine mice in total). In Figure 1, the proportions of bubbles in the tumors on the CT images are also shown. The proportions were largest immediately after H2O2 injection and decreased gradually until 24 h. Even by increasing the volume of injection, the proportion of bubbles did not necessarily increase, so 0.5 mL of H2O2 with sodium hyaluronate was used throughout the subsequent experiments.
Figure 1.

Changes in the intratumoral distribution of oxygen bubbles over time after injection of sodium hyaluronate with or without H2O2. The mean values below the images represent the percentage of oxygen bubbles on CT slices of the maximum tumor size (three mice per group). Compared with the groups receiving H2O2 immediately (1 min) before scanning, all the other groups had significantly smaller proportions of oxygen bubbles (P < 0.05). In the mice receiving 0.5‐mL injection, there were no differences in the proportion of oxygen bubbles among the 15‐min, 30‐min, and 60‐min groups (15 min vs 30 min: P = 0.18; 15 min vs 60 min: P = 0.057; 30 min vs 60 min: P = 0.65).
Tumor growth delay assay
Figure 2(a,b) shows tumor growth delay curves after intratumoral injection (1, 3 or 5 times) of sodium hyaluronate or H2O2 + sodium hyaluronate. Injection of sodium hyaluronate alone had no effect, but H2O2 injection produced modest growth delay, irrespective of the number of injections. Table 1 shows TGT after each treatment. The mean TGT was elongated by 2–3 days by H2O2 injection.
Figure 2.

Growth delay curves of SCCVII tumors. (a) Effects of sodium hyaluronate. ●, control (saline injection);  , single sodium hyaluronate injection on day 0;
  , three sodium hyaluronate injections on days 0, 2 and 4;
  five sodium hyaluronate injections on days 0, 2, 4, 6 and 8. Bars represents SE of 12 mice. (b) Effects of H2O2. ●, control (sodium hyaluronate injection);
  H2O2 with sodium hyaluronate, a single injection on day 0;
  , H2O2 with sodium hyaluronate, three injections on days 0, 2 and 4;
  , H2O2 with sodium hyaluronate, five injections on days 0, 2, 4, 6 and 8. Bars represents SE of 12 mice. (c) Influence of the interval between H2O2 injection and irradiation. −, control (sodium hyaluronate);
  , H2O2 with sodium hyaluronate;
  , sodium hyaluronate + 18 Gy;
  , H2O2 with sodium hyaluronate + 18 Gy (1 min interval);
  , H2O2 with sodium hyaluronate + 18 Gy (15 min);
  , H2O2 with sodium hyaluronate + 18 Gy (30 min);
  , H2O2 with sodium hyaluronate + 18 Gy (60 min);
  , H2O2 with sodium hyaluronate + 18 Gy (120 min). Bars represent SE of 6 (non‐irradiated groups) or 12 mice (irradiated groups).
Table 1.
Tumor growth time (TGT)
| Drug and treatment | TGT (days) | P | |
|---|---|---|---|
| Mean | SE | ||
| Control (saline) | 7.5 | 0.3 | – |
|
Sodium hyaluronate single injection |
7.2 | 0.3 | 0.97a |
|
Sodium hyaluronate three injections |
8.0 | 0.3 | 0.57a |
|
Sodium hyaluronate five injections |
8.1 | 0.3 | 0.38a |
| Control (sodium hyaluronate) | 7.4 | 0.3 | − |
| H2O2 + sodium hyaluronate single injection |
9.5 | 0.5 | 0.005b |
|
H2O2 + sodium hyaluronate three injections |
10.6 | 0.4 | <0.001b |
|
H2O2 + sodium hyaluronate five injections |
10.4 | 0.3 | <0.001b |
Against control (saline).
Against control (sodium hyaluronate).
Figure 2(c) shows TGDTs after a single 18‐Gy irradiation with or without prior H2O2 injection at various intervals. Table 2 (first column) shows TGDT after each treatment. In the groups receiving H2O2 injection at 1, 15, 30, 60 or 120 min before irradiation, the tumor regrowth was significantly elongated, compared with the control 18‐Gy group. The group irradiated immediately (1 min) after the injection showed the largest tumor growth delay, but there were no differences among the 15‐, 30‐, and 60‐min groups (15 min vs 30 min: P = 0.79; 15 min vs 60 min: P = 0.69; 30 min vs 60 min: P = 0.98). In all subsequent experiments, H2O2 + sodium hyaluronate was injected immediately before irradiation.
Table 2.
Tumor growth delay time (TGDT) after various treatments
| After H2O2 ± 18 Gy | TGDT (days) | P | ||
|---|---|---|---|---|
| Mean | SE | a | a | |
| H2O2 + sodium hyaluronate | 3.4 | 0.8 | − | − |
| Sodium hyaluronate → 18 Gy | 12.2 | 0.7 | − | − |
| H2O2 – 1 min → 18 Gy | 21.7 | 0.8 | <0.001 | − |
| H2O2 − 15 min → 18 Gy | 16.5 | 1.2 | 0.006 | 0.002 |
| H2O2 − 30 min → 18 Gy | 17.7 | 1.2 | <0.001 | 0.014 |
| H2O2 − 60 min → 18 Gy | 18.0 | 1.3 | <0.001 | 0.030 |
| H2O2 − 120 min → 18 Gy | 16.0 | 1.4 | 0.031 | 0.003 |
| Mean | SE | P | ||
|---|---|---|---|---|
| After H2O2 + graded single doses | ||||
| H2O2 + sodium hyaluronate | 2.9 | 0.4 | − | |
| Sodium hyaluronate + 7 Gy | 6.6 | 0.3 | − | |
| Sodium hyaluronate + 14 Gy | 9.0 | 0.3 | − | |
| Sodium hyaluronate + 21 Gy | 14.3 | 0.5 | − | |
| H2O2 + 7 Gy | 10.6 | 0.5 | <0.001 | |
| H2O2 + 14 Gy | 15.3 | 0.4 | <0.001 | |
| H2O2 + 21 Gy | 26.2 | 0.7 | <0.001 | |
| After H2O2 + 5‐fraction irradiation | ||||
| H2O2 | 2.1 | 0.3 | − | |
| Sodium hyaluronate + 3 Gy × 5 | 8.6 | 0.6 | − | |
| Sodium hyaluronate + 4 Gy × 5 | 14.3 | 0.8 | − | |
| Sodium hyaluronate + 5 Gy × 5 | 25.6 | 0.7 | − | |
| H2O2 + 2 Gy × 5 | 7.6 | 0.6 | − | |
| H2O2 + 3 Gy × 5 | 15.7 | 0.8 | <0.001 | |
| H2O2 + 4 Gy × 5 | 23.3 | 1.0 | <0.001 | |
P‐values are against the groups receiving the same doses without H2O2.
Against 18 Gy.
Against H2O2 – 1 min → 18 Gy.
Figure 3(a) shows tumor growth delay curves after single graded doses of irradiation (7, 14 and 21 Gy) with or without H2O2. Figure 3(b) and Table 2 (second column) show TGDT. In all groups injected with H2O2, the tumor regrowth was significantly elongated, compared with the groups receiving sodium hyaluronate injection + irradiation. From Figure 3(b), the overall dose‐modifying factors appeared to be 1.7–2.0 depending on the dose level. Figure 3(c) shows tumor growth delay curves after fractionated irradiation with or without prior H2O2 injection. Figure 3(d) and Table 2 (third column) show TGDT. In the 3 × 5 Gy and 4 × 5 Gy groups injected with H2O2, the tumor regrowth was significantly elongated compared with the group receiving irradiation without H2O2. From Figure 3(d), the dose‐modifying factors appeared to be 1.3–1.5 depending on the dose level.
Figure 3.
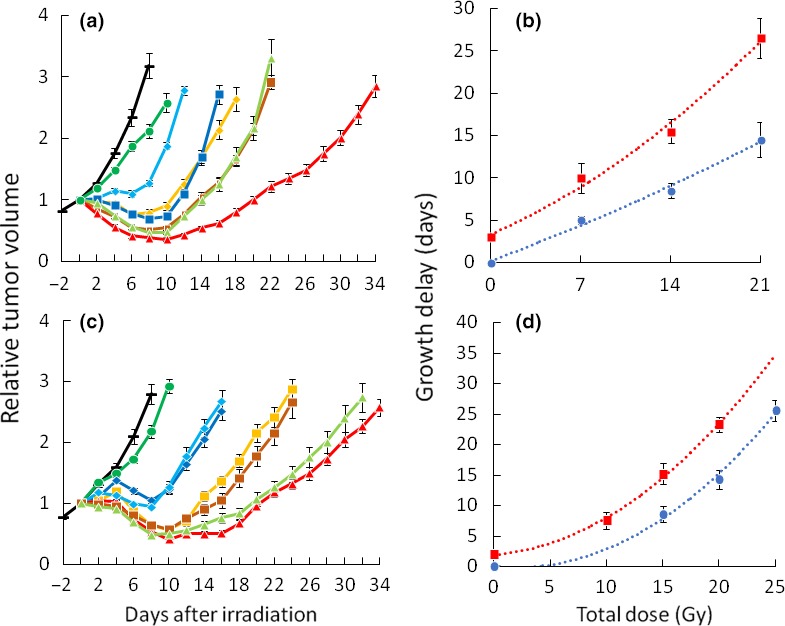
Growth delay curves and times of SCCVII tumors. (a) Effects of H2O2 injection plus graded doses of irradiation. −, control (sodium hyaluronate);  , H2O2 with sodium hyaluronate;
  , sodium hyaluronate + 7 Gy;
  , H2O2 with sodium hyaluronate + 7 Gy;
  , sodium hyaluronate + 14 Gy;
  , H2O2 with sodium hyaluronate + 14 Gy;
  , sodium hyaluronate + 21 Gy;
  , H2O2 with sodium hyaluronate + 21 Gy. (b) Growth delay time as a function of radiation dose:
  , sodium hyaluronate + radiation;
  , H2O2 with sodium hyaluronate + radiation. (c) Effects of H2O2 injection plus fractionated irradiation. −, control (sodium hyaluronate);
  , H2O2 with sodium hyaluronate;
  , sodium hyaluronate + 3 Gy × 5 times;
  , H2O2 with sodium hyaluronate + 2 Gy × 5 times;
  , sodium hyaluronate + 4 Gy × 5 times;
  , H2O2 with sodium hyaluronate + 3 Gy × 5 times;
  , sodium hyaluronate + 5 Gy × 5 times;
  , H2O2 with sodium hyaluronate + 4 Gy × 5 times. All sodium hyaluronate with or without H2O2 was injected three times on days 0, 2 and 4. All irradiation was delivered five times on days 0–4. (d) Growth delay time as a function of total radiation dose.
 , sodium hyaluronate injection + radiation;
 , H2O2 with sodium hyaluronate injection + radiation. (a, c) Bars represent SE of 6 (non‐irradiated groups) or 12 mice (irradiated groups). (b, d) Bars represent SE. Curves were drawn by the quadratic polynomial approximate method.
Immunofluorescent staining
Figure 4 shows the immunofluorescent staining of SCCVII tumors. The centers of untreated tumors were clearly stained with pimonidazole, whereas the staining was weaker in tumors injected with H2O2. In the tumors injected with H2O2, the proportion of pimonidazole‐positive areas was significantly lower than that of the control group (n = 4/group, 3.3 ± 0.3% vs 6.1 ± 0.7%, P = 0.001).
Figure 4.
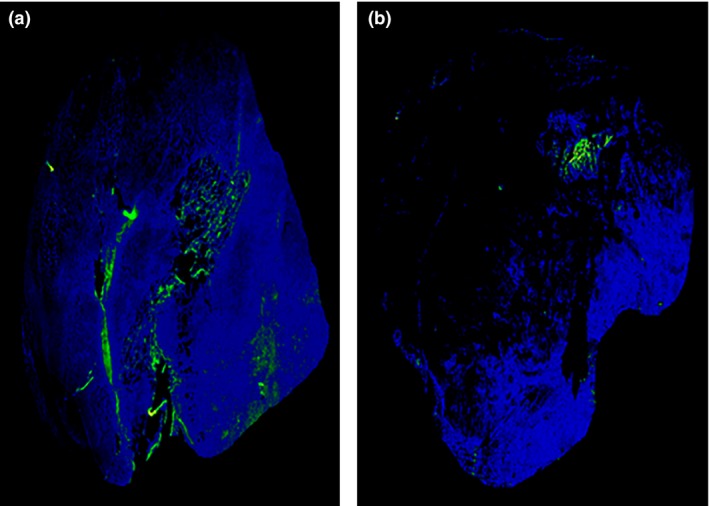
Immunofluorescent staining of SCCVII tumors at 60 min after intravenous pimonidazole administration. The blue areas represent tumors, and the green areas represent pimonidazole‐positive cells. (a) Control (sodium hyaluronate injection 15 min before pimonidazole). (b) H2O2 with sodium hyaluronate injection 15 min before pimonidazole administration.
Discussion
Although radiotherapy with H2O2 injection (KORTUC treatment) for large tumors has been used clinically, experimental data on appropriate combination methods have been lacking. This is the first detailed laboratory study to systematically investigate the in vivo efficacy of the treatment and appropriate combination methods. In applying this new treatment, the quality assurance of intratumoral H2O2 injection and its safety may be the issues that should be clarified. In the present study, H2O2 was injected from above into the center of the tumor in all tumors, so the quality of H2O2 injection may be assured. Clinically, the quality assurance of injection may be more difficult due to the variety of tumor site, size, and shape. To solve the problem, we are using CT‐guided injection in all cases, and other investigators use ultrasound‐guided injection. In previous publications as well as in our preliminary clinical experiences, the safety of KORTUC treatment has almost been established.(7, 8, 9, 10, 11, 18)
Intratumoral oxygen pressures at 1 or 24 h after H2O2‐containing sodium hyaluronate injections were reported previously.13 Oxygen pressures increased to 1400–1600 mmHg 1 h later and decreased to 80–100 mmHg at 24 h. Our CT study results seemed to be consistent with the previous results. Sufficient oxygen bubbles were detected on CT images at 0–1 h. In contrast, oxygen bubbles were almost undetected 24 h later. This result could suggest the optimal timing of injection, which is discussed later. Oxygen bubble distribution on CT has also been reported in human cancers recently.19 We used 0.5 mL of H2O2 + sodium hyaluronate, while clinically 3–6 mL is injected to human tumors. Since the volume of the SCCVII tumors in this study is about one‐fifth or smaller compared to human tumors, the ratio of the volume of H2O2 solution to the tumor volume used in this study may not greatly deviate from that used in clinics.
Various functions of H2O2 have been reported in literature. It was reported that DNA damage caused by H2O2 induces cell death by apoptosis or necrosis.20, 21 It was also reported that lysosomal rupture caused by H2O2 induces apoptosis.22 Modest cytotoxicity of H2O2 in tumor cells was confirmed in this study. Contrary to our expectations, there was no additional tumor growth delay by increasing the number of H2O2 injections. In other words, cell damage in the center of the tumor was induced by a single H2O2 injection, and additional H2O2 injections into the damaged regions were not effective. In the immunofluorescence staining, the centers of the tumors injected with H2O2 were partially destroyed, and the weaker pimonidazole staining and decrease of pimonidazole‐positive areas suggested the improvement of hypoxic conditions. In the present study, H2O2 injection was performed at 48 h intervals, and it is not known whether repeated H2O2 injection at shorter or longer intervals might induce additional cell death, and this should be investigated in the next study. If additional cell death is observed using longer intervals, repeat H2O2 injection over several weeks could be efficient as a cytotoxic treatment. In addition, while H2O2 was always injected into the center of the tumors in this study, it may be clinically possible to inject H2O2 to slightly different sites within the tumor each time when the tumor is large. By doing so, the effect of H2O2 itself may be better utilized. This should be a topic of future investigation.
Although a single H2O2 injection proved to have modest cytotoxic effects, combination with irradiation appeared to produce additional sensitizing effects, because the combined effect was dependent on the interval between H2O2 injection and irradiation. In contrast to the clinical experiences, only modest tumor shrinkage was observed in our experiments, but this is due to the radioresistance of SCCVII tumors that show marked shrinkage at doses >22.5 Gy.23 So, tumor control experiments using higher doses may be necessary in future. Nevertheless, this combined effect is probably mostly because of the increase in oxygenated cells, considering the results of pimonidazole staining. Overall dose‐modifying factors appeared to be 1.7–2.0 when combined with single high doses and 1.3–1.5 when combined with fractionated irradiation. With these levels of dose‐modifying factors, it is reasonable that definite clinical effects are demonstrated. Regarding the optimal timing of H2O2 injection, irradiation immediately after injection appeared to yield the best results. This was consistent with the observation on CT images. Although it may be difficult to inject H2O2 1 min before irradiation, it is recommended to inject H2O2 as shortly before irradiation as possible. In recent clinical practice, H2O2 is most often delivered twice a week (on Monday and Wednesday) while radiotherapy is given 5 days a week. This is because everyday injection is labor‐intensive and uncomfortable to patients. However, based on the distribution of oxygen bubbles and biological effects, such an administration schedule may not be optimal. This should be a topic of further investigation whether everyday injection yields higher effects.
Despite the paucity of laboratory data, clinical use of H2O2 before radiotherapy is rapidly spreading in Japan. In addition, phase I followed by phase II clinical studies were started in 2016 at the Royal Marsden Hospital, London (Y. Ogawa, personal communication, March 2017). There have been no randomized studies, but phase II studies in operable breast cancer patients have indicated definite efficacy.18 The investigators suggested that this treatment might become an alternative definitive treatment for early and advanced breast cancer in patients who refuse any type of surgery. Efficacy against other tumors has also been reported.10 We have also started a clinical study to evaluate the safety and efficacy of treatment after approval of the institutional review board. We are mainly using this treatment for breast cancer patients who refuse surgery. Preliminary results are encouraging, and the effect appears to be apparently stronger than that obtained by radiation alone. The KORTUC treatment seems to be a promising new radiosensitization modality for locally advanced non‐deep‐seated tumors.
In conclusion, this study showed the in vivo efficacy of radiotherapy combined with prior intratumoral H2O2 injection. A dose‐modifying factor of 1.3–1.5 would be expected when combined with fractionated radiotherapy. The results of the present study could serve as a basis for evaluating results of various clinical studies on this treatment that are already ongoing.
Disclosure Statement
The authors have no conflict of interest.
Acknowledgments
The study was supported in part by Grants‐in‐Aids for Scientific Research from the Japanese Ministry of Education, Culture, Sports, Science, and Technology. The authors are grateful to Mr. Yasujiro Hirose for technical support.
Cancer Sci 108 (2017) 1787–1792
Funding Information
Japanese Ministry of Education, Culture, Sports, Science, and Technology (Grant number: 15K10006)
References
- 1. Hall EJ. The oxygen effect and reoxygenation In: Hall EJ, ed. Radiobiology for the Radiologist, 5th edn Philadelphia, PA: J.B. Lippincott Co, 2000; 91–111. [Google Scholar]
- 2. Shibamoto Y, Yukawa Y, Tsutsui K, Takahashi M, Abe M. Variation in the hypoxic fraction among mouse tumors of different types, sizes, and sites. Jpn J Cancer Res 1986; 77: 908–15. [PubMed] [Google Scholar]
- 3. Overgaard J. Hypoxic radiosensitization: adored and ignored. J Clin Oncol 2007; 25: 4066–74. [DOI] [PubMed] [Google Scholar]
- 4. Brown JM. The hypoxic cell: a target for selective cancer therapy – eighteenth Bruce F. Cain Memorial Award lecture. Cancer Res 1999; 59: 5863–70. [PubMed] [Google Scholar]
- 5. Shibamoto Y, Ohshio G, Hosotani R et al A phase I/II study of a hypoxic cell radiosensitizer KU‐2285 in combination with intraoperative radiotherapy. Br J Cancer 1997; 76: 1474–9. [DOI] [PMC free article] [PubMed] [Google Scholar]
- 6. Karasawa K, Sunamura M, Okamoto A et al Efficacy of novel hypoxic cell sensitiser doranidazole in the treatment of locally advanced pancreatic cancer: long‐term results of a placebo‐controlled randomised study. Radiother Oncol 2008; 87: 326–30. [DOI] [PubMed] [Google Scholar]
- 7. Ogawa Y, Ue H, Tsuzuki K et al New radiosensitization treatment (KORTUC I) using hydrogen peroxide solution‐soaked gauze bolus for unresectable and superficially exposed neoplasms. Oncol Rep 2008; 19: 1389–94. [PubMed] [Google Scholar]
- 8. Ogawa Y, Kubota K, Ue H et al Phase I study of a new radiosensitizer containing hydrogen peroxide and sodium hyaluronate for topical tumor injection: a new enzyme‐targeting radiosensitization treatment, Kochi Oxydol‐Radiation Therapy for Unresectable Carcinomas, Type II (KORTUC II). Int J Oncol 2009; 34: 609–18. [DOI] [PubMed] [Google Scholar]
- 9. Miyatake K, Kubota K, Ogawa Y, Hamada N, Murata Y, Nishioka A. Non‐surgical care for locally advanced breast cancer: radiologically assessed therapeutic outcome of a new enzyme‐targeting radiosensitization treatment, Kochi Oxydol‐Radiation Therapy for Unresectable Carcinomas, Type II (KORTUC II) with systemic chemotherapy. Oncol Rep 2010; 24: 1161–8. [DOI] [PubMed] [Google Scholar]
- 10. Nishioka A, Ogawa Y, Miyatake K et al Safety and efficacy of image‐guided enzyme‐targeting radiosensitization and intraoperative radiotherapy for locally advanced unresectable pancreatic cancer. Oncol Lett 2014; 8: 404–8. [DOI] [PMC free article] [PubMed] [Google Scholar]
- 11. Morita‐Tokuhiro S, Ogawa Y, Yokota N et al Development of a novel enzyme‐targeting radiosensitizer (new KORTUC) using a gelatin‐based hydrogel instead of a sodium hyaluronate. Cancers (Basel) 2016; 8: 10. [DOI] [PMC free article] [PubMed] [Google Scholar]
- 12. Shibamoto Y, Streffer C, Fuhrmann C, Budach V. Tumor radiosensitivity prediction by the cytokinesis‐block micronucleus assay. Radiat Res 1991; 128: 293–300. [PubMed] [Google Scholar]
- 13. Tokuhiro S, Ogawa Y, Tsuzuki K et al Development of a new enzyme‐targeting radiosensitizer (KORTUC) containing hydrogen peroxide for intratumoral injection for patients with low linear energy transfer (LET) radioresistant neoplasms. Oncol Lett 2010; 1: 1025–8. [DOI] [PMC free article] [PubMed] [Google Scholar]
- 14. Shibamoto Y, Sasai K, Abe M. The radiation response of SCCVII tumor cells in C3H/He mice varies with the irradiation conditions. Radiat Res 1987; 109: 352–4. [PubMed] [Google Scholar]
- 15. Shibamoto Y, Ito M, Sugie C, Ogino H, Hara M. Recovery from sublethal damage during intermittent exposures in cultured tumor cells: implications for dose modification in radiosurgery and IMRT. Int J Radiat Oncol Biol Phys 2004; 59: 1484–90. [DOI] [PubMed] [Google Scholar]
- 16. Schneider CA, Rasband WS, Eliceiri KW. NIH Image to ImageJ: 25 years of image analysis. Nat Methods 2012; 9: 671–5. [DOI] [PMC free article] [PubMed] [Google Scholar]
- 17. Dhani NC, Serra S, Pintilie M et al Analysis of the intra‐ and intertumoral heterogeneity of hypoxia in pancreatic cancer patients receiving the nitroimidazole tracer pimonidazole. Br J Cancer 2015; 113: 864–71. [DOI] [PMC free article] [PubMed] [Google Scholar]
- 18. Ogawa Y, Kubota K, Aoyama N et al Non‐surgical breast‐conserving treatment (KORTUC‐BCT) using a new radiosensitization method (KORTUC II) for patients with Stage I or II breast cancer. Cancers (Basel) 2015; 7: 2277–89. [DOI] [PMC free article] [PubMed] [Google Scholar]
- 19. Hayashi N, Ogawa Y, Kubota K et al Computed tomography demonstration of the production and distribution of oxygen gas following intratumoral injection of a new radiosensitizer (KORTUC) for patients with breast cancer – is intratumoral injection not an ideal approach to solve the major problem of tumor hypoxia in radiotherapy? Cancers (Basel) 2016; 8: 43. [DOI] [PMC free article] [PubMed] [Google Scholar]
- 20. Imlay JA, Chin SM, Linn S. Toxic DNA damage by hydrogen peroxide through the Fenton reaction in vivo and in vitro . Science 1988; 240: 640–2. [DOI] [PubMed] [Google Scholar]
- 21. Meneghini R. Iron homeostasis, oxidative stress, and DNA damage. Free Radic Biol Med 1997; 23: 783–92. [DOI] [PubMed] [Google Scholar]
- 22. Zhao M, Antunes F, Eaton JW, Brunk UT. Lysosomal enzymes promote mitochondrial oxidant production, cytochrome c release and apoptosis. Eur J Biochem 2003; 270: 3778–86. [DOI] [PubMed] [Google Scholar]
- 23. Shibamoto Y, Zhou L, Hatta H, Mori M, Nishimoto S. In vivo evaluation of a novel antitumor prodrug, 1‐(2′‐oxopropyl)‐5‐fluorouracil (OFU001), which releases 5‐fluorouracil upon hypoxic irradiation. Int J Radiat Oncol Biol Phys 2001; 49: 407–13. [DOI] [PubMed] [Google Scholar]