

Abstract
Background
Genomic alterations in blood-derived circulating tumor DNA (ctDNA) from patients with non-small cell lung adenocarcinoma (NSCLC) were ascertained and correlated with clinical characteristics and therapeutic outcomes.
Methods and Findings
Comprehensive plasma ctDNA testing was performed in 88 consecutive patients; 34 also had tissue next generation sequencing; 29, other forms of genotyping; and 25 (28.4%) had no tissue molecular tests because of inadequate tissue or biopsy contraindications. Seventy-two patients (82%) had ≥ 1 ctDNA alteration(s); amongst these, 75% carried alteration(s) potentially actionable by FDA-approved (61.1%) or experimental drug(s) in clinical trials (additional 13.9%). The most frequent alterations were in TP53 (44.3% of patients), EGFR (27.3%), MET (14.8%), KRAS (13.6%), and ALK (6.8%) genes. The concordance rate for EGFR alterations was 80.8% (100% versus 61.5% (≤ 1 versus > 1 month between tests; P = 0.04)) for patients with any detectable ctDNA alterations. Twenty-five patients (28.4%) received therapy matching ≥ 1 ctDNA alteration(s); 72.3% (N=16/22) of the evaluable matched patients achieved stable disease ≥ 6 months (SD) or partial response (PR). Five patients with ctDNA-detected EGFR T790M were subsequently treated with a third generation EGFR inhibitor; all five achieved SD ≥ 6 months/PR. Patients with ≥ 1 alteration with ≥ 5% variant allele fraction (versus < 5%) had a significantly shorter median survival (P = 0.012).
Conclusions
ctDNA analysis detected alterations in the majority of patients, with potentially targetable aberrations found at expected frequencies. Therapy matched to ctDNA alterations demonstrated appreciable therapeutic efficacy, suggesting clinical utility that warrants future prospective studies.
Keywords: non-small cell lung cancer, circulating tumor DNA, liquid biopsy, molecular targeted therapy, clinical utility
INTRODUCTION
Lung cancer is by far the leading cause of death in the United States (1). Non-small cell lung cancer (NSCLC), adenocarcinoma subtype, is the most common histologic variant. Despite advances in early detection and standard of care, NSCLCs are often identified at advanced stages and have a poor prognosis. Adenocarcinoma is the most frequent histology in lifetime never-smokers, women, and younger adults (< 60 years) (2).
The classification and treatment paradigm for NSCLC changed drastically in 2004 with the discovery of the epidermal growth factor receptor (EGFR) mutations as a driver in NSCLC, occurring in about 10–30% of patients (3,4). The presence of EGFR-activating mutations impacts not only the response rate, but also progression-free survival (PFS) in patients with NSCLC treated with EGFR tyrosine kinase inhibitors (TKIs) (5–7). Anaplastic lymphoma kinase (ALK) fusions were later found to also play a driver role in NSCLC, though these anomalies are less frequent (about 4–5% of NSCLC). Patients bearing ALK abnormalities respond well to small molecule ALK inhibitors such as crizotinib (8). In addition to EGFR and ALK, The National Comprehensive Cancer Network (NCCN) NSCLC guidelines recommend testing for 5 additional markers with associated targeted therapies. As the list of targetable alterations grows, tissue biopsy specimens are often inadequate for comprehensive evaluation and a subset are insufficient for any genomic profiling (9). For patients successfully genotyped and treated with targeted therapy, acquired resistance (e.g., EGFR T790M or ALK L1196M resistance mutation) (10–12) ultimately limits the long-term utility of targeted therapies despite impressive initial response rates. Second line therapies targeting the resistance mutations (e.g., osimertinib or alectinib) are becoming available but require contemporary tumor profiling to identify the acquired mutations.
Genomic profiling of circulating tumor DNA (ctDNA) provides an attractive alternative to repeat biopsy in patients whose tissue is insufficient in the first line and at progression. These non-invasive liquid biopsies are increasingly entering the clinical setting for patients with NSCLC. Indeed, because ctDNA tests require only a small amount of blood, they are far easier to obtain and less expensive than repeat tissue biopsies. Liquid biopsies can potentially be used not only to detect actionable anomalies, but also to identify acquired resistance mutations (12,13). In addition, because ctDNA can originate from the primary site and/or metastases, and it is known that there is intra-patient heterogeneity in the molecular makeup of different metastases (14,15), assessment of ctDNA may conceivably deliver a more comprehensive picture of the entire malignant molecular portfolio.
We previously reported that almost half of patients with diverse solid tumors (excluding brain tumors) have a theoretically actionable alteration based on genomic anomalies identified in plasma-derived ctDNA (16). In this study, we analyzed the ctDNA test results and relevant clinical outcomes of 88 patients with lung adenocarcinoma.
MATERIALS AND METHODS
Patients
We retrospectively reviewed the clinicopathologic and outcome data of 88 consecutively tested patients with lung adenocarcinoma followed at UC San Diego Moores Cancer Center, for whom molecular testing (ctDNA test) had been performed on their plasma (August 2014 until October 2015). Data was abstracted from the electronic medical record and performed in accordance with the Declaration of Helsinki. For all patients, this study (PREDICT-UCSD (Profile Related Evidence Determining Individualized Cancer Therapy; NCT02478931) was performed and consents obtained whenever necessary after approval by UCSD Institutional Review Board guidelines.
Sequencing
Digital Sequencing of ctDNA (DNA) in all patients was performed by Guardant Health, Inc. (Guardant360, Redwood City, California, http://www.guardanthealth.com/guardant360/), a Clinical Laboratory Improvement Amendment (CLIA)-certified and College of American Pathologists (CAP)-accredited clinical laboratory. The analytical and clinical validation of Guardant360 was conducted in conformance with evidentiary standards established by the Standards for Reporting of Diagnostic Accuracy (STARD), REporting of tumor MARKer Studies (REMARK), Evaluation of Genomic Applications in Practice and Prevention (EGAPP), and the recent Next-generation Sequencing: Standardization of Clinical Testing (Nex-StoCT) biomarker guidelines (17).
As described in Lanman et al (17), 5ng–30ng of ctDNA was isolated from plasma (two 10ml Streck tubes drawn for each patient) and sequencing libraries were prepared with custom in-line barcode molecular tagging, and complete sequencing at 15,000x read depth (~4,000 unique double-stranded cfDNA fragments, each represented by 3–5 sequencing reads). The current panel utilizes hybrid capture followed by NGS of the critical exons in a panel of 70 genes and reports all four major types of genomic alterations (point mutations, indels, fusions and copy number amplifications). Post-sequencing bioinformatics matches the complementary strands of each barcoded DNA fragment to remove false positive results (17). The variant allele fraction (VAF) is computed as the number of mutated DNA molecules divided by the total number (mutated plus wild type) of DNA fragments at that allele; VAF is reported as a percentage. The majority of cell-free DNA is wild-type (germline); thus the median VAF of somatic alterations is <0.5%.
For 40 patients, a 54-gene panel was used, which identified potential tumor-related alterations in 54 cancer-related genes (Supplemental Table 1) including copy number amplifications in ERBB2, EGFR, and MET; (indels and fusions were not detected as part of this panel). For 47 patients, a 68-gene version of the original panel (expanded to all four major alteration types) was used, and for one patient, the most recent 70 gene panel version (further expanded to amplifications in 18 genes and fusions in 6 genes) was applied (Supplemental Tables 2 and 3). Only non-synonymous alterations were included in our analysis (variants of unknown significance (VUSs) did not include synonymous alterations) (Supplemental Table 4).
In addition, N=34/88 patients (42%) who had ctDNA results also had CLIA/CAP-accredited next generation sequencing (NGS) performed on tumor tissue (FoundationOne™, Cambridge, Massachusetts, http://www.foundationone.com.) An additional 29 patients had various other types of tissue molecular testing.
Concordance Rate
For the N=34 patients who had both types of tests (tissue NGS and plasma ctDNA testing that covered the same genes and alteration types revealed in the tissue NGS), we assessed the concordance for EGFR alterations and corresponding kappa statistics (Supplemental Table 5), which are a conservative measurement of relative agreement that takes into account agreement by chance. Kappa values range from κ = 1 (perfect agreement) to κ = 0 (no agreement other than would be expected by chance) (18). We also performed this analysis excluding the patients that had “no alterations detected” as the lack of alterations could be because no ctDNA was detected in the plasma (N=26 patients included). In these 26 patients, we also conducted a concordance analysis including all alterations that were potentially detectable by both tests (i.e. included in both gene panels).
Matched Therapy and Actionability
Treatment was considered “matched” if at least one agent in the treatment regimen targeted at least one abnormality or pathway component aberrant in a patient’s molecular profile either prospectively or retrospectively.
Actionability implies that the protein product of a genomic abnormality can be impacted by a specific targeted drug (19). A potentially actionable alteration was defined as an alteration that was either the direct target (such as an EGFR inhibitor targeting an EGFR mutation), or a pathway component (such as an mTOR inhibitor for a PIK3CA mutation (since mTOR is downstream of PIK3CA)) that could be targeted by at least one FDA-approved or investigational drug in a clinical trial. Actionability was considered at the variant level; variants of unknown significance (functional consequences and clinical significance of these gene variants are not established, as opposed to characterized alterations) were considered non-actionable.
Statistical Analysis
When appropriate, median and 95% confidence intervals (95% CI) or range were reported. The following clinical endpoints were considered: (i) rate of [stable disease (SD) ≥ 6 months/partial response (PR/)/complete response (CR)]; (ii) progression-free survival (PFS); and (iii) overall survival (OS). SD, PR, or CR was determined per assessment of the treating physician. PFS and OS were defined as the time from the beginning of therapy to progression (for PFS)/death event (for OS) or the time to last follow up. For the analysis examining the correlation between the percentage of ctDNA and survival, we defined OS as the time from the ctDNA test results to death or last follow-up date for patients who were alive (the latter were censored on that date). The cut-off date of the analysis was December 28, 2015; all patients who were progression-free (for PFS) or alive (for OS) as of the date of analysis were censored on that date unless their date of last follow up was earlier, in which case that was the date of censoring.
Whenever appropriate, Chi-Square tests were used to compare categorical variables and the non-parametric Mann Whitney-U test to compare two groups on one continuous variable. Binary logistic regressions were performed for categorical endpoints and multiple linear regressions for continuous variables. PFS and OS were analyzed by the Kaplan-Meier method (20) and the log-rank test was used to compare variables. Statistical analysis was performed by MS with IBM Statistics SPSS version 22.0.
RESULTS
Patient characteristics
Our population was comprised of 88 patients with NSCLC (adenocarcinoma) who had an NGS ctDNA test performed on their plasma. Patient’s median age at diagnosis was 66.2 years old (range, 36.3–89.5 years). There was a predominance of women over men (n=58 (66%): n=30 (34%)). The majority of patients were smokers (N=50, 56.8%); 36 patients were never smokers (40.9%), and for two patients the smoking status was unknown (Table 1). Twelve patients had intrathoracic disease while the others had metastatic disease.
Table 1.
Population characteristics (N=88)
| Parameters | N (%) |
|---|---|
| Gender (N, %) | |
| Women | 58 (66%) |
| Men | 30 (34%) |
|
| |
| Ethnicity (N, %) | |
| Caucasian | 58 (65.9%) |
| Asian | 18 (20.5%) |
| Othera | 12 (13.6%) |
|
| |
| Age at diagnosis (median, range) | 66.2 years (36.3–89.5) |
|
| |
| Median number of therapie(s) in metastatic setting at time of ctDNA test | 1 (range 0–13) |
|
| |
| Median time from diagnosis to ctDNA results (median, 95%CI) | 11.7 months (6.2–15.8) |
|
| |
| Time from blood draw to ctDNA results (median, 95%CI) | 15 days (14–15) |
|
| |
| Smoking status | |
| Never smoker* | 36 (40.9%) |
| Smokers | 50 (56.8%) |
| Unknown | 2 (2.3%) |
|
| |
| Number of patients with ≥ 1 alteration | 72 (82%) |
Included Hispanic, N=2; African American, N=1, Middle Eastern, N=1, and unknown, N=8
Patients whose medical chart indicated that they smoked <100 cigarettes in their lifetime were considered never-smokers for the purpose of this study
Circulating tumor DNA (ctDNA) sequencing results
The median time from diagnosis to the ctDNA test results was 11.7 months (95%CI 6.2–15.8 months; range 0–123 months), and the median time from the blood draw to results (turn-around time) was 15 days (95%CI 14–15 days; range 8–35 days). In our 88 tested patients, a total of 257 alterations were identified, with the majority being point mutations (n=205, 79.8%), followed by amplifications (10.5% of alterations (27/257)). The most frequent alterations (all non-synonymous alterations considered) discerned were in the following genes: TP53 (44.3% of patients), followed by EGFR (27.3%), MET (14.8%), KRAS (13.6%), and ALK (6.8%) (Figure 1A and B). The majority of patients had mutations; 17 demonstrated amplification; and three showed rearrangements.
Figure 1. Frequent alterations and potential actionability.
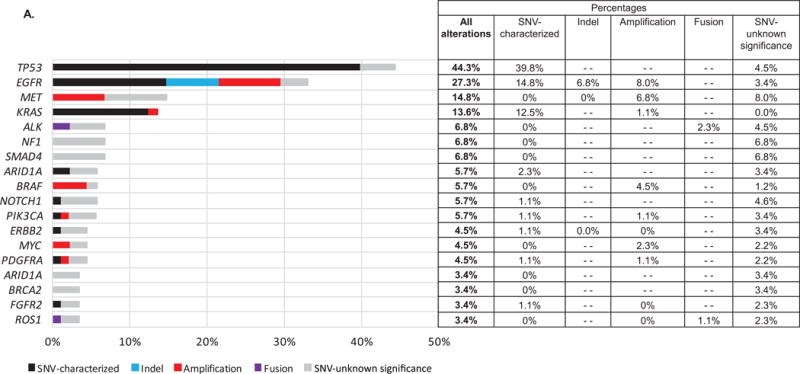
A. Most frequent alterations given as a percentage of all (N = 88) patients
Some patients had multiple alterations in the same gene. Only genes with alterations in ≥ 3 patients are displayed; all alterations were non-synonymous. Alterations were also identified in the following genes (albeit in one or two patients): APC, BRCA1, CDKN2A, CTNNB1, FGFR1, KIT, MAP2K1, RAF1, RHOA, ATM, CCND1, CCNE1, CDK6, ERBB4, IDH2, JAK2, MAP2K2, MLH1, NFE2L2, NRAS, PTEN, RB1, RET, RIT1, SRC, and VHL. *Alterations of unknown significance (variant of unknown significance; VUSs) versus characterized mutations (indels, amplifications, fusions, and single nucleotide variant (SNV) point mutations) were considered at the variant level. (“–” indicates variant type not assessed for that gene.)
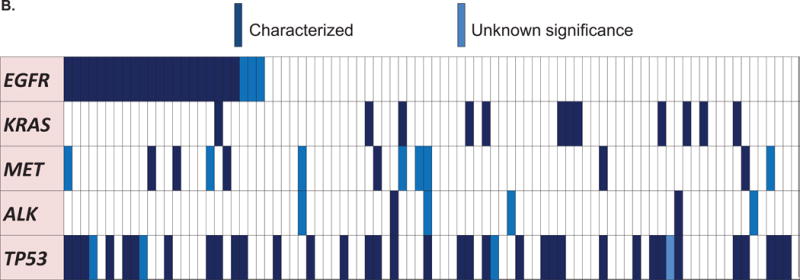
B. Oncoprint of the most frequent alterations (N = 88 patients)
Only the most frequent alterations were represented (at least 10 patients with the alteration).
We also included ALK for its driver role in adenocarcinoma, even though there were less than 10 patients.
Dark blue are characterized alterations and light blue represent variants of unknown significance.
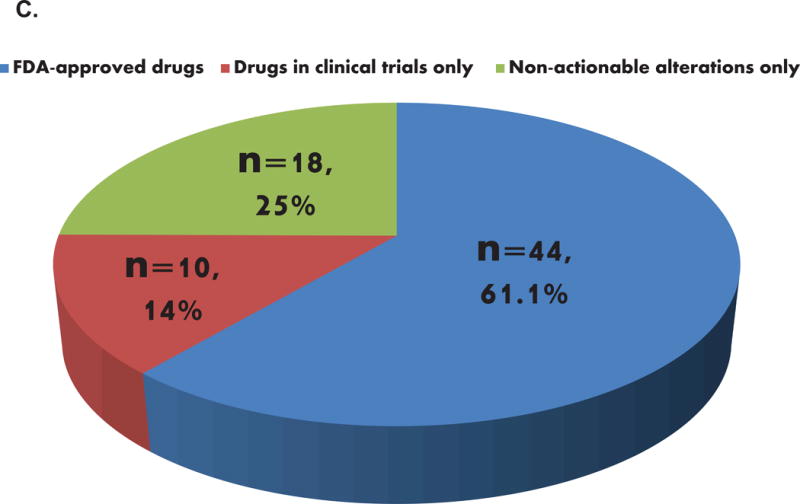
C. Potential actionability of the detected alterations
Pie chart representing the frequency of patients with actionable alterations in patients with alterations identified (N=72). Fifty-four patients (75% of patients with alterations) had potentially actionable alterations (61.4% of all 88 patients). The eighteen patients with non-actionable alterations carried only variant(s) of unknown significance (VUSs) and were therefore considered non-actionable by definition.
Of the total, 72 patients (82%) had at least one detectable ctDNA alteration. Amongst these 72 patients, 75% (N = 54 patients; 61.4% of the total 88 patients) had ≥ 1 anomaly that was potentially actionable (by FDA-approved drug(s) (61.1%) or by an experimental drug(s) in a clinical trial (if an FDA-approved drug was not available) (an additional 13.9%)) (Figure 1C). When we examined the differences between the most frequent alterations detected in smokers versus non-smokers, we observed that KRAS aberrations were only detected in smokers in our population (24% (12/50) versus 0% (0/36) in non-smokers, P=0.001); TP53 alterations were also more frequent in smokers, with a statistically significant difference when focusing on characterized alterations only (50% versus 25% in non-smokers, P=0.026), Figure 2. In addition, characterized EGFR alterations were the most frequent alterations found in non-smokers (36% (13/36) versus 16% (8/50) in smokers, P=0.043), Figure 2).
Figure 2. Comparison of alteration frequencies detected in never smokers versus former or current smokers.
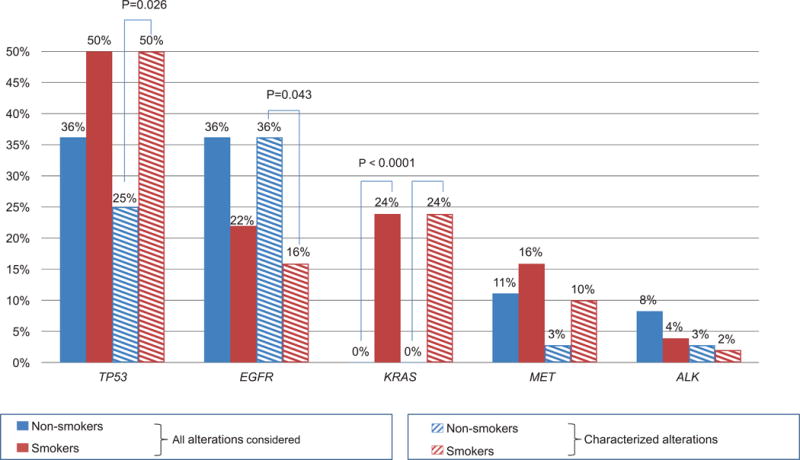
Only statistically significant P-values are indicated. Characterized alterations were defined at the gene variant level (uncharacterized alterations implied variants of unknown significance, or VUSs). Patients whose medical chart indicated that they smoked < 100 cigarettes lifetime were considered non-smokers for the purpose of this study.
In the 88 patients, the median number of alterations was two (average 2.7, range 0–21). Specifically, 19.3% of patients had one alteration, and 62.5% had at least two alterations. In a univariable analysis, smokers had a higher median number of alterations (2 versus 1.5, P=0.030), and it remained a trend in the multivariable analysis (P=0.083). The presence of TP53 and MET alterations was an independent predictor of a higher number of alterations in the multivariable analysis, with P = 0.002 and P = 0.021, respectively (Table 2).
Table 2.
Correlations between patient and genomic characteristics with the number of alterations.
| Univariable | Multivariable | ||||
|---|---|---|---|---|---|
|
| |||||
| Variables | No. alterations median, (95% CI) | P-value | B coef. | t-statisticb | P-value |
|
| |||||
| Smoking status* | 0.030 | 0.865 | 1.754 | 0.083 | |
| YES (N=50) | 2 (2–3) | ||||
| NO (N=36) | 1.5 (1–3) | ||||
|
| |||||
| Gender | 0.643 | — | — | — | |
| Women (N=58) | 2 (1–3) | ||||
| Men (N=30) | 2 (1–3) | ||||
|
| |||||
| Age at diagnosisa | 0.232 | — | — | — | |
| ≤ 66 years old (N=41) | 2 (1–3) | ||||
| > 66 years old (N=47) | 2 (1–3) | ||||
|
| |||||
| TP53 alteration(s) detected | 0.001 | 1.599 | 3.268 | 0.002 | |
| YES (N=39) | 3 (2–4) | ||||
| NO (N=49) | 1 (1–2) | ||||
|
| |||||
| EGFR alteration(s) detected | 0.113 | — | — | — | |
| YES (N=24) | 3 (2–4) | ||||
| NO (N=64) | 2 (1–2) | ||||
|
| |||||
| MET alteration(s) detected | 0.001 | 1.633 | 2.346 | 0.021 | |
| YES (N=13) | 3 (3–6) | ||||
| NO (N=75) | 2 (1–2) | ||||
|
| |||||
| Brain metastasis | 0.195 | — | — | — | |
| YES (N=34) | 2.5 (2–3) | ||||
| NO (N=54) | 2 (1–2) | ||||
|
| |||||
| Bone metastasis | 0.843 | — | — | — | |
| YES (N=42) | 2 (2–3) | ||||
| NO (N=46) | 1.5 (1–2) | ||||
|
| |||||
| Liver metastasis | 0.831 | — | — | — | |
| YES (N=19) | 2 (1–4) | ||||
| NO (N=69) | 2 (1.5–3) | ||||
|
| |||||
| Lymph node metastasis | 0.107 | — | — | — | |
| YES (N=45) | 2(2–3) | ||||
| NO (N=43) | 2 (1–2) | ||||
Only variables with N > 10 patients with the alteration were included. Variables with P-values ≤ 0.05 in the univariable analysis were included in the multivariable model. P-values were calculated using linear regression models (univariable and multivariable analyses).
Cut-off of 66 years old corresponds to the median (Table 1).
The t-statistic is the ratio of the B coefficient and the Standard Error; the higher the value, the greater is the importance of the variable in the model. 95% CI, 95% Confidence Interval.
No smoking history available for two patients
There was no difference in the rate of ctDNA detection between those patients with and without metastases. Two of the 12 (16.%) patients with intrathoracic disease alone (no metastases) had no alterations; 14 of the 76 patients (18%) with metastatic disease had no alterations. There was also no difference in alteration detection rate between those with ≤1 prior therapies versus those with >1 prior therapies, with no alterations detected in about 18% of each group. ctDNA levels were also not significantly different.
Concordance analysis
EGFR alterations
Thirty-four patients (38.6%) also had a multi-gene panel NGS tissue testing (see Methods) (21). The median time interval between the blood draw and tissue biopsy was 0.8 months (and hence this was used as a cut point for discerning differences between tissue and blood based results). The overall concordance rate for EGFR alterations was 76.5%. (Concordance rate remained similar (75%) when EGFR tissue testing of non-NGS types were included in the calculations). The concordance rate was 88.2% compared to 64.7% when the time interval was ≤ 0.8 versus > 0.8 months between the blood draw and the tissue biopsy for NGS (p = 0.22) (Supplemental Table 5 and Figure 3).
Figure 3. Concordance analysis.
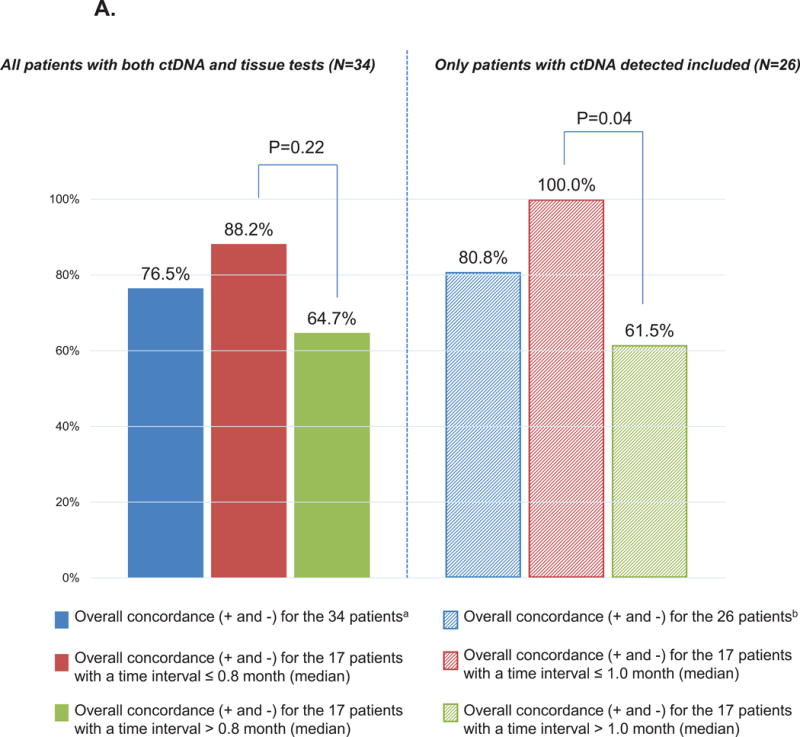
A. EGFR concordance between the ctDNA and tissue tests
We included patients with EGFR alterations (all EGFR alterations considered) that were tested for in both the ctDNA and tissue gene panels. Overall concordance included positive (+) and negative (-) concordant cases, i.e. when both the tissue and the ctDNA were positive or negative.
aThirty-four patients had both ctDNA and a common tissue molecular test. For these N=34 patients, the median time interval between tissue biopsy to blood draw was 0.8 months.
bTwenty-six patients had both ctDNA and a common tissue molecular test, and had alterations in their ctDNA. For these N=26 patients, the median time interval between tissue biopsy to blood draw was 1.0 months (we performed this analysis excluding patients that had “no alterations detected” as it could be because no ctDNA was detected in the plasma).
P-values compares the % of overall concordance between patients with biopsy interval time ≤ or > median (2-sided Chi-Square test). Alterations were examined at the gene level (i.e., no distinction in the location of alteration within gene).
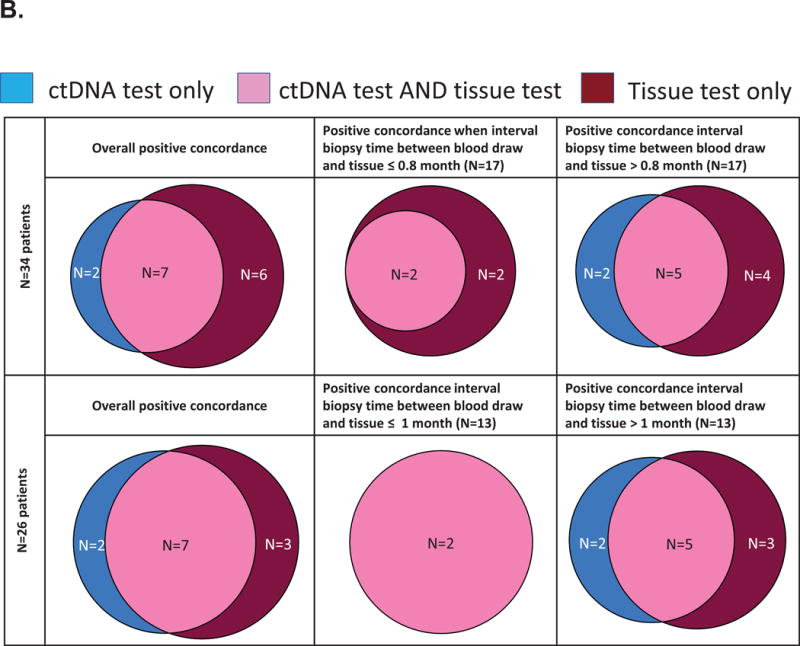
B. Venn diagrams representing the positive concordance of EGFR alterations detected in the ctDNA and tissue tests
The upper part of the chart displays the results in the 34 patients who had a ctDNA test and tissue molecular testing. For these 34 patients, the median biopsy interval time (between blood draw and tissue biopsy) was 0.8 month. The bottom part of the chart displays the results in the 26 patients who had alterations detected in their ctDNA test and had tissue molecular testing. For these 26 patients, the median biopsy interval time (between blood draw and tissue biopsy) was 1.0 months. All EGFR alterations were considered.
We also performed this analysis excluding the patients that had “no ctDNA alterations detected”, as the absence of alterations could be because no tDNA was detected in the plasma. In those 26 patients, the median time interval between the blood draw and tissue biopsy was 1.0 months, and the overall concordance rate was 80.8% for EGFR alterations. The concordance rate was 100% in patients for whom the time interval between the blood draw and the tissue biopsy was ≤ 1.0 months (corresponding to the median) compared to 61.5% when this time interval was > 1.0 month (P = 0.04) (Supplemental Table 5; Figure 3A). Of the total, there were 7/26 patients with positive concordance, 14/26 patients with negative concordance and 5/26 patients with discordance (two patients were positive for EGFR alterations in ctDNA only and three were positive for EGFR alterations in tissue only).
Overall concordance
We also performed an analysis including all the alterations in these 26 patients (we included alterations in common in the gene panel of both the ctDNA and tissue testing, N=62 alterations). Thirty-three alterations were found in both tests, for a positive concordance rate of 53.2%. In total, N=52 alterations were found in the tissue and N= 43 in the plasma, leading to a sensitivity of 63.5% (33/52) when the tissue is used as a comparator and 76.7% (33/43) when the plasma is used as the comparator. N=19 alterations were found in the tissue only and N=10 in the plasma only. In 70% of patients (18/26), we found at least one alteration in common in their ctDNA and tissue testing. Of interest, when we classified the alterations in the plasma into a %ctDNA ≥ 1% or < 1%, we found that 100% of the 21 alterations with a %ctDNA ≥ 1% were also identified in the tissue compared to 71.4% (10/14) for the N=14 alterations with a %ctDNA < 1%, P=0.0191 (Fisher’s exact test; N=8 alterations were amplifications and were not included in this analysis). We also found in sub-analyses that the concordance rates were higher for the alterations tested in pre-treated patients (64.7% vs 48.9% in post-treatment setting) and when the time difference between the plasma and tissue biopsy was shorter (62.5% vs 43.3%; median of 1.3 months was used as cut-off), although these differences were not statistically significant.
Analysis of patient outcome
Patients had a median of one prior line of therapy (range, 0–13) before ctDNA testing. Of the 88 patients, 25 (28.4%) had an alteration in their ctDNA results that was targeted by a matched therapy, with 20/25 patients (80%) receiving a therapy directed to EGFR (n=18; activating EGFR mutations (mostly exon 19, but also L858R in exon 21 or G719X in exon 18 for 1st/2nd generation inhibitors; EGFR T790M for 3rd generation inhibitors)) or ALK alterations (n=2) (the other targeted alterations included KIT, PDGFRA, or BRAF). Sixty-three patients (71.6%) did not receive a treatment that matched their ctDNA results (including 36 patients who were not evaluable for treatment) mainly because they died, were lost to follow up before ctDNA results, or were not treated yet (Supplemental Figure 1).
Of the 25 matched patients, all received FDA-approved drugs (15 (60%) on-label, 5 (20%) off-label) except for the patients (N = 5) matched to EGFR T790M. These patients received osimertinib, which was being used in a clinical trial at the time, but has since been FDA approved. Twenty-two patients were evaluable for response (three patients were too early to assess); 16 (72.3%) achieved stable disease (SD) ≥ 6 months (N = 5) or partial response (PR) (N = 11). In comparison, 12 of 20 (60%) of the never matched evaluable patients (N = 27 patients never matched; 7 too early to assess) achieved SD ≥ 6 months/PR (P = 0.515 for matched versus never matched).
The median PFS for the 25 matched patients was 14.7 months (95%CI 3.7–25.7) (15.3 months for non-smokers versus 8.1 months for smokers (P=0.202; not significant)); and was longer in patients carrying EGFR alterations versus not (medians: 17.6 versus 5.1 months, P=0.009). Comparing matched and never matched patients [the treatment with the longest PFS for both matched and never-matched was chosen (prospectively or retrospectively)], the median line of therapy in the recurrent or metastatic setting was 2 (range, 1 to 10) for the longest PFS in matched patients versus 1 (range, 1 to 3) for the longest PFS in never matched patients (P = 0.015). (For the matched patients, the longest PFS refers to longest PFS on matched therapy (in case the patient received more than one regimen of matched therapy); for the never matched patients, we chose the longest PFS on any therapy that the patient may have received (including chemotherapy)). The median longest PFS was 14.7 months for the matched patients (n=25) versus 7.8 months for the never-matched patients (n=27), with P = 0.280. The median OS was not reached for the matched patients (n=25) (median follow-up time of 18.6 months) versus 36.7 months for the never-matched patients (n=27) (P = 0.928) (PFS and OS survival were calculated from the initiation date of treatment with the longest PFS for both the matched and the never-matched groups).
EGFR T790M and third-generation EGFR inhibitors
There were five patients who were given a third-generation EGFR inhibitor after their ctDNA results showing the EGFR T790M resistance mutation, and all five achieved SD ≥ 6 months (N = 3)/PR (N = 2). The PFS for these five patients were 3.2+, 7.2, 8.1+, 14+, and 15+ months. All five also had a tissue biopsy showing EGFR T790M at some point in their course.
Levels of ctDNA and survival
Amongst the 88 patients, the median overall survival (calculated from the ctDNA results until death or last follow up date) was not reached at a median follow up of 20.2 months. However, when we stratified patients who had at least one alteration with a percentage of ctDNA detected of ≥ 5% (representing 10 times the median percentage of ctDNA), we found that patients with a percentage of ctDNA ≥ 5% had a shorter overall survival (median 4.2 months versus not reached at a median follow up of 21.6 months for those patients with ctDNA < 5%, P=0.012) (Figure 4).
Figure 4. Overall survival (OS) analysis.
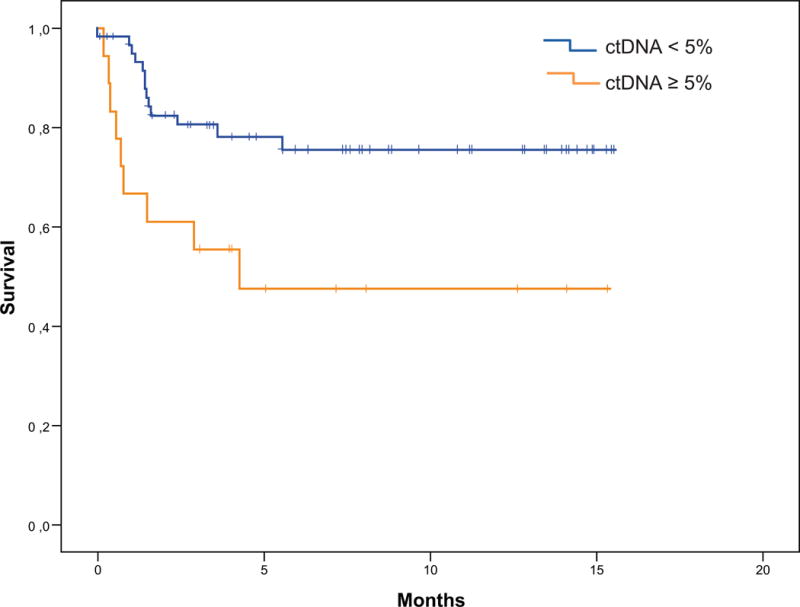
Kaplan-Meier curves comparing the OS (from ctDNA test results until death or last follow up date) for patients with a percentage of ctDNA < 5% (n=62; median not reached) versus ≥ 5% (n=18; median 4.2 months), P=0.012. Eight patients died before their ctDNA results were available and were not included in this analysis.
DISCUSSION
In this study investigating the use of liquid biopsies in 88 patients with lung adenocarcinoma, we show that the most frequent alterations detected were in TP53 (44.3% of patients), EGFR (27.3%), MET (14.8%), KRAS (13.6%), and ALK (6.8%) genes. In comparison, The Cancer Genome Atlas (TCGA) showed similar rates of tissue alterations of 46% (TP53), 17% (EGFR), 12% (MET), 36% (KRAS), and 8% (ALK) (22). For the EGFR and KRAS genes, the rates differed between the ctDNA and TCGA tissue. The reasons for the variance could be related to the fact that TCGA was performed on untreated patients, while our population was previously treated (22,23). Further, resistance mutations such as EGFR (T790M) or KRAS emerge after matched therapy and would be less likely to be present in the TCGA cohort. Other reasons for these differences could include, but not be limited to, factors related to tumor heterogeneity and the propensity of tumor DNA to shed into the blood, as well as the fact that the local area has a relatively high Asian population and low smoking rates. We also observed that KRAS alterations were only found in smokers (24% vs 0%, P=0.001) and that characterized EGFR alterations were more common in non-smokers (36% vs 16%, P=0.04), consistent with what was previously described in analyses performed on tissue (24,25).
Overall, 82% of patients had at least one detectable alteration(s), and for 75% of them (61.4% of the total 88 patients), the alterations were potentially actionable by an FDA-approved drug or an experimental agent in a clinical trial. This actionability rate is within the same range of the results of our prior study that detected alterations in the plasma of patients with diverse cancer types (17).
We also examined the concordance rate of EGFR alterations for patients who had both ctDNA and multi-gene panel NGS tissue testing (21). The concordance rates were in the same range (61.5%–100%) (Supplemental Table 5) of those previously reported (about 67 to 99%) (22–24). Further, we observed that the concordance rate was increased when the time interval between the blood draw and the tissue biopsy was shorter, which can be explained by the dynamic changes occurring in the tumor, especially when the patient is receiving treatment (26–30). Of interest, a focused analysis on the positive cases (Figure 3B) revealed that both tests could independently detect alterations not found in the other test, highlighting the clinical value and complementary nature of both techniques.
The overall analysis of the concordance including all alterations potentially detectable by both tests also showed that some alterations were found in tissue or ctDNA only and resulted in a specificity of 63.5% when the tissue was used as a reference and 76.7% when the plasma was used as a reference. In order to observe more accurate concordance rates, the comparison of tissue and plasma results should include samples temporally concurrent and pre-treatment so that ctDNA is not suppressed to undetectable levels, and only the genetic footprint in common between the two tests can be compared. Several publications meet these study design criteria (two pan-cancer, one each in NSCLC, breast, colorectal, anaplastic thyroid and pancreatic cancer) and all show high diagnostic concordance for concurrent samples (99%, 86%, 100%, 100%, 100%, 72% and 98%, respectively) (17,27,29,31–34). Reasons that results might be positive in tissue but not in ctDNA include the following: suppression of ctDNA shedding by treatment; and the fact that not all tumors shed DNA into the bloodstream even pre-treatment or at progression. On the other hand, ctDNA may be positive when tissue is not because ctDNA reflects shed DNA from multiple metastases whereas a biopsy typically samples a single lesion. Furthermore, gene mutations acquired under treatment pressure may not be found in archival tissue (temporal separation). There may also be technical differences between the tests. Considering the distinct advantages and disadvantages of each technique may therefore be pertinent in the clinical setting. Tissue biopsies are critical in the first line to define histopathological cancer diagnosis and genotyping both, and at progression, especially when ctDNA is negative. Conversely, ctDNA may be useful at progression to reduce the need for repeat biopsies.
Some genomic alterations found in ctDNA may not be found in sequenced tissue samples because of tumor heterogeneity or because the plasma sequencing method is more sensitive and will pick up mutations at lower allele fractions than with tissue NGS. In Goyal et al.(35) five FGFR2 resistance mutations were found in a cholangiocarcinoma patient on targeted FGFR2 therapy, but only one was detected on liver biopsy. At warm autopsy three of the five ctDNA-detected FGFR2 mutations were confirmed in tissue and all five were found to drive resistance on functional modeling (35). In Rozenblum et al.(36) ctDNA NGS changed treatment in 32% of patients negative for NSCLC genomic targets via local tissue-based EGFR qPCR and ALK FISH testing, including two EGFR driver mutations not detected in tissue (36). Of interest in this regard, it has previously been shown that matched therapy based on ctDNA findings of EGFR L858R, exon 19 deletion and T790M produced responses similar to those based on tissue biopsy-based assays, even in cases when ctDNA was positive and tissue was wild-type for the EGFR mutation (37–39). In our study, we found that all ctDNA-detected EGFR T790M alterations were confirmed (100%) in corresponding tissue.
One goal of our study was to investigate the outcome of patients with lung adenocarcinoma who were treated (either prospectively or retrospectively) with a therapy matching alteration(s) detected in their ctDNA test. At the time of our analysis, twenty-five patients (28.4%) received a matched therapy consistent with their ctDNA results. When considering only patients carrying EGFR characterized mutations (N=19/88), 95% (18/19) received matched therapy. Seventy-three percent (16/22 patients evaluable for response) of matched patients achieved SD ≥ 6 months/PR. Response correlated with PFS, as the 16 patients with SD ≥ 6 months/PR had a significantly prolonged median PFS as compared to non-responders (17.6 months versus only 1.8 months, P<0.0001). Other studies have described the benefit of matching patients using a biomarker. Indeed, three recent meta-analyses looking at trials leading to FDA approval (40), Phase II studies (41) and Phase I studies (42) concluded that the strategy of selecting patients with a biomarker led to improved response rates, longer PFS and OS. In addition, our previous retrospective analysis performed on more than 300 patients with various malignancies and using NGS tissue testing revealed that the strategy of matching patients led to increased rates of SD ≥ 6 months/PR/CR and longer PFS (43).
In our population, we found that 37.5% of patients with EGFR alterations (9/24) carried the EGFR T790M resistance mutation, consistent with previous reports (34,35,42). Not surprisingly, these nine patients had previously been treated with EGFR tyrosine kinase inhibitors. The initial detection of EGFR alterations in patients with lung adenocarcinoma as well as the monitoring during treatment for the appearance of resistance mutations may be an important application of liquid biopsies. This is particularly true because obtaining serial tissue samples post EGFR tyrosine-kinase inhibitors is challenging in clinical practice due to the invasiveness of the procedure and the frailty of patients with metastatic disease. In addition, tissue biopsies may not reflect tumor heterogeneity if multiple metastatic sites are involved. Indeed, in our study, 25 of 88 patients (28.4%) only had ctDNA results available (no other molecular tissue testing), with the most common reasons being inadequate tissue and/or the potential risk for repeat biopsy.
Several studies have monitored EGFR alterations in the plasma of patients with NSCLC during their disease course (12,44–48). For instance, Zheng et al. (44) examined 318 patients with advanced or recurrent NSCLC who were receiving a tyrosine kinase inhibitor, and focused on the 117 patients who acquired resistance. EGFR T790M ctDNA was detected in the plasma of 55/117 patients (47%). In addition, they showed that almost half of the T790M ctDNA-positive patients were identified at a median time of 2.2 months prior to clinically progressive disease (PD). Similarly, Sueoka-Aragane et al. (45) looked at sequential examinations in 89 patients with NSCLC. They detected EGFR T790M in 40% of patients who developed progressive disease after treatment with a kinase inhibitor. These studies highlight the feasibility of monitoring EGFR mutation dynamics in serial plasma samples from NSCLC patients receiving TKI therapy.
Matched versus never-matched patients had higher rates of SD ≥ 6 months/PR (72.3% vs 60%; N = 22 vs. 20 evaluable) and longer median PFS (14.7 vs 7.8 months; N = 25 vs. 27 evaluable), although the differences were not statistically significant, perhaps due to the limited number of patients. Interestingly, there were five patients whose ctDNA demonstrated the EGFR T790M resistance mutation who were then given a third-generation EGFR inhibitor, and all five achieved SD ≥ 6 months (N = 3)/PR (N = 2).
Lastly, our study demonstrated that patients with at least one alteration with a percentage of ctDNA ≥ 5% had a shorter overall survival (median 4.2 months versus not reached at a median follow up of 7.5 months, P=0.012) (Figure 4), consistent with a prior study performed on diverse cancer types (48) and various other studies describing the prognostic value of ctDNA including in patients with lung cancer (33,46–49).
Our study had several limitations. First, because of its retrospective and single center nature and small number of patients, there could be unknown biases that influenced our analysis. In addition, some of our patients did not have concurrent tissue and ctDNA biopsies, and the ctDNA test and tissue NGS are two different techniques each having its own advantages and disadvantages. On the other hand, the range of intervals between tissue and ctDNA tests allowed us to investigate the influence of time interval between the tissue biopsy and ctDNA test and to observe that a shorter time interval between these tests resulted in increased concordance rates. In future studies it will be important to examine larger, well-timed cohorts for concordance in a wide range of genes. Another limitation was that a subset of patients (N = 16) did not have detectable ctDNA. It is plausible that some tumors do not shed ctDNA. However, it is also conceivable that improvements in technology will eventually prove able to detect ctDNA in such patients. Alternative techniques such as those that evaluate circulating tumor cells could also be assessed. Finally, response assessment in our study was performed by individual physicians rather than by centralized standardized review. Overall, larger prospective studies are needed to further define the value of ctDNA tests to inform treatment and their use as a tissue surrogate.
In summary, our study reveals the frequent detection of altered ctDNA in patients with NSCLC adenocarcinoma, including in difficult-to-biopsy patients. The concordance rate for EGFR alterations was 80.8% (100% versus 61.5% (≤ 1 versus > 1 month between tests; P = 0.04)). This confirms and strengthens the findings of Thompson et al (29) who showed EGFR concordance rates of 79%, with a shorter time interval between tissue and blood collection associated with increased concordance (P = 0.038). Patients who received cognate therapies demonstrated a high rate of SD ≥ 6 months/PR. Indeed, all five patients with EGFR T790M resistance mutation detected in ctDNA and then treated with a third generation EGFR inhibitor achieved SD ≥ 6 months/PR. Importantly, high levels of ctDNA (≥ 5%) predicted for poor survival, suggesting clinical utility for ctDNA tests. It appears that several groups of patients could benefit from ctDNA evaluation, including those with hard-to-biopsy lesions, those whose biopsy tissue is exhausted for histopathology or immunohistochemistry testing, or those patients who had non-NGS tissue testing and no actionable alterations were detected (49). In addition there are patients in whom serial monitoring for emergence of resistance mutations might be important (e.g., patients with EGFR mutations or ALK fusions who are treated with first-generation EGFR or ALK inhibitors, respectively). However, when ctDNA results in no alterations detected, a tissue biopsy would be recommended as some tumors may not shed sufficient DNA into circulation to be detectable. Further prospective validation of an approach that uses ctDNA to guide management and assesses the cost:benefit ratio of serial testing is warranted.
Supplementary Material
STATEMENT OF TRANSLATIONAL RELEVANCE.
Genomic profiling of circulating tumor DNA (ctDNA) provides an attractive alternative over repeat invasive biopsy in patients whose tissue is insufficient in the first line and at progression. Non-invasive liquid biopsies are increasingly entering the clinical setting for patients with non-small cell lung adenocarcinoma (NSCLC) and while there is a growing body of literature describing targeted ctDNA performance for specific alterations assayed in association with investigational drug clinical trials, there is little data evaluating the performance and clinical outcomes of multi-gene ctDNA assays in clinical use. In this clinical use study, ctDNA analysis detected alterations in the majority of NSCLC patients, with potentially targetable aberrations found at expected frequencies, and therapy matched to ctDNA alterations demonstrated appreciable therapeutic efficacy, suggesting clinical utility. Further prospective validation of an approach that uses ctDNA to guide management is warranted.
Acknowledgments
Funded in part by the Joan and Irwin Jacobs Fund philanthropic fund and by National Cancer Institute grant P30 CA016672 (Razelle Kurzrock, rkurzrock@ucsd.edu).
References
- 1.Siegel RL, Miller KD, Jemal A. Cancer Statistics, 2017. CA Cancer J Clin. 2017 Jan 5; doi: 10.3322/caac.21387. [DOI] [PubMed] [Google Scholar]
- 2.Herbst RS, Heymach JV, Lippman SM. Lung cancer. N Engl J Med. 2008 Sep 25;359(13):1367–80. doi: 10.1056/NEJMra0802714. [DOI] [PMC free article] [PubMed] [Google Scholar]
- 3.Lynch TJ, Bell DW, Sordella R, Gurubhagavatula S, Okimoto RA, Brannigan BW, et al. Activating mutations in the epidermal growth factor receptor underlying responsiveness of non-small-cell lung cancer to gefitinib. N Engl J Med. 2004 May 20;350(21):2129–39. doi: 10.1056/NEJMoa040938. [DOI] [PubMed] [Google Scholar]
- 4.Pao W, Miller VA, Politi KA, Riely GJ, Somwar R, Zakowski MF, et al. Acquired Resistance of Lung Adenocarcinomas to Gefitinib or Erlotinib Is Associated with a Second Mutation in the EGFR Kinase Domain. In: Liu ET, editor. PLoS Med. 3. Vol. 2. 2005. Feb 22, p. e73. [DOI] [PMC free article] [PubMed] [Google Scholar]
- 5.Gazdar AF. Activating and resistance mutations of EGFR in non-small-cell lung cancer: role in clinical response to EGFR tyrosine kinase inhibitors. Oncogene. 2009 Aug;28(Suppl 1):S24–31. doi: 10.1038/onc.2009.198. [DOI] [PMC free article] [PubMed] [Google Scholar]
- 6.Paez JG, Jänne PA, Lee JC, Tracy S, Greulich H, Gabriel S, et al. EGFR mutations in lung cancer: correlation with clinical response to gefitinib therapy. Science. 2004 Jun 4;304(5676):1497–500. doi: 10.1126/science.1099314. [DOI] [PubMed] [Google Scholar]
- 7.Bonomi PD, Buckingham L, Coon J. Selecting patients for treatment with epidermal growth factor tyrosine kinase inhibitors. Clin Cancer Res Off J Am Assoc Cancer Res. 2007 Aug 1;13(15 Pt 2):s4606–4612. doi: 10.1158/1078-0432.CCR-07-0332. [DOI] [PubMed] [Google Scholar]
- 8.Shaw AT, Solomon B, Kenudson MM. Crizotinib and testing for ALK. J Natl Compr Cancer Netw JNCCN. 2011 Dec;9(12):1335–41. doi: 10.6004/jnccn.2011.0115. [DOI] [PubMed] [Google Scholar]
- 9.Hagemann IS, Devarakonda S, Lockwood CM, Spencer DH, Guebert K, Bredemeyer AJ, et al. Clinical next-generation sequencing in patients with non-small cell lung cancer. Cancer. 2015 Feb 15;121(4):631–9. doi: 10.1002/cncr.29089. [DOI] [PubMed] [Google Scholar]
- 10.Rolfo C, Castiglia M, Hong D, Alessandro R, Mertens I, Baggerman G, et al. Liquid biopsies in lung cancer: the new ambrosia of researchers. Biochim Biophys Acta. 2014 Dec;1846(2):539–46. doi: 10.1016/j.bbcan.2014.10.001. [DOI] [PubMed] [Google Scholar]
- 11.Bean J, Brennan C, Shih J-Y, Riely G, Viale A, Wang L, et al. MET amplification occurs with or without T790M mutations in EGFR mutant lung tumors with acquired resistance to gefitinib or erlotinib. Proc Natl Acad Sci U S A. 2007 Dec 26;104(52):20932–7. doi: 10.1073/pnas.0710370104. [DOI] [PMC free article] [PubMed] [Google Scholar]
- 12.Husain H, Kosco K, Rose C, Vibat T, Melnikova V, Erlander MG, et al. Kinetic monitoring of EGFR T790M in urinary circulating tumor DNA to predict radiographic progression and response in patients with metastatic lung adenocarcinoma. J Clin Oncol Off J Am Soc Clin Oncol [Internet] 2015;33(suppl) abstr 8081. Available from: http://meetinglibrary.asco.org/content/151073-156. [Google Scholar]
- 13.Douillard JY, Ostoros G, Cobo M, Ciuleanu T, Cole R, McWalter G, et al. Gefitinib treatment in EGFR mutated caucasian NSCLC: circulating-free tumor DNA as a surrogate for determination of EGFR status. J Thorac Oncol. 2014 Sep;9(9):1345–53. doi: 10.1097/JTO.0000000000000263. [DOI] [PMC free article] [PubMed] [Google Scholar]
- 14.Gerlinger M, Rowan AJ, Horswell S, Larkin J, Endesfelder D, Gronroos E, et al. Intratumor heterogeneity and branched evolution revealed by multiregion sequencing. N Engl J Med. 2012 Mar 8;366(10):883–92. doi: 10.1056/NEJMoa1113205. [DOI] [PMC free article] [PubMed] [Google Scholar]
- 15.De Mattos-Arruda L, Weigelt B, Cortes J, Won HH, Ng CKY, Nuciforo P, et al. Capturing intra-tumor genetic heterogeneity by de novo mutation profiling of circulating cell-free tumor DNA: a proof-of-principle. Ann Oncol. 2014 Sep 1;25(9):1729–35. doi: 10.1093/annonc/mdu239. [DOI] [PMC free article] [PubMed] [Google Scholar]
- 16.Schwaederlé M, Husain H, Fanta PT, Piccioni DE, Kesari S, Schwab RB, et al. Detection rate of actionable mutations in diverse cancers using a biopsy-free (blood) circulating tumor cell DNA assay. Oncotarget. 2016 Mar 1;7(9):9707–17. doi: 10.18632/oncotarget.7110. [DOI] [PMC free article] [PubMed] [Google Scholar]
- 17.Lanman RB, Mortimer SA, Zill OA, Sebisanovic D, Lopez R, Blau S, et al. Analytical and Clinical Validation of a Digital Sequencing Panel for Quantitative, Highly Accurate Evaluation of Cell-Free Circulating Tumor DNA. PloS One. 2015;10(10):e0140712. doi: 10.1371/journal.pone.0140712. [DOI] [PMC free article] [PubMed] [Google Scholar]
- 18.McHugh ML. Interrater reliability: the kappa statistic. Biochem Medica. 2012;22(3):276–82. [PMC free article] [PubMed] [Google Scholar]
- 19.Vidwans SJ, Turski ML, Janku F, Garrido-Laguna I, Munoz J, Schwab R, et al. A framework for genomic biomarker actionability and its use in clinical decision making. Oncoscience. 2014;1(10):614–23. doi: 10.18632/oncoscience.90. [DOI] [PMC free article] [PubMed] [Google Scholar]
- 20.Goel MK, Khanna P, Kishore J. Understanding survival analysis: Kaplan-Meier estimate. Int J Ayurveda Res. 2010 Oct;1(4):274–8. doi: 10.4103/0974-7788.76794. [DOI] [PMC free article] [PubMed] [Google Scholar]
- 21.Frampton GM, Fichtenholtz A, Otto GA, Wang K, Downing SR, He J, et al. Development and validation of a clinical cancer genomic profiling test based on massively parallel DNA sequencing. Nat Biotechnol. 2013 Nov;31(11):1023–31. doi: 10.1038/nbt.2696. [DOI] [PMC free article] [PubMed] [Google Scholar]
- 22.Cancer Genome Atlas Research Network. Comprehensive molecular profiling of lung adenocarcinoma. Nature. 2014 Jul 31;511(7511):543–50. doi: 10.1038/nature13385. [DOI] [PMC free article] [PubMed] [Google Scholar]
- 23.Imielinski M, Berger AH, Hammerman PS, Hernandez B, Pugh TJ, Hodis E, et al. Mapping the hallmarks of lung adenocarcinoma with massively parallel sequencing. Cell. 2012 Sep 14;150(6):1107–20. doi: 10.1016/j.cell.2012.08.029. [DOI] [PMC free article] [PubMed] [Google Scholar]
- 24.Riely GJ, Marks J, Pao W. KRAS mutations in non-small cell lung cancer. Proc Am Thorac Soc. 2009 Apr 15;6(2):201–5. doi: 10.1513/pats.200809-107LC. [DOI] [PubMed] [Google Scholar]
- 25.Vigneswaran J, Tan Y-HC, Murgu SD, Won BM, Patton KA, Villaflor VM, et al. Comprehensive genetic testing identifies targetable genomic alterations in most patients with non-small cell lung cancer, specifically adenocarcinoma, single institute investigation. Oncotarget. 2016 Apr 5;7(14):18876–86. doi: 10.18632/oncotarget.7739. [DOI] [PMC free article] [PubMed] [Google Scholar]
- 26.Higgins MJ, Jelovac D, Barnathan E, Blair B, Slater S, Powers P, et al. Detection of tumor PIK3CA status in metastatic breast cancer using peripheral blood. Clin Cancer Res Off J Am Assoc Cancer Res. 2012 Jun 15;18(12):3462–9. doi: 10.1158/1078-0432.CCR-11-2696. [DOI] [PMC free article] [PubMed] [Google Scholar]
- 27.Kim ST, Lee W-S, Lanman RB, Mortimer S, Zill OA, Kim K-M, et al. Prospective blinded study of somatic mutation detection in cell-free DNA utilizing a targeted 54-gene next generation sequencing panel in metastatic solid tumor patients. Oncotarget. 2015 Nov 24;6(37):40360–9. doi: 10.18632/oncotarget.5465. [DOI] [PMC free article] [PubMed] [Google Scholar]
- 28.Janku F, Angenendt P, Tsimberidou AM, Fu S, Naing A, Falchook GS, et al. Actionable mutations in plasma cell-free DNA in patients with advanced cancers referred for experimental targeted therapies. Oncotarget. 2015 May 20;6(14):12809–21. doi: 10.18632/oncotarget.3373. [DOI] [PMC free article] [PubMed] [Google Scholar]
- 29.Thompson JC, Yee SS, Troxel AB, Savitch SL, Fan R, Balli D, et al. Detection of Therapeutically Targetable Driver and Resistance Mutations in Lung Cancer Patients by Next-Generation Sequencing of Cell-Free Circulating Tumor DNA. Clin Cancer Res Off J Am Assoc Cancer Res. 2016 Dec 1;22(23):5772–82. doi: 10.1158/1078-0432.CCR-16-1231. [DOI] [PMC free article] [PubMed] [Google Scholar]
- 30.Diehl F, Schmidt K, Choti MA, Romans K, Goodman S, Li M, et al. Circulating mutant DNA to assess tumor dynamics. Nat Med. 2008 Sep;14(9):985–90. doi: 10.1038/nm.1789. [DOI] [PMC free article] [PubMed] [Google Scholar]
- 31.Liang DH, Ensor JE, Liu Z-B, Patel A, Patel TA, Chang JC, et al. Cell-free DNA as a molecular tool for monitoring disease progression and response to therapy in breast cancer patients. Breast Cancer Res Treat. 2016 Jan;155(1):139–49. doi: 10.1007/s10549-015-3635-5. [DOI] [PubMed] [Google Scholar]
- 32.Hong DS, Morris VK, El Osta B, Sorokin AV, Janku F, Fu S, et al. Phase 1B Study of Vemurafenib in Combination with Irinotecan and Cetuximab in Patients with Metastatic Colorectal Cancer with BRAF V600E Mutation. Cancer Discov. 2016 Oct 11; doi: 10.1158/2159-8290.CD-16-0050. [DOI] [PMC free article] [PubMed] [Google Scholar]
- 33.Sandulache VC, Williams MD, Lai SY, Lu C, William WN, Busaidy NL, et al. Real-Time Genomic Characterization Utilizing Circulating Cell-Free DNA in Patients with Anaplastic Thyroid Carcinoma. Thyroid Off J Am Thyroid Assoc. 2017 Jan;27(1):81–7. doi: 10.1089/thy.2016.0076. [DOI] [PMC free article] [PubMed] [Google Scholar]
- 34.Zill OA, Mortimer SA, Banks KC, Nagy RJ, Chudova D, Jackson C, et al. Somatic genomic landscape of over 15,000 patients with advanced-stage cancer from clinical next-generation sequencing analysis of circulating tumor DNA. Abstract LBA11501. J Clin Oncol [Internet] 2016 Jun;34(18_suppl) Available from: http://bit.ly/2biymcr. [Google Scholar]
- 35.Goyal L, Saha SK, Liu LY, Siravegna G, Leshchiner I, Ahronian LG, et al. Polyclonal Secondary FGFR2 Mutations Drive Acquired Resistance to FGFR Inhibition in Patients with FGFR2 Fusion-Positive Cholangiocarcinoma. Cancer Discov. 2016 Dec 29; doi: 10.1158/2159-8290.CD-16-1000. [DOI] [PMC free article] [PubMed] [Google Scholar]
- 36.Rozenblum AB, Ilouze M, Dudnik E, Dvir A, Soussan-Gutman L, Geva S, et al. Clinical Impact of Hybrid Capture-Based Next-Generation Sequencing on Changes in Treatment Decisions in Lung Cancer. J Thorac Oncol Off Publ Int Assoc Study Lung Cancer. 2016 Nov 16; doi: 10.1016/j.jtho.2016.10.021. [DOI] [PubMed] [Google Scholar]
- 37.Karachaliou N, Mayo-de las Casas C, Queralt C, de Aguirre I, Melloni B, Cardenal F, et al. Association of EGFR L858R Mutation in Circulating Free DNA With Survival in the EURTAC Trial. JAMA Oncol. 2015 May 1;1(2):149–57. doi: 10.1001/jamaoncol.2014.257. [DOI] [PubMed] [Google Scholar]
- 38.Thress KS, Brant R, Carr TH, Dearden S, Jenkins S, Brown H, et al. EGFR mutation detection in ctDNA from NSCLC patient plasma: A cross-platform comparison of leading technologies to support the clinical development of AZD9291. Lung Cancer Amst Neth. 2015 Dec;90(3):509–15. doi: 10.1016/j.lungcan.2015.10.004. [DOI] [PubMed] [Google Scholar]
- 39.Mok TS, Wu Y-L, Ahn M-J, Garassino MC, Kim HR, Ramalingam SS, et al. Osimertinib or Platinum-Pemetrexed in EGFR T790M-Positive Lung Cancer. N Engl J Med. 2016 Dec 6; doi: 10.1056/NEJMoa1612674. [DOI] [PMC free article] [PubMed] [Google Scholar]
- 40.Fontes Jardim DL, Schwaederle M, Wei C, Lee JJ, Hong DS, Eggermont AM, et al. Impact of a Biomarker-Based Strategy on Oncology Drug Development: A Meta-analysis of Clinical Trials Leading to FDA Approval. J Natl Cancer Inst. 2015 Nov;107(11) doi: 10.1093/jnci/djv253. [DOI] [PMC free article] [PubMed] [Google Scholar]
- 41.Schwaederlé M, Zhao M, Lee JJ, Eggermont AM, Schilsky RL, Mendelsohn J, et al. Impact of Precision Medicine in Diverse Cancers: A Meta-Analysis of Phase II Clinical Trials. J Clin Oncol Off J Am Soc Clin Oncol. 2015 Nov 10;33(32):3817–25. doi: 10.1200/JCO.2015.61.5997. [DOI] [PMC free article] [PubMed] [Google Scholar]
- 42.Schwaederlé M, Zhao M, Lee JJ, Lazar V, Leyland-Jones B, Schilsky RL, et al. Association of Biomarker-Based Treatment Strategies With Response Rates and Progression-Free Survival in Refractory Malignant Neoplasms: A Meta-analysis. JAMA Oncol. 2016 Nov 1;2(11):1452–9. doi: 10.1001/jamaoncol.2016.2129. [DOI] [PubMed] [Google Scholar]
- 43.Schwaederlé M, Parker BA, Schwab RB, Daniels GA, Piccioni DE, Kesari S, et al. Precision Oncology: The UC San Diego Moores Cancer Center PREDICT Experience. Mol Cancer Ther. 2016 Apr;15(4):743–52. doi: 10.1158/1535-7163.MCT-15-0795. [DOI] [PubMed] [Google Scholar]
- 44.Zheng G, Lin M-T, Lokhandwala PM, Beierl K, Netto GJ, Gocke CD, et al. Clinical mutational profiling of bone metastases of lung and colon carcinoma and malignant melanoma using next-generation sequencing. Cancer. 2016 Oct;124(10):744–53. doi: 10.1002/cncy.21743. [DOI] [PubMed] [Google Scholar]
- 45.Sueoka-Aragane N, Katakami N, Satouchi M, Yokota S, Aoe K, Iwanaga K, et al. Monitoring EGFR T790M with plasma DNA from lung cancer patients in a prospective observational study. Cancer Sci. 2016 Feb;107(2):162–7. doi: 10.1111/cas.12847. [DOI] [PMC free article] [PubMed] [Google Scholar]
- 46.Del Re M, Tiseo M, Bordi P, D’Incecco A, Camerini A, Petrini I, et al. Contribution of KRAS mutations and c.2369C > T (p. T790M) EGFR to acquired resistance to EGFR-TKIs in EGFR mutant NSCLC: a study on circulating tumor DNA. Oncotarget. 2016 Jan 20; doi: 10.18632/oncotarget.6957. [DOI] [PMC free article] [PubMed] [Google Scholar]
- 47.Que D, Xiao H, Zhao B, Zhang X, Wang Q, Xiao H, et al. EGFR mutation status in plasma and tumor tissues in non-small cell lung cancer serves as a predictor of response to EGFR-TKI treatment. Cancer Biol Ther. 2016;17(3):320–7. doi: 10.1080/15384047.2016.1139238. [DOI] [PMC free article] [PubMed] [Google Scholar]
- 48.Schwaederle M, Husain H, Fanta PT, Piccioni DE, Kesari S, Schwab RB, et al. Use of Liquid Biopsies in Clinical Oncology: Pilot Experience in 168 Patients. Clin Cancer Res Off J Am Assoc Cancer Res. 2016 May 16; doi: 10.1158/1078-0432.CCR-16-0318. [DOI] [PubMed] [Google Scholar]
- 49.Drilon A, Wang L, Arcila ME, Balasubramanian S, Greenbowe JR, Ross JS, et al. Broad, Hybrid Capture-Based Next-Generation Sequencing Identifies Actionable Genomic Alterations in Lung Adenocarcinomas Otherwise Negative for Such Alterations by Other Genomic Testing Approaches. Clin Cancer Res Off J Am Assoc Cancer Res. 2015 Aug 15;21(16):3631–9. doi: 10.1158/1078-0432.CCR-14-2683. [DOI] [PMC free article] [PubMed] [Google Scholar]
Associated Data
This section collects any data citations, data availability statements, or supplementary materials included in this article.