Abstract
The goal is to develop an imaging method where contrast reflects amide-water magnetization exchange, with minimal signal contributions from other sources. Conventional chemical exchange saturation transfer (CEST) imaging of amides (often called amide proton transfer, or APT, and quantified by the metric MTRasym) is confounded by several factors unrelated to amides, such as aliphatic protons, water relaxation, and macromolecular magnetization transfer. In this work, we examined the effects of combining our previous chemical exchange rotation (CERT) approach with the non-linear AREX method while using different duty cycles (DC) for the label and reference scans. The dependencies of this approach, named AREXdouble,vdc, on tissue parameters, including T1, T2, semi-solid component concentration (fm), relayed nuclear Overhauser enhancement (rNOE), and nearby amines, were studied through numerical simulations and control sample experiments at 9.4 T and 1 µT irradiation. Simulations and experiments show that AREXdouble,vdc is sensitive to amide-water exchange effects, but is relatively insensitive to T1, T2, fm, nearby amine, and distant aliphatic protons, while the conventional metric MTRasym, as well as several other APT imaging methods, are significantly affected by at least some of these confounding factors.
Keywords: Magnetization transfer (MT), Chemical exchange saturation transfer (CEST), APT
INTRODUCTION
Non-invasive magnetic resonance imaging techniques that are sensitive to changes in protein level are of considerable interest for detecting and characterizing pathological changes in many disorders. However, although cells contain an abundance of proteins/peptides, these molecules do not provide signals that are easily measurable in practical magnetic resonance spectroscopy (MRS) experiments, and they have been rarely examined in vivo or in cells (1–3). Amide proton transfer (APT) imaging has developed as an alternative, sensitive approach to imaging the protein content (4–6). APT is a variation of chemical exchange saturation transfer (CEST) imaging that can detect the effects of backbone amide protons associated with endogenous mobile, cytosolic proteins and peptides in biological tissue. However, there are inherent and critical technical obstacles to the in vivo application and interpretation of APT. APT imaging indirectly detects amide protons by observing the water signal changes caused by chemical exchange, and in practice depends on multiple tissue parameters.
APT images are acquired after a pre-saturating RF pulse, and the residual water signals are typically compared for two or more different irradiation offset frequencies. Commonly, an asymmetry analysis (comparing images obtained from offset frequencies symmetric about the water resonance) is used to quantify the APT contrast. Although this works well in phantom studies, there are several factors in vivo that confound this approach, including effects of tissue relaxation, semi-solid magnetization transfer (MT), MT asymmetry, relayed nuclear overhauser enhancements (rNOE) from aliphatic protons, and contributions from other nearby exchanging protons such as amines (7–11). The relative magnitudes of these depend on the irradiation power level. A three-point method (APT*), in which the measured signals obtained by irradiating the amide resonance and the average of two nearby frequencies are subtracted, has been suggested as one way to avoid some effects, such as MT asymmetry and rNOE contributions (12). Similarly, an APT imaging method using saturation with frequency alternating RF irradiations (SAFARI) has also been introduced to reduce such effects (13). All these methods, however, acquire data at multiple frequencies and hence implicitly assume relations concerning the composition and frequency dependence of the tissue. These assumptions are often not warranted in vivo. MTRdouble, a metric based on chemical exchange rotation transfer (CERT), takes a different approach by subtracting pulsed-CEST signals at two different irradiation flip angles but the same frequency, which dramatically reduces the MT asymmetry, rNOE, and amine-water exchange contributions (8). However, this CERT approach, as well as the other methods, assumes that signal components add linearly and hence cannot fully remove direct saturation (DS) and semi-solid MT effects. Additionally, these methods typically do not account for relaxation effects and thus may retain a significant dependence on the relaxation time T1. (T1 itself changes in many conditions including tumor and post-stroke, and reduces the specificity of APT contrast, which ideally would be specific to amide-water exchange effects.) Finally, CERT approaches in particular, by isolating only the transfer of rotated magnetization, typically have half the contrast of isolated CEST effects in comparison to conventional methods, and hence are difficult to distinguish from image noise, artifacts, and signal drift.
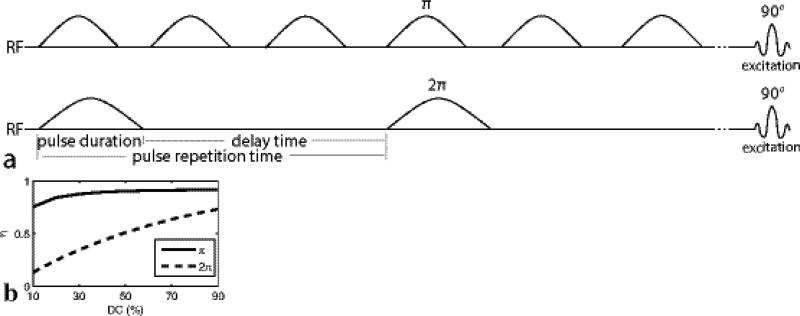
Here we aim to correct these deficiencies in the CERT approach. We incorporate a recent advance using inverse or reciprocal subtraction to correct for DS, semi-solid MT effects, and water relaxation (14), as utilized by the previously introduced AREX metric (15). Here we introduce a new metric, AREXdouble,vdc, which combines the use of a single frequency offset (as in CERT methods and the MTRdouble metric (8,16)) with the inverse subtraction approach (as in AREX (14)). In this way, we minimize contributions from MT asymmetry and rNOE effects (via single frequency acquisition) and DS and semi-solid MT effects (via inverse subtraction). Furthermore, the single frequency CERT approach has been shown (8) to filter (via exchange rate) the contributions from nearby fast exchanging amines, and hence we expect minimal contributions from amines in the new AREXdouble,vdc metric. In addition, we borrow the T1 normalization approach of AREX, and thus avoid this confounding effect. Finally, we also vary the duty cycles (vdc) in the π and 2π pulse trains, which greatly magnifies the resulting CERT signal compared to the previous single duty cycle (DC) MTRdouble approach. Here, DC is defined as the ratio of the pulse duration to the pulse repetition time (PTR) (Fig. 1a). In sum, we address the three major deficiencies of our previous CERT metric.
FIG. 1.
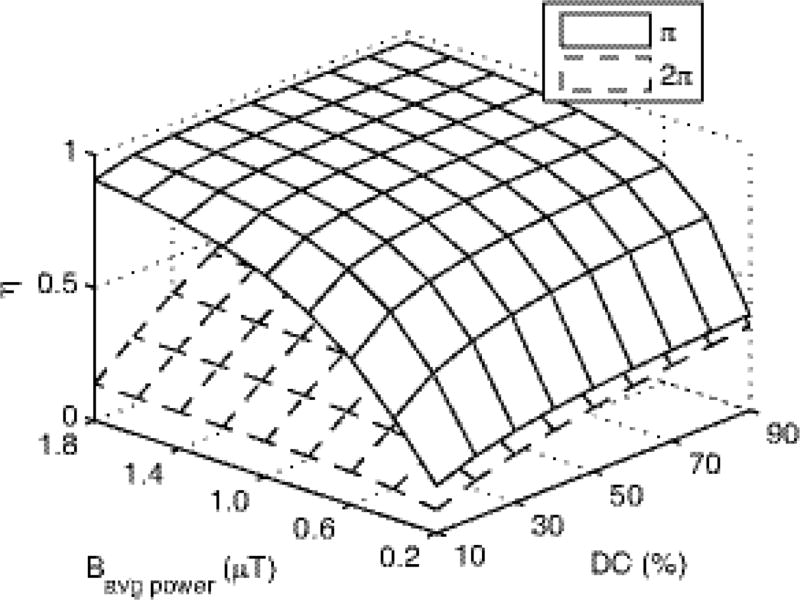
(a) Diagram of the AREXdouble,vdc and MTRdouble,vdc sequences, which have label and reference scans that vary the flip angle of the pulse trains while maintaining the same average irradiation power. Unlike in our previous work, the DC varies, with the train of π pulses at 70% dc and the 2π pulses at 30% dc. (b) Simulated amide labeling efficiency (η) vs. DC for π and 2π pulse trains at a Bavg power of 1 µT.
In this work, we study the specificity of conventional (MTRasym) and unconventional (APT*, MTRdouble,vdc, AREX with asymmetric analysis, and the new AREXdouble,vdc) APT imaging methods. We use numerical simulations and control phantom experiments to demonstrate the increased specificity of AREXdouble,vdc (in comparison to other APT methods) to changes in amide concentration and exchange rate.
THEORY
Asymmetric analysis and symmetric analysis
Conventionally, an asymmetry analysis has been used to process CEST Z-spectra in order to remove the DS and semi-solid MT effects (17):
| (1) |
Here S+ and S− are the signals acquired with a downfield irradiation pulse (label) and the symmetrically opposite side of the water peak (reference). S0 is the signal acquired with no irradiation. For in vivo studies with MT asymmetry, rNOEs, and nearby amines, the MTRasym is influenced by multiple effects.
To reduce the influence on MTRasym from MT asymmetry and rNOE effects, two methods have been developed that avoid acquisitions at negative offsets. One method is APT* which was defined to be (12),
| (2) |
Another approach is CERT, which attempts to address the problem of MT asymmetry and rNOE effects by making all the measurements at a single frequency. It produces a metric MTRdouble, defined to be (8)
| (3) |
where Sπ and S2π are the signals acquired with irradiation flip angles at π and 2π, but at the same frequency offset and average irradiation power (Bavg power). Distinct from conventional MTRasym analysis, these two APT imaging methods acquire both label and reference signals on one side of water, and thus avoid contamination from MT asymmetry and rNOE effects on the other side of water.
In this paper, we make two modifications to our previous CERT work. First, we vary the DC of the π and 2π pulse trains. This change is motivated by Fig. 1b, which shows that the separation in the labeling efficiencies (η) between the two pulse trains (which dictates the resulting exchange mediated contrast) is maximized when the π pulses are applied at a high DC (70% in this work) and the 2π pulses are applied at a low DC (30% in this work). This change gives a new metric, MTRdouble,vdc, which is identical to MTRdouble, but with varying duty cycles for the two pulse trains.
Direct subtraction and inverse subtraction
Our second modification is based on the recent work by Zaiss (14,15) et al., who has shown that inverse subtraction of label and reference signals in the AREX metric is more effective at eliminating confounding DS and semi-solid MT signal contributions than is conventional linear signal subtraction. In addition, the AREX metric also corrects for R1 effects and is defined by the following equation when the reference signal is obtained by the asymmetric analysis.
| (4) |
Where R1obs is the apparent longitudinal relaxation rate of water. Here we introduce AREXdouble,vdc
| (5) |
The AREXdouble,vdc is based on two pulsed-CEST signals with two different irradiation flip angles, varying duty cycles, but constant irradiation frequency offset and average power.
Results from numerical simulations below will demonstrate that (at lower powers)
| (6) |
Where fs and ksw are the amide proton concentration and exchange rate, respectively, and ηπ and η2π are label efficiencies of the S2π(3.5ppm) reference and Sπ(3.5ppm) label scans, respectively, for a two-pool model in ideal conditions (no semi-solid MT and DS effects). This result is consistent with the labeling efficiency interpretation of Zaiss et al. (14), but without the rNOE and MT asymmetry confounding factors.
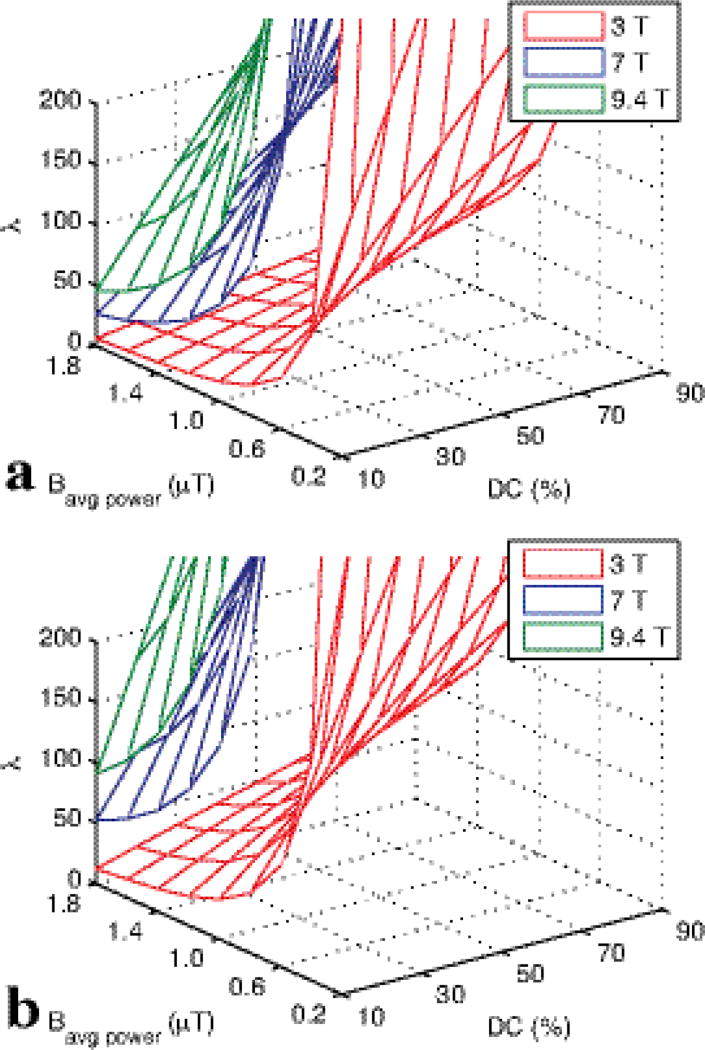
Eq. (6) facilitates the interpretation of AREXdouble,vdc images and, as discussed here, pulse sequence design. Simulations below will show that the difference in the two labeling efficiencies is roughly independent of solute tissue parameters, e.g. the solute relaxation times T1s and T2s, and the chemical exchange rate ksw (at least when the relaxation and exchange rates are in the slow or intermediate exchange regime compared with Bavg power). However, ηπ and η2π do depend on sequence parameters (e.g., Bavg power and DC). For the Bavg power of 1 µT, DC of 70% for π and 30% for 2π pulses used in this paper, ηπ−η2π is around 0.566. While the Bavg power choice was primarily dictated by the expected exchange rate and semi-solid MT parameters (18), the DC was guided by Appendix Fig. A1 and B1. By using different DC’s for the π and 2π pulses, ηπ − η2π can be maximized. However, care must be made to maintain the adiabatic condition of the pulses with respect to water excitation and to avoid dramatic changes in pulse bandwidth. That is, we want water to be saturated, but not rotated, when irradiating at the solute resonance. Fig. B1 illustrates the rapid decline in adiabaticity at low DC, which may be an issue when measuring amides at 3T, but is less likely at higher fields. (When the adiabatic condition is not met, λ in Fig. B1 approaches 1, and water is directly rotated. This direct water rotation, in addition to the expected saturation, leads to AREXdouble,vdc contributions from confounding, non-amide sources of signal.)
METHOD
Phantom Preparation
A series of creatine samples served as phantoms to test different methods. Creatine amine-water exchange rates under the titrated pH (6.2 – 6.6) are close to the amide-water exchange rates in the physiological range (19,20), and can be used to mimic amide-water exchange. To study the sensitivity of different APT contrasts to relaxation, three samples were made of 50 mM creatine with 0.05mM MnCl2, 0.075mM MnCl2, and 0.1mM MnCl2. pH was titrated to 6.4 for these three samples at room temperature. We expect the APT contrast to be proportional to the product of amide concentration (fs) and exchange rate (ksw), and to test this sensitivity, five samples were made with creatine concentration and pH of (50 mM, 5.9), (25 mM, 6.4), (50 mM, 6.4), (75 mM, 6.4), and (50 mM, 6.6) at room temperature. All chemicals were purchased from Sigma-Aldrich (St. Louis, MO, USA).
To study the influence of rNOEs or nearby amines, egg white and glutamate phantoms were prepared and measured at room temperature. Egg white consists of about 90% water into which is dissolved 10% proteins (including albumins, mucoproteins, and globulins), and contains almost no fat, and carbohydrate content is less than 1%, and thus is a good model for proteins in tissues. We have reported that boiled egg white has significant APT at 3.5 ppm and rNOE at −3.5 ppm (16). The protein phantom was prepared by boiled chicken egg white. It was also reported that glutamate is the main amine proton component for metabolites (21). The glutamate phantom was prepared by adding 30 mM glutamate in 1 × Phosphate buffered saline (PBS), and the solute pH was titrated to 7.0 using NaOH and HCl.
Animal Preparation
Three Sprague Dawley rats (250–300 grams) bearing 9L tumors were immobilized and anesthetized with a 2%/98% isoflurane/oxygen mixture. Respiration was monitored to be stable, and a rectal temperature of 37°C was maintained constant throughout the experiments using a warm-air feedback system (SA Instruments, Stony Brook, NY). All experiments were measured in 1 h after onset of isoflurane. For brain tumor induction, each rat was injected with 1 × 10⁵ 9L glioblastoma cells in the right brain hemisphere, and was then imaged after 2 to 3 weeks. All procedures were approved by the Institutional Animal Care and Usage Committee at Vanderbilt University.
MRI and Experiment
MR data were acquired using a Varian DirectDrive™ spectrometer interfaced with a horizontal 9.4T magnet and a 38-mm Litz RF coil (Doty Scientific Inc. Columbia, SC). The CERT sequences for AREXdouble,vdc (Fig. 1a) are made up of two pulsed-CEST sequences with the same average power, but different irradiation flip angles π or 2π, respectively. The pulsed-CEST sequences used a series of Gaussian RF irradiation pulses followed by acquisition. Crusher gradients (with alternating sign) were applied between each irradiation pulse to spoil residual transverse magnetization. The continuous wave (CW)-CEST sequence contains a long rectangular RF pulse followed by acquisition. A total of 5 s irradiation for both pulsed- or CW-CEST was performed before acquisition to ensure the CEST system reached steady state. All images of rat brains were acquired using a single-shot Spin-echo Echo Planar Imaging (SE-EPI) with matrix size 64 × 64, field of view 30 × 30 mm, and number of acquisitions = 1. All measurements on samples were obtained by a free induction decay (FID) acquisition.
For all experiments on phantoms and animals, two pulsed-CEST sequences were implemented with the same Bavg power of 1.0 µT. The first sequence used an irradiation flip angle of π and DC of 70%. The second used 2π and 30%. This leads to a PTR of 18.3 ms and pulse duration of 12.8 ms for π pulses, and a PTR of 56 ms and pulse duration of 16.8 ms for 2π pulses, respectively. (The RF amplitude was changed in order to maintain a constant Bavg power, following the relations published previously (18).) A CW-CEST sequence with irradiation B1 of 1.0 µT was also performed. Z-spectra were acquired with RF offsets from −2000 Hz to 2000 Hz (−5 ppm to 5 ppm at 9.4 T) with an interval of 50 Hz (0.125 ppm at 9.4 T). Control scans were performed to acquire S0 by setting the RF offset to 100,000 Hz. The two pulsed-CEST signals were used to calculate MTRdouble,vdc and AREXdouble,vdc. CW-CEST signals were used to calculate MTRasym, APT*, and AREX. T1 and semi-solid component concentration (fm) were obtained using a selective inversion recovery (SIR) method with inversion time of 4, 5, 6, 7, 8, 10, 15, 20, 50, 100, 400, 800, 1000, 3000, 5000, and 8000 ms (22,23). T2 was obtained using five echo times of 30, 50, 70, 90, and 110 ms.
For fitting of fs and ksw in the creatine phantoms, CW-CEST sequences with irradiation powers of 0.5, 1.0, and 2.0 µT and RF offsets from −2000 Hz to 2000 Hz were performed (−5 ppm to 5 ppm at 9.4 T) with a step size of 50 Hz (0.125 ppm at 9.4 T). The acquired Z-spectra were numerically fit to a two-pool (solute and water) model. ksw, fs, T2, and solute transverse relaxation rate (R2s) were fit, with the creatine resonance assumed at 1.9 ppm from water, water T1 assumed to match the fitting results from a separate inversion recovery sequence with eight inversion times ranging from to 10 ms to 4.5 s, and all other sample parameters assumed to match those used in the simulations.
Numerical Simulation and Data Processing
To study the dependences of several APT imaging methods on tissue parameters, simulations were performed with a three-pool model which contains an amide solute pool, symmetric or asymmetric semi-solid component pool, and water pool. There is exchange between the exchangeable species (amide, semi-solid solid component) and water, but none between the amide and semi-solid component. MTRasym, APT*, MTRdouble,vdc, and AREXdouble,vdc were numerically simulated for a range of sample parameters. We varied ksw (0, 20, 40, 60, 80, 100 s−1), fs (0, 0.0005, 0.001, 0.0015, 0.002, 0.0025), T1 (0.5, 1.0, 1.5, 2.0, 2.5 s), T2 (20, 40, 60, 80, 100 ms), fm (0.03, 0.06, 0.09, 0.12, 0.15) for both symmetric and asymmetric semi-solid lineshapes. Each parameter was varied individually, with all other parameters remaining at the value in bold. R1obs that was used to calculate MTRdouble,vdc, and AREXdouble,vdc was set to be (1+ fm)/T1 (24). Other simulation parameters include: amide proton longitudinal and transverse relaxation (1.5 s and 15 ms); semi-solid component longitudinal and transverse relaxation (1.5 s and 15 µs); semi-solid component-water exchange rate (25 s−1); amide offset of 3.5 ppm; semi-solid component offset of 0 ppm for the symmetric case and −2.3 ppm for the asymmetric solid case (25). B1 and Bavg power were set to be 1.0 µT for CW-CEST and pulsed-CEST sequence, respectively. DC was set to be 70% for π pulse irradiation and 30% for 2π pulse irradiation. To study the dependences of AREXdouble,vdc defined in Eq. (5) on sequence parameters, simulations were performed with the same three-pool model. We varied the Bavg power (0.2, 0.4, 0.6, 0.8, 1.0, 1.2, 1.4, 1.6, 1.8 µT). Other parameters (water relaxation rate, solute concentration and relaxation rate, and ksw) use the above values in bold.
To study the dependences of labeling efficiency under pulsed-irradiation on tissue parameters, simulations were performed with a two-pool model which contains an amide solute and water pool. We define the labeling efficiency as the fractional change from equilibrium of the exchanging solute magnetization due to an RF pulse applied at the solute resonance, and without direct water irradiation effects. This ignoring of DS makes labeling efficiency a more informative concept, since it separates direct solute and water irradiation effects, and is simulated by setting the irradiation power (ω1) in front of water signal in the exchange-modified Bloch equation to be 0 (17). The labeling efficiencies are calculated by averaging the steady state solute spin magnetization during a pulse repetition time normalized by equilibrium solute spin magnetization. We varied the T1 (0.5, 1.0, 1.5, 2.0, 2.5 s), T2 (20, 40, 60, 80, 100 ms), T1s (0.5, 1.0, 1.5, 2.0, 2.5 s), T2s (5, 10, 15, 20, 25 ms), and ksw (20, 40, 60, 80, 100 s−1). Each parameter was varied individually, with all other parameters remaining at the value in bold. Other simulation parameters include water relaxation rates, solute concentration, and sequence parameters. These are set to be the same as those used in the above simulations. To study the dependencies of labeling efficiency under pulsed-irradiation on sequence parameters, simulations were performed with the same two-pool model and using the sample parameters listed above in bold. We varied the Bavg power (0.2, 0.4, 0.6, 0.8, 1.0, 1.2, 1.4, 1.6, 1.8 µT). These labeling efficiency dependencies were then compared to AREXdouble,vdc variations to test the accuracy of Eq. 6.
To study the dependencies of the adiabatic condition we varied Bavg power (0.2, 0.4, 0.6, 0.8, 1.0, 1.2, 1.4, 1.6, 1.8 µT), DC (0.1, 0.2, 0.3, 0.4, 0.5, 0.6, 0.7, 0.8, 0.9), and B0 (9.4, 7, 3 T) and calculated the adiabatic condition λ = γ|B⃗eff|/ψ̇, where Beff is the effective irradiation field and ψ is the angle between Beff and B1. The AREXdouble,vdc metric defined by Eq. 5 implicitly assumes that DS is a function of Bavg power, which is true when the adiabatic metric is >>>1 and no Rabi precession occurs.
Each three-pool model simulation included seven coupled Bloch equations which can be written as , where A is a 7 × 7 matrix. For one-pool or two-pool model simulations, the parameters related to non-simulated pools were set to 0. The water and amide pool each have three coupled equations representing their x, y, and z components. The semi-solid component pool has a single coupled equation representing the z component, with an additional term for saturation effects (26). A super-Lorentzian absorption lineshape (which best fits biological tissue (27–29)) was used for the semi-solid component pool in all simulations of the phantom. All numerical calculations of the CW or pulsed-CEST signals integrated the differential equations through the pulse sequence using the ordinary differential equation (ODE) solver in Matlab. Spoiling was modeled by nulling the transverse components of the magnetization between the irradiation pulse and acquisition. All simulations were performed with static field strength of 9.4 T except where noted.
Data analysis and statistics
Region of interests (ROIs) for tumors and contralateral normal tissues were outlined from each tumor rat brain based on the T1 map. Student’s t-tests were employed to evaluate the signal differences, which were considered to be statistically significant when P < 0.05.
RESULTS
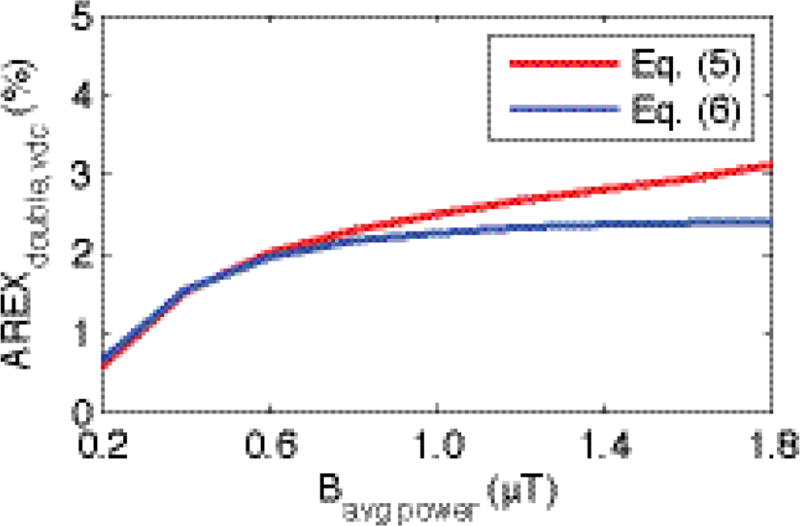
Fig. 2 shows the simulated AREXdouble,vdc, defined in Eq. (5), and our approximation based on differences in solute saturation (which implicitly assumes no net dependence on direct RF effects on macromolecular or water protons), defined in Eq. (6), under a variety of Bavg power. Note in Fig. 2 that the two curves match well at relatively low Bavg power, e.g. for Bavg power ≤ 1µT, the AREXdouble,vdc in Eq. (6) is ≥ 90.4% of that in Eq. (5). At relatively high Bavg power, the curves separate, which may be due to Eq. (6) ignoring direct water and macromolecular saturation, or from additional terms not captured by this simplified phenomenological functional form.
FIG. 2.
Numerical simulations of Eq. (5) and (6) with a variety of Bavg power. Note that the two curves match well at relatively low Bavg power. At 1 µT, which is used in this paper, the AREXdouble,vdc in Eq. (6) (2.26 %) is 90.4 % of that in Eq. (5) (2.50 %).
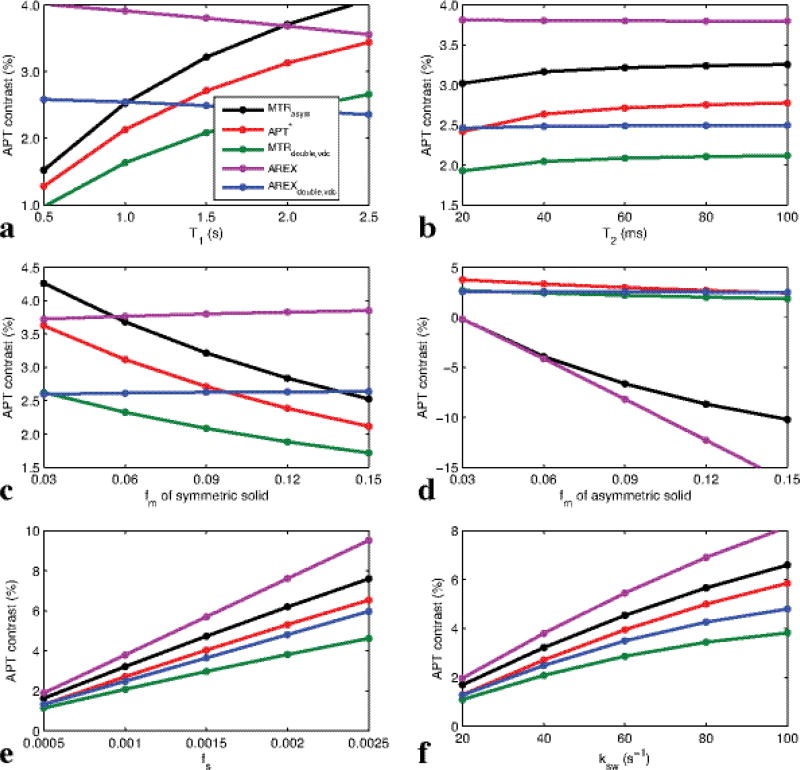
Fig. 3 shows simulated MTRasym, APT*, MTRdouble,vdc, AREX, and AREXdouble,vdc as a function of T1 (a), T2 (b), fm for symmetric semi-solid component (c), fm for asymmetric semi-solid component (d), fs (e), and ksw (f), respectively. It was found that AREXdouble,vdc depends linearly on fs and ksw, but not on other tissue parameters, while MTRasym, APT*, AREX, and MTRdouble,vdc depend on several other (non-amide) tissue parameters. Specifically, MTRasym and AREX (which acquires data on both sides of water) have strong dependencies on the asymmetric semi-solid component, as seen in Fig. 3d. MTRasym, MTRdouble,vdc and APT* (which assume effects add linearly with no correction for T1 effects) have dependencies of T1, T2, and the symmetric semi-solid component.
FIG. 3.
Simulated MTRasym, APT*, MTRdouble,vdc, AREX, and AREXdouble,vdc as a function of T1 (a), T2 (b), fm (c), fs (e), and ksw (f), respectively, with the symmetric-solid three-pool model (amide, symmetric semi-solid component, water), and as a function of fm (d) with the asymmetric-solid three-pool model (amide, asymmetric semi-solid component, water). Note that AREXdouble,vdc depends significantly only on the solute parameters fs and ksw, but not other tissue parameters, while all other APT imaging methods depend on several other tissue parameters such as T1, T2, and fm.
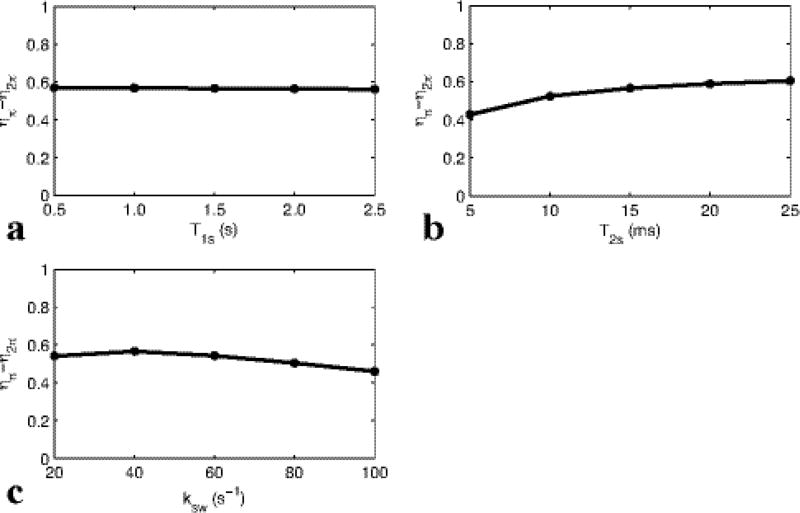
Fig. 4 shows the simulated difference of two labeling efficiencies (for reference and label scans) under pulsed-irradiation. (ηπ − η2π) is plotted vs. the solute relaxation times T1s and T2s, and ksw (limited to the slow to intermediate exchange regime compared with Bavg power). It was found that the subtraction of these two labeling efficiencies is roughly independent of the tissue parameters (though not the sequence parameters Bavg power and DC) in our simulation range. Therefore, (ηπ − η2π) can be determined through numerical simulations with known sequence parameters, but with unknown tissue parameters. Hence, AREXdouble,vdc results can be interpreted in terms of the pure amide-water exchange effect fsksw, which can then be accurately obtained using Eq. (6) for a wide range of tissue states.
FIG. 4.
Simulated subtraction of two labeling efficiencies in the reference and label scan under pulsed-irradiation vs. T1s (a), T2s (b), ksw (c). Note that ηπ−η2π is roughly independent of tissue parameters
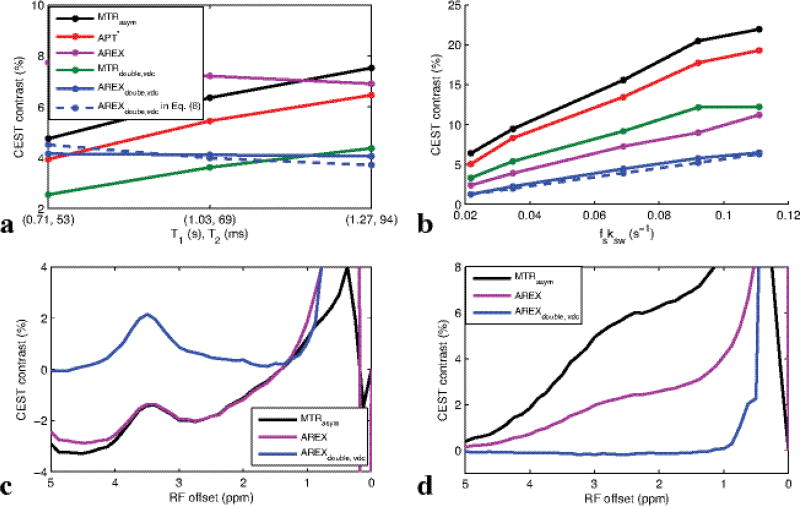
Fig. 5(a–b) shows the experimental MTRasym, APT*, MTRdouble,vdc, AREX, AREXdouble,vdc, and AREXdouble,vdc defined in Eq. (6) on creatine phantoms as a function of (T1, T2) (a) and fsksw (b). Similar to simulations in Fig. 3, AREXdouble,vdc depends linearly on fsksw, but not on T1 and T2, while MTRasym and MTRdouble depend on all tissue parameters. The big differences between the simulated and experimental results in Fig. 3 and Fig. 5 are caused by limits in the ability to make phantoms that vary only one sample parameter at a time. MTRasym, AREX, and AREXdouble,vdc spectra of egg white and glutamate phantoms are shown in Fig.5c and 5d to show the influences from rNOE and nearby amines. While AREX showed a rough independence from T1 and T2 in (a), acquisitions at multiple frequencies and limited exchange-rate filtering make it susceptible to influence from rNOE effects and amine proton contributions. These effects can be seen in the sloping negative AREX baseline in Fig. 5c in the egg white phantom (indicating the significant contamination from rNOE effect on the other side of water), and in the broad AREX peak from glutamate in Fig 5d. MTRasym shows similar influences, but AREXdouble,vdc is largely immune from rNOE and amine signal contributions. In sum, Fig. 3 and Fig. 5 show that AREXdouble,vdc is more specific to amide-water exchange effects (at least, in these phantoms) than are MTRasym, APT*, MTRdouble,vdc, and AREX.
FIG. 5.
Experimental MTRasym, APT*, MTRdouble,vdc, AREX, MTRdouble,vdc, and AREXdouble,vdc of creatine phantoms as a function of measured (T1, T2) (a) and fitted fsksw (b). fs and ksw in (a) were relatively constant, with fitted values of (0.0015, 0.0014, 0.0015) and (59, 50, 46 s−1), respectively, for the three phantoms with varying MnCl2 concentrations. In (b), fsksw values were (0.0217, 0.0347, 0.0689, 0.0921, 0.1109 s−1) for five phantoms with varying pH and creatine concentration. Detailed parameters are listed in Table 1. Only AREX and AREXdouble,vdc show the desired linearity and fs and ksw while being independent of T1 and T2. However, only AREXdouble,vdc avoids contamination by rNOE effects in egg white (c) and amine contributions in glutamate (d), cases where AREX is non-specific similar to conventional MTRasym (which is also plotted in (c) and (d) for comparison)
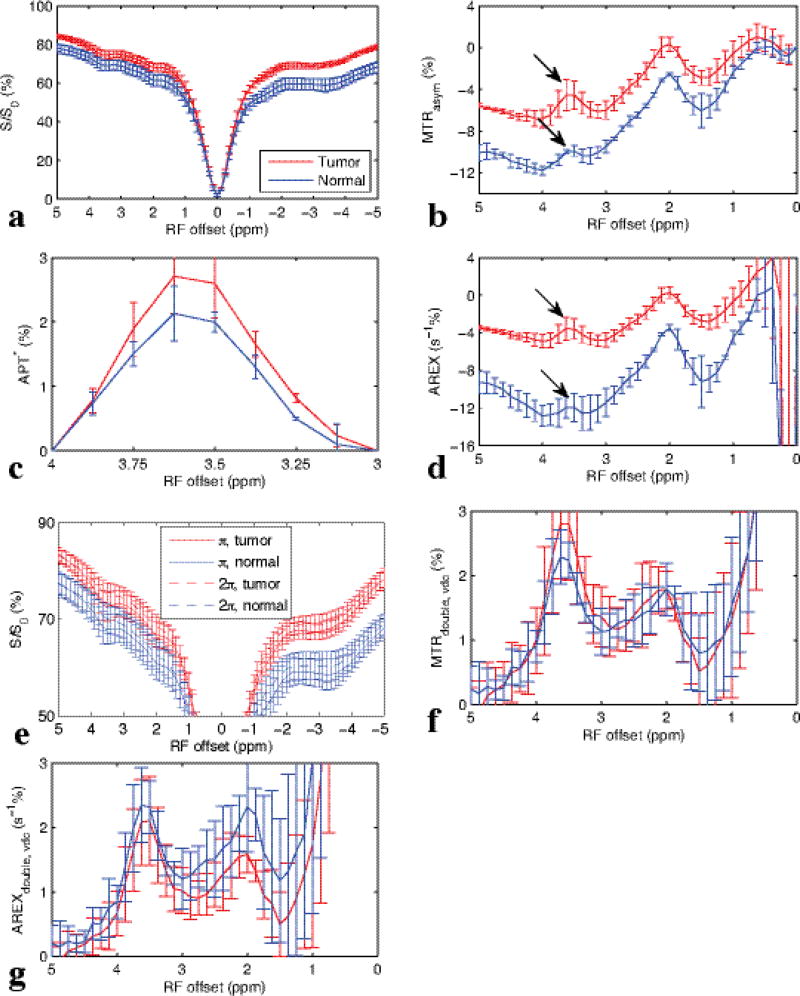
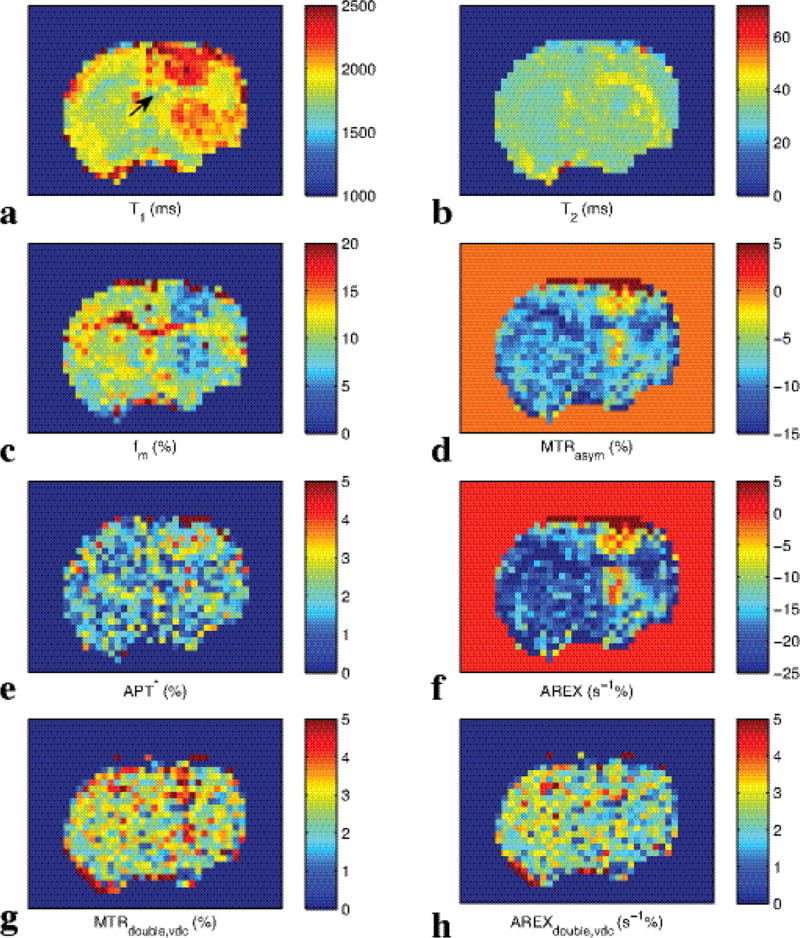
Fig. 6 shows the experimental CW-CEST Z-spectra (a), MTRasym spectra (b), APT* spectra (c), AREX spectra (d), pulsed-CEST Z-spectra (e), MTRdouble,vdc (f), and AREXdouble,vdc spectra (g) from three rat brains bearing 9L tumors. The AREXdouble,vdc at 3.5 ppm was measured to be 0.021 ± 0.0069 in tumor and 0.023 ± 0.004 in contralateral normal tissue, as will be discussed below. Note in (b) and (d) that the amide peak (arrow) in conventional MTRasym and AREX resides on top of a broad negative base line that originates from the MT asymmetry and rNOE effects. Also note in (f) and (g) that using CERT based metrics avoids this negative, sloping baseline, and hence isolates the amide peak from other factors. (The signal at around 2 ppm is from amine sites in medium exchange regime. Based on the width of this peak, it has little influence on APT signal at 3.5 ppm). Fig. 7 show the images of T1 (a), T2 (b), fm (c), MTRasym (d), APT* (e), AREX (f), MTRdouble,vdc (g), and AREXdouble,vdc (h) from a representative rat brain.
FIG. 6.
In vivo results from three rat brains bearing 9L tumors: experimental Z-spectrum with CW-CEST (a), and corresponding calculated MTRasym (b), APT* (c), and AREX (d) spectra. Z-spectrum with π and 2π pulsed-irradiation (e), corresponding calculated MTRdouble,vdc (f), and AREXdouble,vdc (g) spectra from tumors and contralateral normal tissues.
Fig. 7.
Images of T1 (a), T2 (b), fm (c), MTRasym (d), APT* (e), AREX (f), MTRdouble,vdc(g), and AREXdouble,vdc (h) from a representative rat brain. Arrow in (a) indicates the location of the tumor.
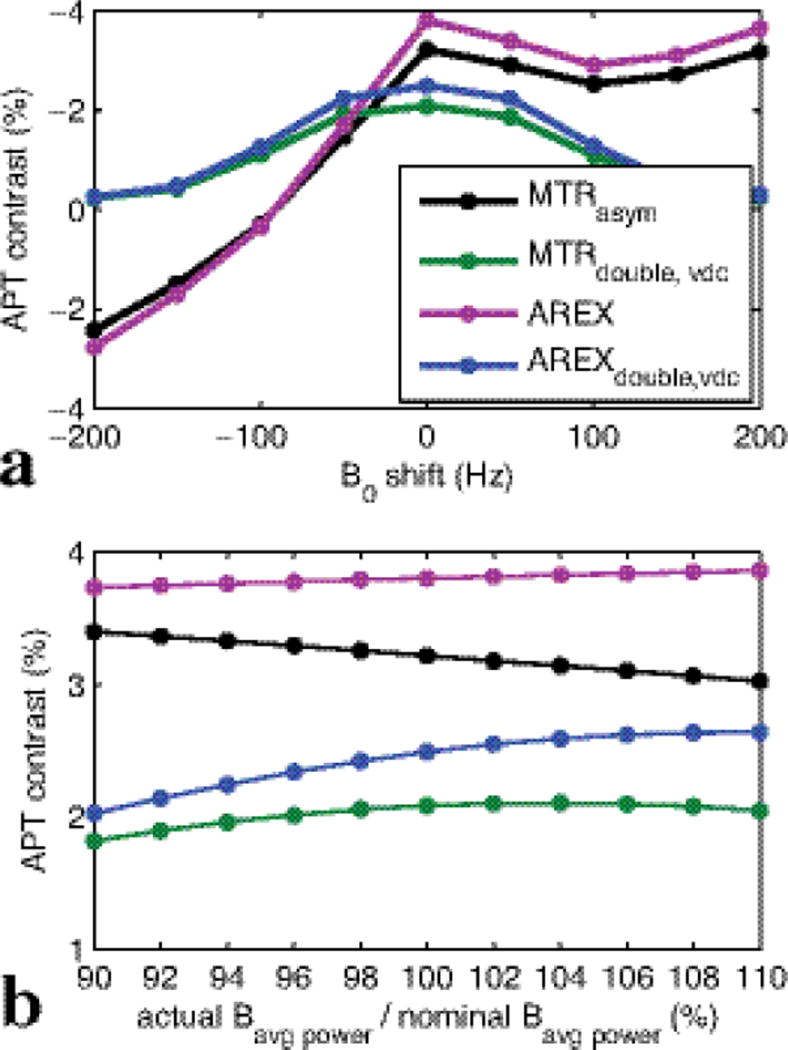
Fig. 8 shows the simulated MTRasym, MTRdouble,vdc, and AREXdouble,vdc vs. B0 shift (a) and Bavg power error (b), respectively. It was found that although AREXdouble,vdc has a little more deviation than MTRasym under Bavg power error (18.59 % for AREXdouble,vdc and 5.66 % for MTRasym with −10% error), AREXdouble,vdc is much more robust to a B0 shift than MTRasym (10.2% for AREXdouble,vdc and 54.76% for MTRasym with −50 Hz B0 shift). However, this MTRasym sensitivity to B0 may be largely corrected at the time-cost of adding an additional WASSR scan (which we did not do in this work).
FIG. 8.
Plot of simulated MTRasym, MTRdouble,vdc, AREX, and AREXdouble,vdc vs. B0 shift (a) and Bavg power error (b), respectively.
DISCUSSION
In this paper, we extended our previous CERT work by incorporating inverse subtraction of label and reference scans, correcting for T1 effects, and varying the duty cycle between the label and reference scans. We continue to use only a single irradiation frequency for both label and reference scans, in which irradiation by a train of π pulses is used as the label scan and irradiation by a train of 2π pulses is used as the reference scan. The same average irradiation power is applied so that fast nearby amine (e.g. glutamate), DS, and semi-solid MT effects are the same in both the reference and label scans, and an inverse subtraction and T1 correction are used to fully remove the influences of other factors while specifically isolating amide-water exchange effects.
AREXdouble,vdc is proportional to amide concentration (fs) and amide-water exchange rate (ksw) under the conditions simulated in this study (relatively slow ksw), and this metric can be used to measure specifically protein/peptide concentration and pH, if one of these quantities is known by other means and the proportionality constant ηπ−η2π (see Eq. 6) is also known. Because ηπ−η2π is roughly independent of tissue parameters when Bavg power is on the same scale as ksw and 1/T2s, this quantity can be determined through numerical simulations. (T2s has only rarely been measured, so it is unclear if this restriction may in fact be problematic for CERT measures, e.g. if T2s is exceptionally short, on the order of milliseconds.) In addition, a “pure” CEST effect in a simple two-pool model (solute and water) should have no net DS effects and be equal to the product of solute concentration, solute-water exchange rate, and the labeling efficiency (14). The rough equality (as indicated by Fig. 2) of the two definitions of AREXdouble,vdc in Eq. (5) and Eq. (6) indicates that AREXdouble,vdc (as defined by Eq. 5) can successfully remove the confounding factors in simulated biological tissue, and obtain pure a CEST effect, at least at low powers.
The choice of the acquisition parameters Bavg power and DC is non-trivial, and in the current work we did not optimize these (which in general would depend on field strength, chemical shift, and exchange rate) but instead made reasonable choices. The Bavg power of 1 µT is a balance between being roughly equal or faster than ksw (since solute rotation has to be faster than exchange) while still avoiding extensive DS, semi-solid MT effects, or direct water rotation. (Direct water rotation occurs when the pulse is no longer adiabatic from the water proton’s perspective, and Appendix B examines this issue.) The choice of 1 µT irradiation was driven by the requirements of the AREXdouble,vdc method, and is nonetheless a reasonable choice for the other simulated and measured APT metrics, which are typically performed in the range 0.5 to 2.0 µT. However, note that the choice of irradiation power may affect the degree of signal contamination by confounding factors in non-trivial ways. The choices of 70% DC for the label pulse train and 30% for the reference pulse train were motivated by balancing maximizing ηπ−η2π while again maintaining the adiabaticity of the pulses effect on the water magnetization. (Appendix plots A and B provided the numerical guidance on these choices.)
A similar work combined the three-point analysis method (APT*) with inverse subtraction (15,30). This method is similar to AREXdouble,vdc, except that it uses two signals acquired near the amide resonance (3 and 4 ppm) for the reference instead of acquiring at the amide resonance (3.5 ppm) at a different irradiation flip angle. As such it depends on the linewidth of the amide dip and also is easily influenced by nearby amines. The specificity of this method needs further evaluation through both simulations and phantom studies. Another method applying variable-delay multiple-pulses saturation (VDMP) was also developed to remove confounding factors, which also uses different DC (31,32). However, the underlying mechanism for these two methods are quite different: the VDMP produces the same direct saturation and MT effects through different delay times, while our proposed method produces the same direct saturation and MT effects through using the same average irradiation power. The lack of contrast between tumor and normal tissue at 3.5 ppm in Fig. 6g (p=0.38) and Fig. 7h support the previous results (11,30,33) that tumor/contralateral MTRasym contrast in a simple tumor model may be driven by T1, semi-solid MT, and rNOE, and not amide differences. Note that there have been differences in the CEST literature (6,30) concerning the relative protein (and hence amide) concentration in tumors. Also, while amide AREXdouble,vdc would be expected to be sensitive to changes in intracellular pH (20), these changes are much smaller than the well-known extracellular pH changes due to tumor acidosis (34–36). The different contrast for the MTRdouble,vdc and AREXdouble,vdc in tumors may be due to their sensitivities (or insensitivities) to T1 and semi-solid MT. The specificity in more realistic tumor models is an open question. The sensitivity of different APT methods is optimized with different sequence parameters, so it is difficult to compare their sensitivities with the parameters used in this paper.
On small animal system, B0 is homogenious and thus water saturation shift referencing (WASSR) was not applied (37). (Also, the relative robustness of AREXdouble,vdc under B0 inhomogeneities, as indicated by figure 8, makes correction rarely necessary.) Under other Bavg power, DC may be changed to satisfy the adiabatic condition according to Eq. (2) in our previous publication (18).
CONCLUSION
In this work, simulations at 9.4T using 1 µT irradiation show that conventionally measured APT contrast is influenced by other sample parameters and is not specific to amide-water exchange effects. Our proposed AREXdouble,vdc is insensitive to T1, T2, fm, MT asymmetry, and nearby amines, within the range of our simulated regime and, hence, is a good candidate for specific measures of amide-water exchange effects. The simulated effects are supported by experimental results on simple creatine, egg white, and glutamate phantoms. Results on a 9L tumor model suggest limited baseline contributions to AREXdouble,vdc and are consistent with a previous study indicating little contribution from amide exchange to APT contrast in this animal model.
Table 1.
list of sample parameters used in Fig. 5
| T1 (s) | T2 (ms) | fs | ksw (s−1) | |
|---|---|---|---|---|
| a | 0.71, 1.03, 1.27 | 53, 69, 94 | 0.0015, 0.0014, 0.0014 | 59, 50, 46 |
| b | 2.88, 2.72, 2.56, 2.88, 2.54 | 2040, 1873, 1725, 2044, 1654 | 0.0009, 0.0009, 0.0015, 0.0019, 0.0018 | 23, 38, 47, 49, 62 |
Acknowledgments
Grant Sponsor: R21 EB017873, R01 EB017767, R01 CA109106, K25 CA168936, and R01 CA184693
APPENDIX
A: Labeling efficiency
Labeling efficiency has been defined previously (17) to be the reduction in the ratio of the steady state solute spin magnetization under CW irradiation to the equilibrium solute spin magnetization. Here, we define the labeling efficiency under pulsed-irradiation to be the reduction in the ratio of the average of the steady state solute spin magnetization over a pulse repetition time (duration between two adjacent irradiations) to the equilibrium solute spin magnetization in a two pool model (solute and water), ignoring DS. Fig. A1 show the labeling efficiencies for reference and label scans under pulsed-irradiation vs. sequence parameters Bavg power and DC. While Bavg power = 1 µT was chosen due to exchange rate, semi-solid MT, and adiabaticity constraints, the DC were chosen to maximize ηπ−η2π. In this paper, we use DC of 70% for π pulse and DC of 30% for 2π pulse irradiation for all phantom and animal experiments. Using these parameters, ηπ−η2π is around 0.566.
FIG. A1.
Simulated labeling efficiency vs. Bavg power and DC.
B: Adiabatic condition
In a previous paper, we have shown that the adiabatic condition should be satisfied to remove the DS effect (8). The adiabatic condition can be quantified by λ. When λ >> 1, the adiabatic condition is satisfied. Fig. B1 plots the minimum λ during a Gaussian irradiation pulse. It decreases at higher Bavg power and lower DC. Specifically, the low λ values of the of the 2π pulse at 30% DC and high powers drives the deviation between Eq. 5 and Eq.6 plotted in Fig. 2. In addition, λ decreases at lower static field strength (8). In our simulations at 9.4 T and 7 T, the adiabatic condition is easily satisfied, but is likely to create significant power and DC constraints at 3 T.
FIG. B1.
Minimum λ during a Gaussian pulse as a function of applied Bavg power and DC at 3.5 ppm at 9.4 T, 7 T, and 3 T for π (a) and 2π (b) pulse irradiation
Footnotes
Publisher's Disclaimer: This is a PDF file of an unedited manuscript that has been accepted for publication. As a service to our customers we are providing this early version of the manuscript. The manuscript will undergo copyediting, typesetting, and review of the resulting proof before it is published in its final citable form. Please note that during the production process errors may be discovered which could affect the content, and all legal disclaimers that apply to the journal pertain.
References
- 1.Howe FA, Barton SJ, Cudlip SA, Stubbs M, Saunders DE, Murphy M, Wilkins P, Opstad KS, Doyle VL, McLean MA, Bell BA, Griffiths JR. Metabolic profiles of human brain tumors using quantitative in vivo H-1 magnetic resonance spectroscopy. Magnetic Resonance in Medicine. 2003;49(2):223–232. doi: 10.1002/mrm.10367. [DOI] [PubMed] [Google Scholar]
- 2.Behar KL, Ogino T. Assignment of Resonances in the H-1 Spectrum of Rat-Brain by 2-Dimensional Shift Correlated and J-Resolved Nmr-Spectroscopy. Magnetic Resonance in Medicine. 1991;17(2):285–303. doi: 10.1002/mrm.1910170202. [DOI] [PubMed] [Google Scholar]
- 3.Kauppinen RA, Kokko H, Williams SR. Detection of Mobile Proteins by Proton Nuclear-Magnetic-Resonance Spectroscopy in the Guinea-Pig Brain Exvivo and Their Partial-Purification. Journal of Neurochemistry. 1992;58(3):967–974. doi: 10.1111/j.1471-4159.1992.tb09350.x. [DOI] [PubMed] [Google Scholar]
- 4.Zhou JY, Wilson DA, Sun PZ, Klaus JA, van Zijl PCM. Quantitative description of proton exchange processes between water and endogenous and exogenous agents for WEX, CEST, and APT experiments. Magnetic Resonance in Medicine. 2004;51(5):945–952. doi: 10.1002/mrm.20048. [DOI] [PubMed] [Google Scholar]
- 5.Zhou JY, Lal B, Wilson DA, Laterra J, van Zijl PCM. Amide proton transfer (APT) contrast for imaging of brain tumors. Magnetic Resonance in Medicine. 2003;50(6):1120–1126. doi: 10.1002/mrm.10651. [DOI] [PubMed] [Google Scholar]
- 6.Zhou JY, Tryggestad E, Wen ZB, Lal B, Zhou TT, Grossman R, Wang SL, Yan K, Fu DX, Ford E, Tyler B, Blakeley J, Laterra J, van Zijl PCM. Differentiation between glioma and radiation necrosis using molecular magnetic resonance imaging of endogenous proteins and peptides. Nature Medicine. 2011;17(1):130–U308. doi: 10.1038/nm.2268. [DOI] [PMC free article] [PubMed] [Google Scholar]
- 7.Zu ZL, Janve VA, Li K, Does MD, Gore JC, Gochberg DF. Multi-angle ratiometric approach to measure chemical exchange in amide proton transfer imaging. Magnetic Resonance in Medicine. 2012;68(3):711–719. doi: 10.1002/mrm.23276. [DOI] [PMC free article] [PubMed] [Google Scholar]
- 8.Zu ZL, Janve VA, Xu JZ, Does MD, Gore JC, Gochberg DF. A new method for detecting exchanging amide protons using chemical exchange rotation transfer. Magnetic Resonance in Medicine. 2013;69(3):637–647. doi: 10.1002/mrm.24284. [DOI] [PMC free article] [PubMed] [Google Scholar]
- 9.Zhang XY, Wang F, Afzal A, Xu JZ, Gore JC, Gochberg DF, Zu ZL. A new NOE-mediated MT signal at around-1.6 ppm for detecting ischemic stroke in rat brain. Magnetic Resonance Imaging. 2016;34(8):1100–1106. doi: 10.1016/j.mri.2016.05.002. [DOI] [PMC free article] [PubMed] [Google Scholar]
- 10.Zhang XY, Wang FJT, Xu JZ, Xie JP, Gochberg DF, Gore JC, Zu ZL. MR imaging of a novel NOE-mediated magnetization transfer with water in rat brain at 9.4 T. Magnetic Resonance in Medicine. 2016 doi: 10.1002/mrm.26396. [DOI] [PMC free article] [PubMed] [Google Scholar]
- 11.Zhang XY, Wang F, Li H, Xu JZ, Gochberg DF, Gore JC, Zu ZL. Accuracy in the quantification of chemical exchange saturation transfer (CEST) and relayed nuclear Overhauser enhancement (rNOE) saturation transfer effects. Nmr in Biomedicine. 2017 doi: 10.1002/nbm.3716. [DOI] [PMC free article] [PubMed] [Google Scholar]
- 12.Jin T, Wang P, Zong XP, Kim SG. MR imaging of the amide-proton transfer effect and the pH-insensitive nuclear overhauser effect at 9.4 T. Magnetic Resonance in Medicine. 2013;69(3):760–770. doi: 10.1002/mrm.24315. [DOI] [PMC free article] [PubMed] [Google Scholar]
- 13.Scheidegger R, Vinogradov E, Alsop DC. Amide Proton Transfer Imaging With Improved Robustness to Magnetic Field Inhomogeneity and Magnetization Transfer Asymmetry Using Saturation With Frequency Alternating RF Irradiation. Magnetic Resonance in Medicine. 2011;66(5):1275–1285. doi: 10.1002/mrm.22912. [DOI] [PMC free article] [PubMed] [Google Scholar]
- 14.Zaiss M, Bachert P. Exchange-dependent relaxation in the rotating frame for slow and intermediate exchange - modeling off-resonant spin-lock and chemical exchange saturation transfer. Nmr in Biomedicine. 2013;26(5):507–518. doi: 10.1002/nbm.2887. [DOI] [PubMed] [Google Scholar]
- 15.Zaiss M, Xu JZ, Goerke S, Khan IS, Singer RJ, Gore JC, Gochberg DF, Bachert P. Inverse Z-spectrum analysis for spillover-, MT-, and T-1-corrected steady-state pulsed CEST-MRI - application to pH-weighted MRI of acute stroke. Nmr in Biomedicine. 2014;27(3):240–252. doi: 10.1002/nbm.3054. [DOI] [PMC free article] [PubMed] [Google Scholar]
- 16.Zu ZL, Xu JZ, Li H, Chekmenev EY, Quarles CC, Does MD, Gore JC, Gochberg DF. Imaging Amide Proton Transfer and Nuclear Overhauser Enhancement Using Chemical Exchange Rotation Transfer (CERT) Magnetic Resonance in Medicine. 2014;72(2):471–476. doi: 10.1002/mrm.24953. [DOI] [PMC free article] [PubMed] [Google Scholar]
- 17.Zhou JY, van Zijl PCM. Chemical exchange saturation transfer imaging and spectroscopy. Progress in Nuclear Magnetic Resonance Spectroscopy. 2006;48(2–3):109–136. [Google Scholar]
- 18.Zu ZL, Li K, Janve VA, Does MD, Gochberg DF. Optimizing Pulsed-Chemical Exchange Saturation Transfer Imaging Sequences. Magnetic Resonance in Medicine. 2011;66(4):1100–1108. doi: 10.1002/mrm.22884. [DOI] [PMC free article] [PubMed] [Google Scholar]
- 19.Goerke S, Zaiss M, Bachert P. Characterization of creatine guanidinium proton exchange by water-exchange (WEX) spectroscopy for absolute- pH CEST imaging in vitro. Nmr in Biomedicine. 2014;27(5):507–518. doi: 10.1002/nbm.3086. [DOI] [PubMed] [Google Scholar]
- 20.Zhou JY, Payen JF, Wilson DA, Traystman RJ, van Zijl PCM. Using the amide proton signals of intracellular proteins and peptides to detect pH effects in MRI. Nature Medicine. 2003;9(8):1085–1090. doi: 10.1038/nm907. [DOI] [PubMed] [Google Scholar]
- 21.Cai KJ, Haris M, Singh A, Kogan F, Greenberg JH, Hariharan H, Detre JA, Reddy R. Magnetic resonance imaging of glutamate. Nature Medicine. 2012;18(2):302–306. doi: 10.1038/nm.2615. [DOI] [PMC free article] [PubMed] [Google Scholar]
- 22.Gochberg DF, Gore JC. Quantitative imaging of magnetization transfer using an inversion recovery sequence. Magnetic resonance in medicine : official journal of the Society of Magnetic Resonance in Medicine/Society of Magnetic Resonance in Medicine. 2003;49(3):501–505. doi: 10.1002/mrm.10386. [DOI] [PubMed] [Google Scholar]
- 23.Li K, Zu Z, Xu J, Janve VA, Gore JC, Does MD, Gochberg DF. Optimized inversion recovery sequences for quantitative T1 and magnetization transfer imaging. Magnetic resonance in medicine : official journal of the Society of Magnetic Resonance in Medicine/Society of Magnetic Resonance in Medicine. 2010;64(2):491–500. doi: 10.1002/mrm.22440. [DOI] [PMC free article] [PubMed] [Google Scholar]
- 24.Zaiss M, Zu ZL, Xu JZ, Schuenke P, Gochberg DF, Gore JC, Ladd ME, Bachert P. A combined analytical solution for chemical exchange saturation transfer and semi-solid magnetization transfer. Nmr in Biomedicine. 2015;28(2):217–230. doi: 10.1002/nbm.3237. [DOI] [PMC free article] [PubMed] [Google Scholar]
- 25.Hua J, Jones CK, Blakeley J, Smith SA, van Zijl PCM, Zhou JY. Quantitative description of the asymmetry in magnetization transfer effects around the water resonance in the human brain. Magnetic Resonance in Medicine. 2007;58(4):786–793. doi: 10.1002/mrm.21387. [DOI] [PMC free article] [PubMed] [Google Scholar]
- 26.Sled JG, Pike GB. Quantitative interpretation of magnetization transfer in spoiled gradient echo MRI sequences. Journal of Magnetic Resonance. 2000;145(1):24–36. doi: 10.1006/jmre.2000.2059. [DOI] [PubMed] [Google Scholar]
- 27.Tozer D, Ramani A, Barker GJ, Davies GR, Miller DH, Tofts PS. Quantitative magnetization transfer mapping of bound protons in multiple sclerosis. Magnetic Resonance in Medicine. 2003;50(1):83–91. doi: 10.1002/mrm.10514. [DOI] [PubMed] [Google Scholar]
- 28.Morrison C, Stanisz G, Henkelman RM. Modeling Magnetization-Transfer for Biological-Like Systems Using a Semisolid Pool with a Super-Lorentzian Lineshape and Dipolar Reservoir. Journal of Magnetic Resonance Series B. 1995;108(2):103–113. doi: 10.1006/jmrb.1995.1111. [DOI] [PubMed] [Google Scholar]
- 29.Morrison C, Henkelman RM. A Model for Magnetization-Transfer in Tissues. Magnetic Resonance in Medicine. 1995;33(4):475–482. doi: 10.1002/mrm.1910330404. [DOI] [PubMed] [Google Scholar]
- 30.Xu JZ, Zaiss M, Zu ZL, Li H, Xie JP, Gochberg DF, Bachert P, Gore JC. On the origins of chemical exchange saturation transfer (CEST) contrast in tumors at 9.4 T. Nmr in Biomedicine. 2014;27(4):406–416. doi: 10.1002/nbm.3075. [DOI] [PMC free article] [PubMed] [Google Scholar]
- 31.Xu JD, Yadav NN, Bar-Shir A, Jones CK, Chan KWY, Zhang JY, Walczak P, McMahon MT, van Zijl PCM. Variable Delay Multi-Pulse Train for Fast Chemical Exchange Saturation Transfer and Relayed-Nuclear Overhauser Enhancement MRI. Magnetic Resonance in Medicine. 2014;71(5):1798–1812. doi: 10.1002/mrm.24850. [DOI] [PMC free article] [PubMed] [Google Scholar]
- 32.Xu X, Yadav NN, Zeng HF, Jones CK, Zhou JY, van Zijl PCM, Xu JD. Magnetization Transfer Contrast-Suppressed Imaging of Amide Proton Transfer and Relayed Nuclear Overhauser Enhancement Chemical Exchange Saturation Transfer Effects in the Human Brain at 7T. Magnetic Resonance in Medicine. 2016;75(1):88–96. doi: 10.1002/mrm.25990. [DOI] [PMC free article] [PubMed] [Google Scholar]
- 33.Scheidegger R, Wong ET, Alsop DC. Contributors to contrast between glioma and brain tissue in chemical exchange saturation transfer sensitive imaging at 3 Tesla. Neuroimage. 2014;99:256–268. doi: 10.1016/j.neuroimage.2014.05.036. [DOI] [PMC free article] [PubMed] [Google Scholar]
- 34.Chen LQ, Howison CM, Jeffery JJ, Robey IF, Kuo PH, Pagel MD. Evaluations of Extracellular pH within In Vivo Tumors Using acidoCEST MRI. Magnetic Resonance in Medicine. 2014;72(5):1408–1417. doi: 10.1002/mrm.25053. [DOI] [PMC free article] [PubMed] [Google Scholar]
- 35.Chen LQ, Randtke EA, Jones KM, Moon BF, Howison CM, Pagel MD. Evaluations of Tumor Acidosis Within In Vivo Tumor Models Using Parametric Maps Generated with AcidoCEST MRI. Molecular Imaging and Biology. 2015;17(4):488–496. doi: 10.1007/s11307-014-0816-2. [DOI] [PMC free article] [PubMed] [Google Scholar]
- 36.Zu ZL, Li H, Jiang XY, Gore JC. Spin-Lock Imaging of Exogenous Exchange-Based Contrast Agents to Assess Tissue pH. Magnetic Resonance in Medicine. 2017 doi: 10.1002/mrm.26681. [DOI] [PMC free article] [PubMed] [Google Scholar]
- 37.Kim M, Gillen J, Landman BA, Zhou JY, van Zijl PCM. Water Saturation Shift Referencing (WASSR) for Chemical Exchange Saturation Transfer (CEST) Experiments. Magnetic Resonance in Medicine. 2009;61(6):1441–1450. doi: 10.1002/mrm.21873. [DOI] [PMC free article] [PubMed] [Google Scholar]


