Abstract
N-formylated sugars are found on the lipopolysaccharides of various pathogenic Gram negative bacteria including Campylobacter jejuni 81116, Francisella tularensis, Providencia alcalifaciens O30, and Providencia alcalifaciens O40. The last step in the biosynthetic pathways for these unusual sugars is catalyzed by N-formyltransferases that utilize N10-formyltetrahydrofolate as the carbon source. The substrates are dTDP-linked amino sugars with the functional groups installed at either the C-3′ or C-4′ positions of the pyranosyl rings. Here we describe a structural and enzymological investigation of the putative N-formyltransferase, FdtF, from Salmonella enterica O60. In keeping with its proposed role in the organism, the kinetic data reveal that the enzyme is more active with dTDP-3-amino-3,6-dideoxy-D-galactose than with dTDP-3-amino-3,6-dideoxy-D-glucose. The structural data demonstrate that the enzyme contains, in addition to the canonical N-formyltransferase fold, an ankyrin repeat moiety that houses a second dTDP-sugar binding pocket. This is only the second time an ankyrin repeat has been shown to be involved in small molecule binding. The research described herein represents the first structural analysis of a sugar N-formyltransferase that specifically functions on dTDP-3-amino-3,6-dideoxy-D-galactose in vivo and thus adds to our understanding of these intriguing enzymes.
Keywords: ankyrin repeat, dTDP-3-formamido-3, 6-dideoxy-D-galactose, lipopolysaccharide, O-antigen, N-formyltransferase, N10-formyltetrahydrofolate
1. Introduction
Salmonella enterica, a Gram-negative facultative intracellular organism, is a leading cause of food poisoning worldwide. According to the Centers for Disease Control and Prevention, it is estimated that ~1.2 million people are infected in the United States each year by nontyphoidal Salmonella species, resulting in ~450 deaths. Whereas most people recover within four to seven days, some require hospitalization due to severe diarrhea and the spread of the bacterium from the intestines to the blood stream. The young, the elderly, and those who are immunocompromised are particularly susceptible to complications.
Salmonella species are zoonotic and are found in the intestinal tracts of cattle, pigs, and chickens, amongst others (Hale et al., 2012). In 2016, alone, numerous Salmonella outbreaks occurred due to the contamination of dairy bull calves, eggs, alfalfa sprouts, poultry, and pistachios (https://www.cdc.gov/salmonella/outbreaks.html). In addition to the human toll, the economic losses due to Salmonella can be devastating (Hussain and Dawson, 2013).
Like most Gram-negative bacteria, S. enterica strains contain a complex glycoconjugate referred to as the lipopolysaccharide or LPS. It generally consists of three components: (1) the lipid A, which anchors the complex lipoglycan into the outer membrane, (2) the core oligosaccharide, and (3) the O-antigen, which often contains unusual dideoxysugars (Liu et al., 2014; Raetz and Whitfield, 2002). There is growing evidence that some O-antigens may play a role in bacterial virulence (Liu et al., 2014).
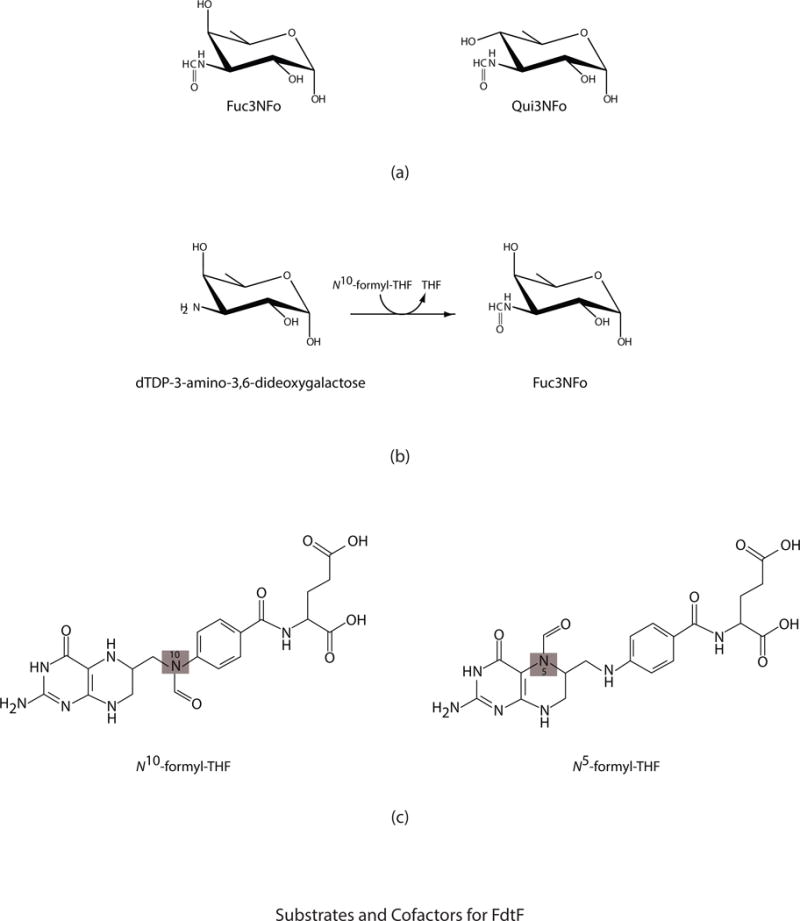
Over 2,600 serovars of S. enterica, belonging to six subspecies, have been identified thus far (Shi et al., 2015). Relevant to the research reported here is the characterization of the O-antigen from S. enterica O60, which contains an unusual N-formylated sugar, 3-formamido-3,6-dideoxygalactose, hereafter referred to as Fuc3NFo (Perepelov et al., 2010). Depicted in Scheme 1a are the chemical structures of this unique sugar, as well as that of 3-formamido-3,6-dideoxyglucose, abbreviated as Qui3NFo.
The genes encoding the enzymes required for the biosynthesis of N-formylated sugars are generally located within clusters, as in the case of S. enterica O60 (Perepelov et al., 2010). Typically, the last enzymes in the pathways function as N-formyltransferases that utilize N10-formyltetrahydrofolate (N10-formyl-THF) as the source of the formyl group (Scheme 1b,c). In S. enterica O60, the putative N-formyltransferase is thought to be encoded by the fdtF gene, although the biochemical activity of the gene product has not yet been confirmed (Perepelov et al., 2010).
In recent years, it has become apparent that N-formylated sugars, such as Fuc3NFo are more common than originally thought (Holden et al., 2016). Interestingly, they tend to be found in the O-antigens of such pathogenic organisms as Brucella abortus, Providencia alcalifaciens O40, Francisella tularensis, and Campylobacter jejuni (Ovchinnikova et al., 2012; Thoden et al., 2013; Wu and Mackenzie, 1987; Zimmer et al., 2014).
Since 2013, the three-dimensional structures of four sugar N-formyltransferases have been reported from this laboratory (Genthe et al., 2015; Thoden et al., 2013; Woodford et al., 2015; Zimmer et al., 2014). Two of these enzymes act upon dTDP-3-amino-3,6-dideoxyglucose (dTDP-Qui3N) whereas the other two utilize dTDP-4-amino-4,6-dideoxyglucose as a substrate (dTDP-Qui4N). Members in each class function as dimers, but adopt decidedly different quaternary structures.
Here we report the three-dimensional architecture of FdtF from S. enterica O60. For this investigation, five X-ray structures were determined to resolutions of 2.2 Å or better. In addition, relevant kinetic parameters were measured. This investigation represents the first X-ray analysis of a sugar N-formyltransferase that specifically functions in vivo on dTDP-Fuc3N and as such provides new detail into this fascinating enzyme family.
2. Materials and methods
2.1 Protein expression and purification
The fdtF gene (S. enterica, strain G1464, serogroup O60), synthesized by DNA2.0 using optimized Escherichia coli codons, served as the template for all of the required cloning experiments. The final clone utilized in expression experiments was placed into the pET28(b) vector (Novagen), leading to a protein with an N-terminal polyhistidine tag before the first methionine with the following sequence: MGSSHHHHHHSSENLYFQGGGGGGH.
The pET28(b)-fdtF plasmid was used to transform Rosetta2(DE3) E. coli cells (Novagen). The cultures were grown in lysogeny broth supplemented with kanamycin and chloramphenicol (both at 50 mg/L concentration) at 37°C with shaking until an optical density of 0.8 was reached at 600 nm. The flasks were cooled in an ice bath, and the cells were induced with 1 mM isopropyl β-D-1-thiogalactopyranoside and allowed to express protein at 16°C for 24 hours.
The cells were harvested by centrifugation and frozen as pellets in liquid nitrogen. Frozen cell pellets were disrupted by sonication on ice in a lysis buffer composed of 50 mM sodium phosphate, 20 mM imidazole, 10% glycerol, and 600 mM sodium chloride (pH 8.0). The lysate was cleared by centrifugation, and FdtF was purified at room temperature utilizing Ni-NTA resin (Qiagen) according to the manufacturer’s instructions. All buffers were adjusted to pH 8.0 and contained 50 mM sodium phosphate, 600 mM sodium chloride, and imidazole concentrations of 20 mM for the wash buffer and 300 mM for the elution buffer. TEV protease was added in a 1:10 molar ratio to the pooled protein solution, which was subsequently dialyzed against 50 mM sodium phosphate, 600 mM sodium chloride, and 20 imidazole (pH 8.0) at room temperature for 18 hours. Both the TEV protease and uncleaved protein were removed by passage over a Ni-NTA column. The cleaved protein was collected and dialyzed against 10 mM Tris-HCl (pH 8.0) and 600 mM NaCl and concentrated to ~2.5 mg/mL based on an extinction coefficient of 0.78 (mg/mL)−1cm−1. It was not possible to concentrate FdtF to a higher level because of protein precipitation.
2.2 Crystallizations
Crystallization conditions for FdtF were surveyed by the hanging drop method of vapor diffusion using a sparse matrix screen developed in the Holden laboratory. The enzyme was initially tested either in the absence of any ligands or in the presence of 10 mM dTDP and 5 mM N5-formyl-tetrahydrofolate (abbreviated as N5-formyl-THF). N5-formyl-THF is a stable but non-catalytically competent cofactor. Diamond shaped crystals formed throughout the screen within the pH range of 5.0 to 9.0. These crystals belonged to the triclinic space group P1 with unit cell dimensions of a = 77.4 Å, b = 84.4 Å, c = 103.1 Å, α = 103.3°, β = 91.0°, and γ = 109.6°. The asymmetric unit contained two dimers. Unfortunately, the crystals diffracted weakly to about 3 Å resolution. It was still possible, however, to solve the structure of FdtF via molecular replacement with the software package PHASER and using as a search model the X-ray coordinates for QdtF (PDB entry 4XCZ) (McCoy et al., 2007; Woodford et al., 2015). On the basis of the observed crystal contacts for this model, four site-directed surface mutant variants were constructed using the Stratagene QuikChange method. The specific mutations were: Y281A, E318A, Y354A, and E395A. Of these four, only the E395A mutation led to a protein that was more stable than the wild-type enzyme.
The E395A protein was expressed and purified in the same manner as that described for the wild-type enzyme. It was concentrated to ~7 mg/mL, and potential crystallization conditions were surveyed as described above. Crystals of the mutant variant in complex with dTDP grew from 15–18% poly(ethylene glycol) 3350 solutions buffered with 100 mM MOPS at pH 7.0. They were prepared for X-ray data collection by transfer to a cryo-protectant solution composed of 25% poly(ethylene glycol) 3350, 700 mM NaCl, 10 mM dTDP, 5 mM N5-formyl-THF, 10% ethylene glycol, and 100 mM MOPS (pH 7.0).
Crystals of the enzyme in complex with N5-formyl-THF and dTDP-Fuc3N were prepared using precipitant solutions composed of 12–16% poly(ethylene glycol) 5000, 200 mM tetramethylammonium chloride (N(CH3)4Cl), and 100 mM CHES (pH 9.0). The protein solution contained 10 mM N5-formyl-THF and 10 mM dTDP-Fuc3N. The crystals were prepared for X-ray data collection by transferring them to a solution composed of 22% poly(ethylene glycol) 5000, 700 mM NaCl, 300 mM N(CH3)4Cl, 10 mM dTDP-Fuc3N, 5 mM N5-formyl-THF, 13% ethylene glycol, and 100 mM CHES (pH 9.0). All of the required dTDP-sugar ligands such as dTDP-Fuc3N were prepared as previously described (Woodford et al., 2015).
Soaking these crystals in a solution composed of 5 mM dTDP-Fuc3N and 5 mM N10-formyl-THF, followed by cryo-protection in 22% poly(ethylene glycol) 5000, 700 mM NaCl, 300 mM N(CH3)4Cl, 10 mM dTDP-Fuc3N, 5 mM N10-formyl-THF, 13% ethylene glycol, and 100 mM CHES led to the isolation of the protein in complex with dTDP-Fuc3N and THF.
Crystals of the enzyme with bound dTDP-Qui3N and N5-formyl-THF were prepared under the same conditions as those described for the dTDP-Fuc3N/N5-formyl-THF/protein complex with the substitution of dTDP-Qui3N for dTDP-Fuc3N.
Crystals of the W305A/E395A mutant variant were grown with the addition of 5 mM dTDP and 5 mM N5-formyl-THF to the protein solution and using precipitant solutions composed of 13–16% poly(ethylene glycol) 3350, 200 mL LiCl, and 100 mM MOPS at pH 7.0. They were cryo-protected by transfer to a solution composed of 24% poly(ethylene glycol) 3350, 700 mM NaCl, 300 mM LiCl, 10 mM dTDP, 5 mM N5-formyl-THF, 10% ethylene glycol, and 100 mM MOPS (pH 7.0).
2.3 X-ray data collection, processing and structural analyses
All of the X-ray data sets were collected in house with a Bruker AXS Platinum-135 CCD detector controlled with the PROTEUM software suite (Bruker AXS Inc.) The X-ray source was Cu Kα radiation from a Rigaku RU200 X-ray generator equipped with Montel optics and operated at 50 kV and 90 mA. The X-ray data sets were processed with SAINT and scaled with SADABS (Bruker AXS Inc.). Relevant X-ray data collection statistics are listed in Table 1.
Table 1.
X-ray data collection statistics.
| dTDP | dTDP-Fuc3N/N5-formyl-THF | dTDP-Fuc3N/THF | dTDP-Qui3N/N5-formyl-THF | W305A mutant variant | ||
|---|---|---|---|---|---|---|
| resolution limits (Å) | 50–1.9 (2.0–1.9)b | 50–2.2 (2.3–2.2)b | 50–2.2 (2.3–2.2)b | 50–2.2 (2.3–2.2)b | 50–2.2 (2.3–2.2)b | |
| space group | P21 | P212121 | P212121 | P21 | P21 | |
| unit cell | ||||||
| a | α | 73.9 | 66.2 | 68.7 | 71.2 | 72.5 |
| b | β | 64.8 90.5 | 69.2 | 72.8 | 58.4 96.0 | 59.5 96.3 |
| c | γ | 97.8 | 200.6 | 191.7 | 106.8 | 107.6 |
| number of independent reflections | 70013 (9252) | 46716 (5541) | 46550 (4899) | 42547 (4812) | 45968 (5534) | |
| completeness (%) | 95.6 (87.2) | 97.2 (91.3) | 93.6 (80.6) | 95.2(86.6) | 98.7 (96.6) | |
| redundancy | 3.7 (1.8) | 4.1 (2.3) | 3.1 (1.6) | 3.7 (1.7) | 4.1 (2.4) | |
| avg I/avg σ(I) | 12.6 (2.5) | 7.9 (2.0) | 7.3 (1.9) | 9.3 (1.9) | 9.1 (2.8) | |
| Rsym(%)a | 6.3 (27.8) | 9.5 (36.4) | 9.9 (32.1) | 8.4 (29.5) | 9.5 (26.4) | |
.
Statistics for the highest resolution bin.
All structures of the E395A mutant variants were solved via molecular replacement with the software package PHASER using as a search probe the FdtF coordinates determined at 3.0 Å resolution. Iterative cycles of model-building with COOT (Emsley and Cowtan, 2004; Emsley et al., 2010) and refinement with REFMAC (Murshudov et al., 1997) were employed to produce the final X-ray coordinate files. Model refinement statistics are provided in Table 2.
Table 2.
Refinement statistics.
| dTDP | dTDP-Fuc3N/N5-formyl-THF | dTDP-Fuc3N/THF | dTDP-Qui3N/N5-formyl-THF | W305A mutant variant | |
|---|---|---|---|---|---|
| resolution limits (Å) | 50–1.9 | 50–2.2 | 50–2.2 | 50–2.2 | 50.0–2.2 |
| a R - factor (overall)%/no. reflections | 18.3/69999 | 20.9/46658 | 20.6/36515 | 19.8/42539 | 19.1/45956 |
| R - factor (working)%/no. reflections | 18.2/66447 | 20.6/44292 | 20.2/44148 | 19.5/40390 | 18.8/43635 |
| R - factor (free)%/no. reflections | 23.1/3552 | 27.0/2366 | 27.0/2367 | 26.4/2149 | 25.2/2321 |
| number of protein atoms | 6472 | 6471 | 6476 | 6479 | 6462 |
| number of heteroatoms | 664 | 486 | 524 | 399 | 481 |
| average B values | |||||
| protein atoms (Å2) | 25.9 | 28.9 | 25.8 | 32.3 | 21.1 |
| ligand (Å2) | 30.1 | 30.3 | 27.5 | 32.5 | 32.7 |
| solvent (Å2) | 28.9 | 24.4 | 20.1 | 27.7 | 22.1 |
| weighted RMS deviations from ideality | |||||
| bond lengths (Å) | 0.011 | 0.013 | 0.012 | 0.013 | 0.011 |
| bond angles ( ) | 2.0 | 1.7 | 1.7 | 1.7 | 1.9 |
| planar groups (Å) | 0.008 | 0.006 | 0.006 | 0.007 | 0.005 |
| Ramachandran regions (%)b | |||||
| most favored | 88.5 | 89.0 | 88.5 | 87.7 | 89.9 |
| additionally allowed | 10.9 | 10.3 | 10.7 | 12.0 | 9.9 |
| generously allowed | 0.6 | 0.7 | 0.8 | 0.3 | 0.2 |
R-factor = (Σ|Fo - Fc | / Σ|Fo |) × 100 where Fo is the observed structure-factor amplitude and Fc is the calculated structure-factor amplitude.
Distribution of Ramachandran angles according to PROCHECK.(Laskowski et al., 1993)
2.4 Kinetic analyses
Kinetic parameters for FdtF and its mutant variants were determined via a discontinuous assay using an ÄKTA Purifier HPLC system. Reaction rates were determined by measuring the amount of N-formylated product formed on the basis of peak area as monitored at 267 nm. Concentration was determined from the peak area via a calibration curve with standard samples that had been treated in the same manner as the reaction time points. The 1 mL reaction mixtures contained 5 mM N10-formyl-THF, 50 mM HEPPS (pH 8.0), 0.20 μM enzyme (wild-type or E395A) or 0.40 μM enzyme (W305A/E395A), and dTDP-sugar concentrations ranging from 0.0075 mM -4.0 mM. Four 250 μL aliquots were taken over 3 minutes, and the reaction aliquots quenched by addition of 12 μL of 6 M HCl. Following addition of 200 μL of carbon tetrachloride and vigorous mixing, the samples were spun at 14000 × g for 1 minute and 200 μL of the aqueous phase removed for HPLC analysis. The samples were diluted with 2 mL water and loaded onto a 1 mL Resource-Q column. Products were quantified after elution with an 8-column volume gradient from 0 – 400 mM LiCl (pH 4.0, HCl). Plots of initial velocities versus concentrations were analyzed using PRISM (GraphPad Software, Inc.) and fit to the equation vo = (Vmax[S])/(Km + [S]). Kinetic parameters are listed in Table 3.
Table 3.
Kinetic parameters.
| enzyme/substrate | Km(mM) | kcat(s−1) | kcat/Km (M−1 s−1) |
|---|---|---|---|
| WT/dTDP-Fuc3N | 0.10 ± 0.01 | 15.5 ± 0.8 | 1.6 × 10⁵ ± 1.8 × 10⁴ |
| E395A/dTDP-Fuc3N | 0.11 ± 0.01 | 15.8 ± 0.9 | 1.4 × 10⁵ ± 1.5 × 10⁴ |
| E395A/dTDP-Qui3N | 0.18 ± 0.02 | 2.8 ± 0.3 | 1.6 × 10⁴ ± 2.4 × 10³ |
| W305A/E395A/dTDP-Fuc3N | 0.51 ± 0.07 | 0.95 ± 0.08 | 1.9 × 10³ ± 3.0 × 10² |
| W305A/E395A/dTDP-Qui3N | 0.45 ± 0.04 | 0.24 ± 0.04 | 5.3 × 10² ± 1.0 × 10² |
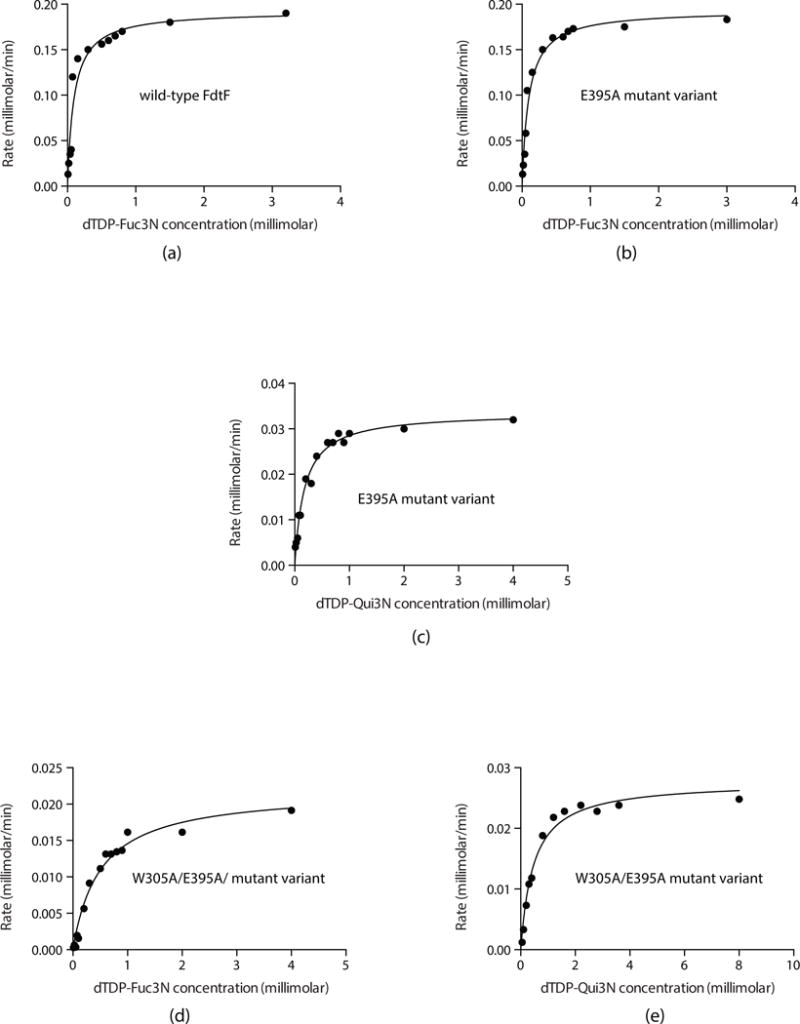
In presenting the data as we do, we are adhering to standard conventions in enzymology. Measuring velocities over a wide range of substrate concentrations allows us to obtain data that define both kcat and kcat/Km well, which is not accomplished by measuring replicates at fewer different concentrations. The graphs shown in Figure 7 allow for a qualitative appreciation of the quality of the data; the quantitative goodness-of-fit to the Michaelis-Menten equation is given by the standard errors, as listed in Table 3.
Fig. 7.
Initial velocities experiments. Shown are plots of the initial velocities of wild-type FdtF (a) and the E395A mutant variant (b) versus dTDP-Fuc3N concentrations. Plot of initial velocity of the E395A mutant variant against dTDP-Qui3N is shown in (c). Finally, plots of the initial velocities of the W305A/E395A mutant variant against either dTDP-Fuc3N or dTDP-Qui3N are presented in (d) and (e), respectively. Note that the graphs presented have different y-axis scales.
Results
3.1 Structure of the FdtF/dTDP complex
The first structure determined for FdtF used crystals that belonged to the P1 space group and that contained two dimers in the asymmetric unit. The crystals only diffracted to a nominal resolution of 3 Å. It was possible, however, to obtain a preliminary model of FdtF from these crystals using molecular replacement, but the quality of the X-ray data was not sufficient for our purposes. On the basis of crystal packing considerations, several site-directed mutant proteins were constructed in an attempt to improve crystal quality. Of the four mutant variants purified, only the E395A mutation resulted in a protein that was more stable than the wild-type enzyme and that led to crystals which diffracted to sufficiently high enough resolution. The E395A mutation resides at the end of the last helix in the protein, far from the active site of FdtF. All of the following discussion thus refers to the E395A variant.
The structural determination of the enzyme with bound dTDP employed crystals belonging to the space group P21 with one dimer in the asymmetric unit. The model was refined to 1.9 Å resolution with an overall R-factor of 18.3%. The polypeptide chains for subunits 1 and 2 extended from Met 1 to Lys 398 and Met 1 to Met 397, respectively. There were no disordered surface loops in either subunit. The α-carbons for the two subunits superimpose with a root-mean-square deviation of 0.5 Å.
Shown in Fig. 1a is a ribbon representation of subunit 2. Also shown are the electron densities corresponding to the bound dTDP ligands. Pro 99 adopts the cis conformation. It is located at ~14 Å from the active site. The N-terminal domain, delineated by Met 1 to Lys 225, folds into a six-stranded mixed β-sheet flanked on one side by mostly random coil and on the other side by three α-helices. One of these helices is quite long (Ala 148 to Leu 171), albeit its hydrogen bonding pattern is disrupted by Asn 166, which adopts ϕ,ψ values of −119° and −6°, respectively. The active site of FdtF is housed completely within the N-terminal domain. Immediately following the N-terminal region is a middle domain (Leu 226 – Asp 270) composed of four β-strands running anti-parallel to one another. The C-terminal domain, formed by Asn 271 to Met 397, contains four ankyrin repeats with a second dTDP binding pocket positioned between the second and third motifs. The active site and the auxiliary dTDP binding pockets are separated by ~25 Å.
Fig. 1.
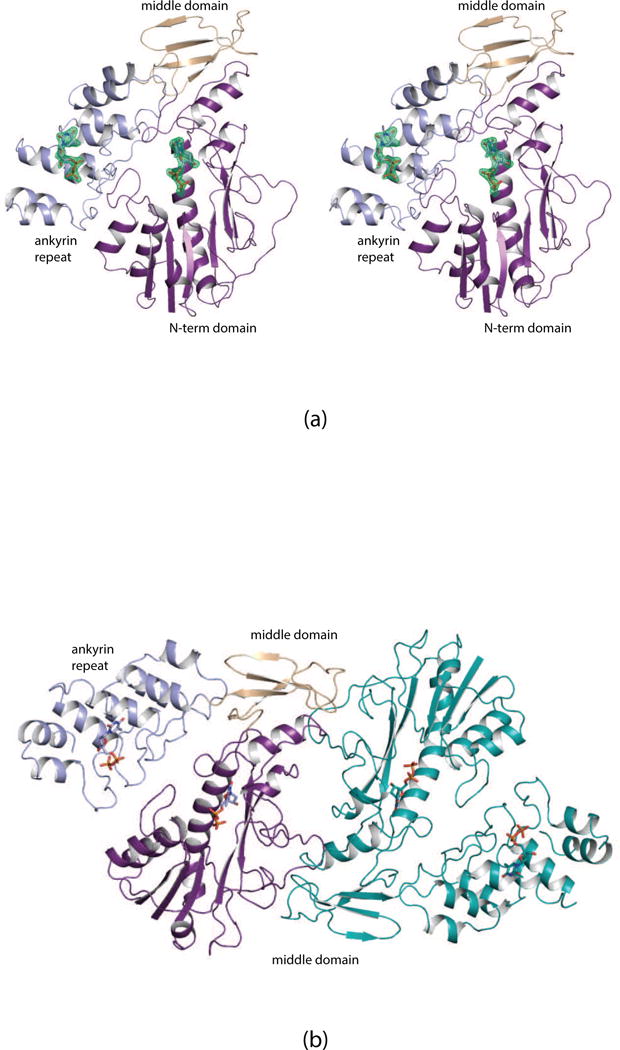
Overall structure of FdtF. A ribbon representation of the FdtF subunit is presented in stereo in (a). The N-terminal and middle domains are highlighted in violet and wheat, respectively. The ankyrin repeat is displayed in light blue. The electron densities shown were calculated with (Fo-Fc) coefficients and contoured at 3σ. The ligands were not included in the X-ray coordinate file used to calculate the omit map, and thus there is no model bias. The FdtF dimer, shown in a ribbon representation, is displayed in (b). The subunit:subunit interface lies between the N-terminal and middle domains. All figures were prepared with the software package PyMOL (DeLano, 2002).
A ribbon representation of the FdtF dimer is displayed in Fig. 1b. It has overall dimensions of ~90 Å X 55 Å X 120 Å. The buried surface area is ~2600 Å2 and is formed by residues located within the N-terminal and middle domains. As can be seen, the ankyrin repeats splay away from the main body of the molecule.
A close-up stereo view of the FdtF active site with bound dTDP is depicted in Fig. 2a. The thymine ring of the dTDP ligand is sandwiched between the side chains of Tyr 195 and Tyr 221 via parallel stacking interactions. In addition, the carboxamide group of Gln 222 and a water molecule lie within 3.2 Å of the thymine ring. The ribose, which adopts the C′-3 endo pucker, is surrounded by the side chain of Ser 107, which adopts two alternative conformations and an ordered water molecule. The side chains of Lys 8, Glu 75, Tyr 152, and Tyr 221 and four water molecules interact with the phosphoryl oxygens of the ligand. The close approach of the Glu 75 side chain to a phosphoryl oxygen (~2.3 Å) suggests that it is protonated. The crystals were grown at pH 7.0. Interestingly, there are no polypeptide chain backbone atoms that lie within 3.2 Å of the dTDP ligand.
Fig. 2.
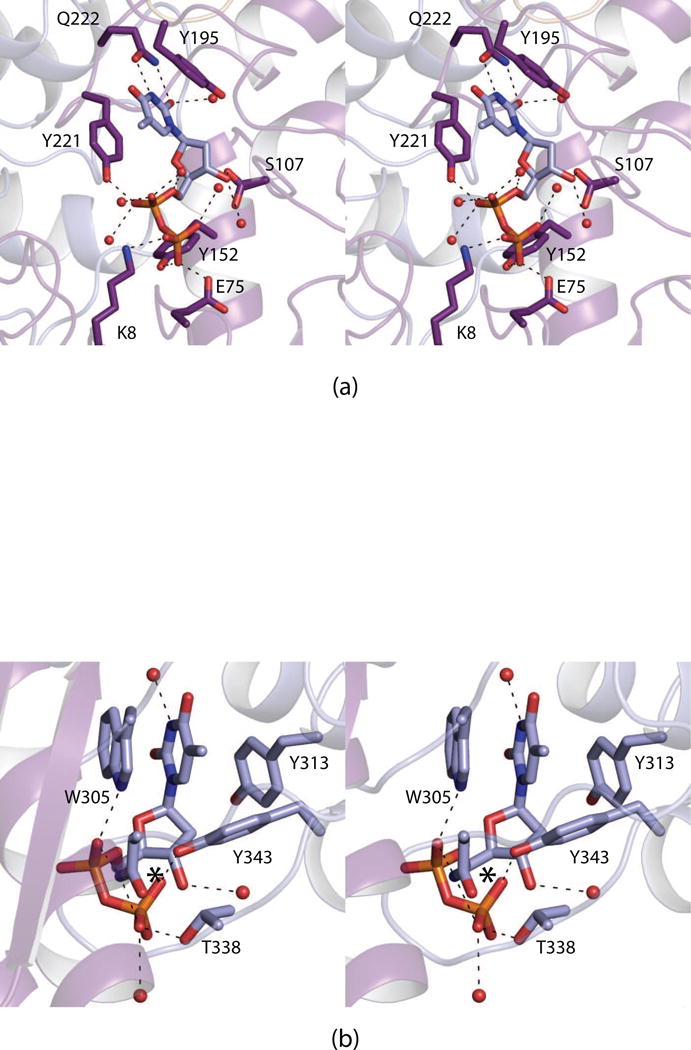
Close-up stereo views of the dTDP ligand binding pockets. Shown in (a) and (b) are the protein regions surrounding the ligands in the active site and the auxiliary binding pockets, respectively. Ordered water molecules are represented by the red spheres. Possible hydrogen bonding interactions are indicated by the dashed lines. It was not possible to place a label for Asn 334 in (b) without obscuring its side chain position or the position of β-phosphoryl group of the ligand. Thus, for the sake of clarity, the position of Asn 334 is marked by an asterisk.
Shown in Fig. 2b is the protein region harboring the auxiliary binding pocket. The dTDP molecule adopts a more curved conformation than that observed for the active site ligand. Again, there are no polypeptide chain backbone atoms lying within 3.2 Å of the ligand. The ribose assumes the C′-3 endo pucker. The aromatic side chains of Trp 305 and Tyr 313 abut either side of the thymine ring and the indole nitrogen of Trp 305 participates in a hydrogen bonding interaction an α-phosphoryl oxygen. The side chains of Thr 338 and Tyr 343 interact with β-phosphoryl oxygens whereas the side chain of Asn 334 serves as a bridge between the α- and β-phosphoryl groups. Three water molecules hydrogen bond to the ligand.
3.2 Structure of the FdtF/dTDP-Fuc3N/N5-formyl-THF ternary complex
The crystals employed for the analysis of the ternary complex of FdtF with bound dTDP-Fuc3N and N5-formyl-THF belonged to the space group P212121 and contained a dimer in the asymmetric unit. The model was refined to 2.2 Å resolution with an overall R-factor of 20.5%. Shown in Fig. 3a and 3b are the observed electron densities in subunit 1 that correspond to the ligands in the active site and the auxiliary binding pocket, respectively. The α-carbons for FdtF with either bound dTDP or dTDP-Fuc3N/N5-formyl-THF superimpose with a root-mean-square deviation of 0.6 Å, indicating that no major structural changes occur upon formation of the ternary complex.
Fig. 3.
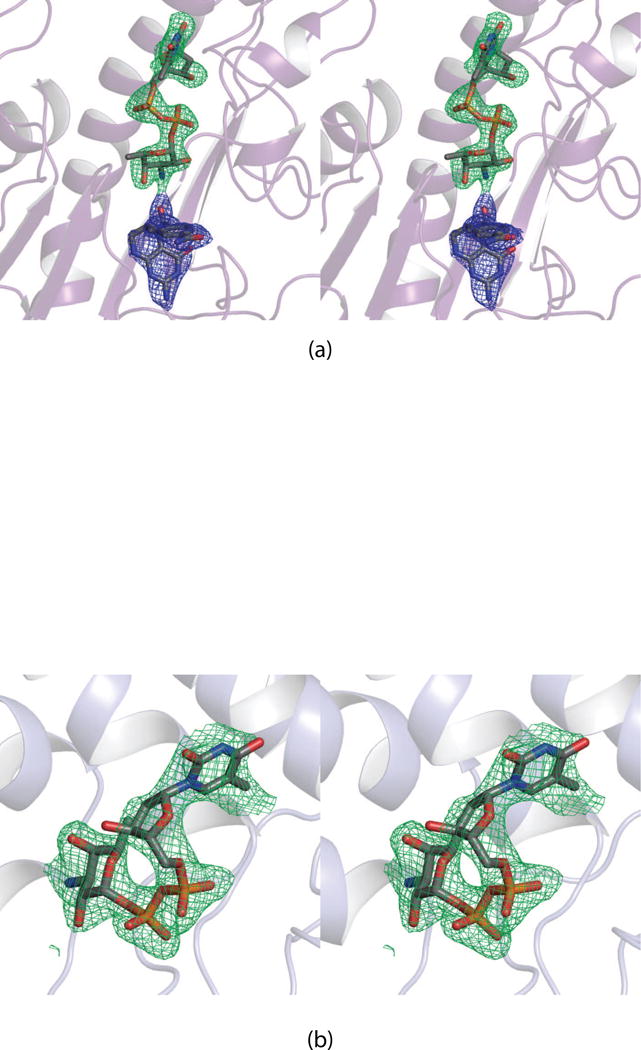
Electron densities corresponding to the bound ligands. The electron densities corresponding to the bound dTDP-Fuc3N (green) and N5-formyl-THF (blue) ligands in the active site are displayed in (a). The electron density for the dTDP-Fuc3N ligand located in the auxiliary binding pocket is presented in (b). The electron density maps were calculated with (Fo -Fc) coefficients and contoured at 3σ. The ligands were not included in the X-ray coordinate file used to calculate the omit map, and thus there is no model bias.
A close-up stereo view of the active site is shown in Fig. 4a. The N5-formyl-THF cofactor is anchored into the active site via hydrogen bonding interactions with the backbone amide nitrogen of Asp 130 and the carbonyl oxygens of Lys 22, Val 80, Asp 126, and Gly 128. With respect to the dTDP-sugar ligand, the β-phosphoryl group shifts in the active site by ~3 Å such that it lies within 3.2 Å of the backbone amide group of Tyr 105. Strikingly, the pyranosyl group of the dTDP-sugar does not interact with side chains but rather is positioned into the active site via hydrogen bonds with the backbone carbonyl groups of Phe 76 and Gly 103. The hexose adopts the 4C1 chair conformation.
Fig. 4.
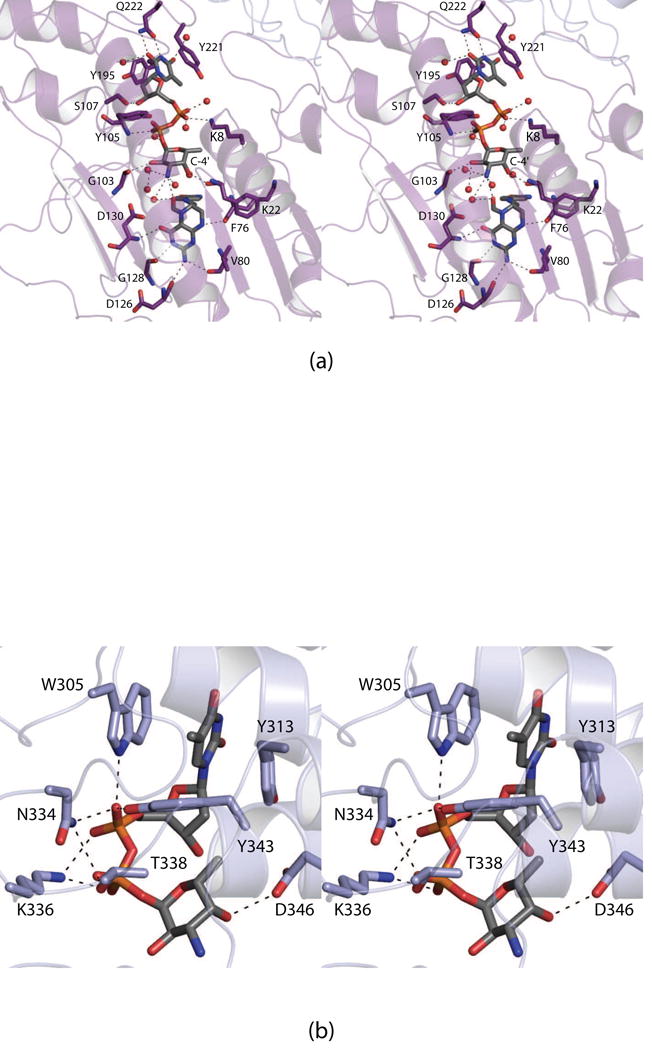
Close-up stereo views of the ligand binding pockets in the FdtF/dTDP-Fuc3N/N5-formyl-THF ternary complex. Shown in (a) and (b) are the active site and the auxiliary binding pocket regions, respectively. Ordered water molecules are represented by the red spheres. Possible hydrogen bonding interactions are indicated by the dashed lines.
Shown in Fig. 4b is a close-up stereo view of the dTDP-sugar ligand bound in the auxiliary binding pocket. Again, the ligand adopts a decidedly curved conformation and is positioned into the active site by the side chains of Trp 305, Tyr 313, Asn 334, Lys 336, Thr 338, Tyr 343, and Asp 346.
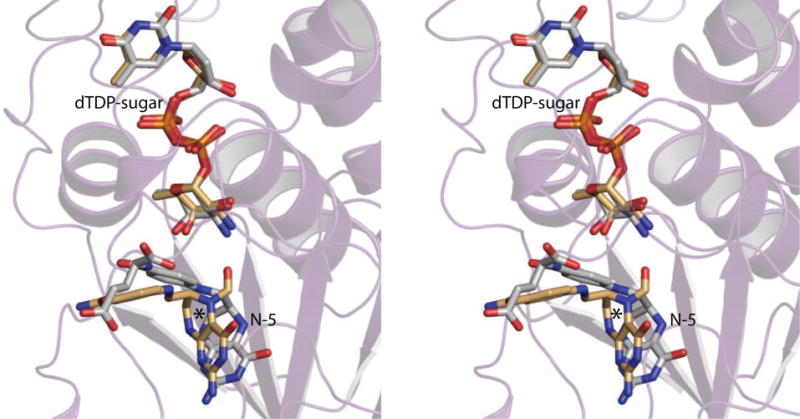
N5-formyl-THF is not a catalytically competent cofactor, but is utilized in structural studies of N-formyltransferases because it is stable. Curious as to the manner in which FdtF accommodates N10-formyl-THF, experiments were designed to introduce it into the crystalline lattice. Specifically, the crystals grown from dTDP-Fuc3N and N5-formyl-THF were soaked in solutions containing 5 mM dTDP-Fuc3N and 5 mM N10-formyl-THF, and X-ray data sets were collected to 2.2 Å resolution. In all attempts, however, only dTDP-Fuc3N and THF were observed in the electron density maps. Regardless, the FdtF/dTDP-Fuc3N/THF model revealed that there is a significant change in the position of the cofactor when THF is bound. Specifically, the N5 atom in THF shifts in the active site by ~2.6 Å (Fig. 5). Overall, however, the two models, with either bound N5-formyl-THF or THF, are similar such that their α-carbons superimpose with a root-mean-square deviation of ~0.4 Å.
Fig. 5.
Comparison of the binding of N5-formyl-THF versus THF. Shown in stereo is a superposition of the observed binding locations for the ligands in the FdtF/ dTDP-Fuc3N/N5-formyl-THF and FdtF/dTDP-Fuc3N/THF ternary complexes. The N5-formyl-THF and THF cofactors are depicted in gold and white bonds, respectively. The location of N5 in the N5-formyl-THF ligand is indicated by the asterisk.
3.3 Structure of the FdtF/dTDP-Qui3N/N5 -formyl-THF ternary complex
Given the lack of interactions between FdtF and the C-4′ hydroxyl group of the hexose (Fig. 4a), we thought that FdtF might also bind dTDP-Qui3N. The structure of the enzyme/dTDP-Qui3N/N5-formyl-THF ternary complex was subsequently determined to 2.2 Å resolution, and the model was refined to an overall R-factor of 19.8%. The electron density for the dTDP-Qui3N ligand in subunit 1 was well defined, whereas in subunit 2 only dTDP could be modeled. There was no electron density corresponding to the cofactor in subunit 1 but there was density for it in subunit 2. Well-defined electron densities for the dTDP-Qui3N ligands in both auxiliary binding pockets of the dimer were observed. The two FdtF ternary complex models, with either bound dTDP-Fuc3N or dTDP-Qui3N, superimpose with a root-mean-square deviation of 0.6 Å.
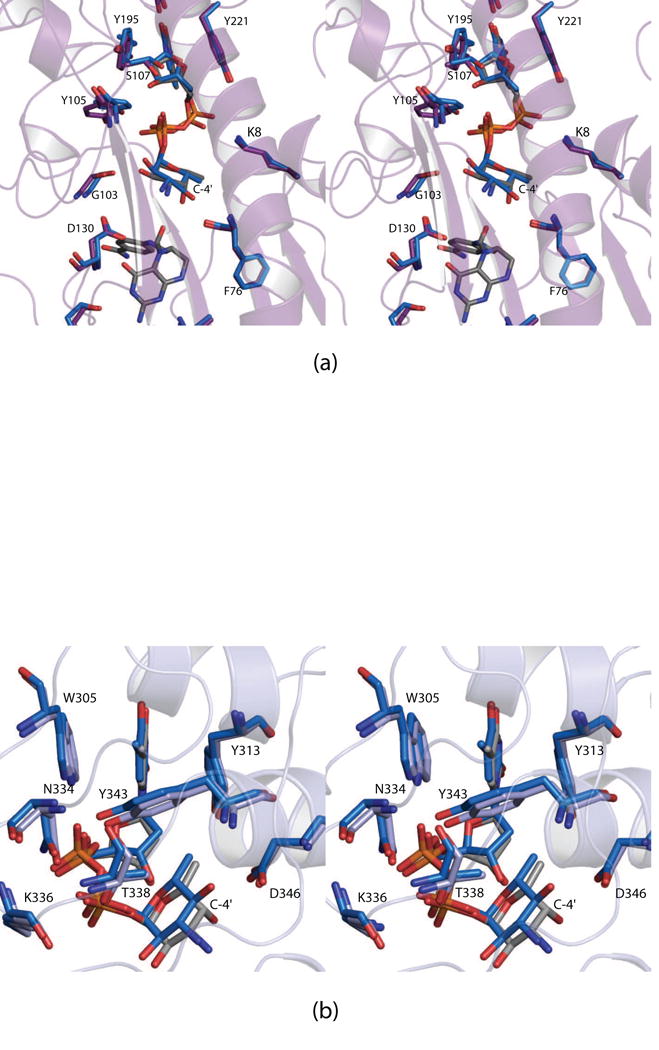
Shown in Fig.6a is a superposition of the FdtF active sites with these bound dTDP-sugars. Clearly, there are no significant changes in the positions of the amino acid side chains lining the active sites, and the two dTDP-sugars occupy nearly identical locations. This type of substrate promiscuity with respect to the stereochemistry about the hexose C-4′ carbon has also been observed in the sugar aminotransferases (Dow et al., 2017; Thoden et al., 2009). Likewise, as can be seen in Fig. 6b, the auxiliary binding pockets accommodate the two different dTDP-sugars in a nearly identical manner.
Fig. 6.
Comparison of the binding of dTDP-Fuc3N versus dTDP-Qui3N. A stereo view of the FdtF active sites with either bound dTDP-Fuc3N or dTDP-Qui3N is presented in (a). The blue highlighted bonds correspond to the FdtF model with bound dTDP-Qui3N. Shown in (b) is a stereo view of the FdtF auxiliary binding pocket with either bound dTDP-Fuc3N or dTDP-Qui3N. The FdtF/dTDP-Qui3N model is displayed in blue bonds.
3.4 Kinetic analyses of FdtF
Given that all of the high-resolution structures reported here were determined utilizing a mutant variant, the kinetic parameters were measured for both the wild-type enzyme and the E395A version to ensure that the mutation did not affect activity. Plots of initial velocities versus dTDP-Fuc3N concentrations for both the wild-type enzyme and the E395A mutant form demonstrated Michaelis-Menten kinetics (Fig. 7a,b). Within experimental error both the Km and kcat values were identical (Table 3). Indeed, FdtF has a reasonable catalytic efficiency of 1.6 × 10⁵ M−1s−1. A plot of initial velocity versus dTDP-Qui3N concentration using the E395A mutant protein also demonstrated Michaelis-Menten kinetics (Figure 7c). The catalytic efficiency of FdtF with dTDP-Qui3N as a substrate, however, was reduced by approximately an order of magnitude (Table 3).
All of the structures solved in this investigation contained a dTDP or a dTDP-sugar ligand bound in the auxiliary binding pocket. To address whether such binding modifies the kinetic properties of FdtF, a site-directed mutant was constructed whereby Trp 305 was replaced with an alanine. As noted previously (Fig. 2a), the indole side chain of Trp 305 forms both a stacking interaction with the thymine ring of the ligand and a hydrogen bonding interaction with an α-phosphoryl oxygen. The W305A mutant variant was crystallized, and its structure determined to 2.2 Å resolution to ensure that the extra ligand binding site had been removed. The model was refined to an overall R-factor of 19.1%. The α-carbons for the E395A and E395A/W305A models superimpose with a root-mean-square deviation of 0.5 Å, indicating no significant structural changes. Indeed, water molecules simply filled in the region where the dTDP ligand would normally be situated. Plots of initial velocities versus either dTDP-Fuc3N or dTDP-Qui3N concentrations for the E395A/W305A mutant protein are presented in Fig. 7d and 7e, respectively. Whereas there were no major structural alterations between the E395A and E395A/W305A proteins, the catalytic efficiently of the double mutant enzyme, however was significantly reduced (Table 3). Clearly, the auxiliary binding pocket plays a role in the modulation of enzymatic activity.
Discussion
WlaRD from C. jejuni was the first sugar N-formyltransferase to be investigated in our laboratory (Thoden et al., 2013). Although its physiological substrate is still unknown, WlaRD was shown to function on both dTDP-Qui3N and dTDP-Fuc3N, albeit its catalytic efficiency with dTDP-Fuc3N as a substrate was reduced nearly 200-fold. From our X-ray analyses, it was demonstrated that the binding position for the dTDP-Fuc3N ligand was shifted in the WlaRD active site by ~1 Å relative to that observed for dTDP-Qui3N. This change most likely contributed to the reduced enzymatic activity. WlaRD is much smaller in size than FdtF, however, and does not contain the ankyrin repeat motif. The catalytic efficiencies of FdtF for either dTDP-Fuc3N or dTDP-Qui3N are much more similar with only an approximate 9-fold difference (Table 3). In the case of FdtF, the dTDP-sugars are shifted by a similar distance of 0.7 Å. Other than the fact that WlaRD does not contain the ankyrin repeat, however, the α-carbons for it and FdtF superimpose with a root-mean-square deviation of ~1.0 Å.
The three-dimensional structure of FdtF presented here represents the second model for a sugar N-formyltransferase containing an ankyrin repeat. The first was QdtF from P. alcalifaciens O40, which functions on dTDP-Qui3N (Woodford et al., 2015). The α-carbons for FdtF and QdtF superimpose with a root-mean-square deviation of 0.6 Å. QdtF likewise shows promiscuity in substrate specificity about the C-4′ carbon. The difference in catalytic efficiency between its natural substrate dTDP-Qui3N and dTDP-Fuc3N is only 15-fold. It is thus tempting to speculate that the ankyrin repeat, with its auxiliary ligand binding pocket, dampens the difference in enzymatic activities against dTDP-Qui3N and dTDP-Fuc3N in QdtF and FdtF as compared to that observed for WlaRD. This may confer fitness to the bacterium under certain environmental conditions. Indeed, in both cases, removal of ligand binding to the auxiliary pocket affects enzymatic activity. What is not clear from the static X-ray models of FdtF and QdtF is why one shows increased catalytic efficiency with dTDP-Fuc3N and the other with dTDP-Qui3N, respectively, given that their active site architectures are remarkably similar. In the case of QdtF, use of its nonphysiologically relevant substrate, dTDP-Fuc3N, resulted in homotropic allosteric behavior in the enzymatic assays (Woodford et al., 2015). This type kinetic behavior was not observed for FdtF with its non-natural substrate, dTDP-Qui3N (Fig. 7c), at least under the assay conditions employed in this investigation.
Ankyrin domains were first described in yeast cell cycle proteins and the Drosophila NOTCH protein and were thought to be eukaryotic-specific (Li et al., 2006). Indeed, these repeating motifs are one of the most common protein domains involved in protein:protein interactions. Recent reports have demonstrated that such ankyrin motifs are also found in bacterial proteins, and in particular those from intracellular pathogens (Voth, 2011). Not surprisingly, both FdtF and QdtF are found in intracellular pathogens, S. enterica O60 and P. alcalifaciens O40, respectively. Until the structural analyses of these proteins, however, it was not known that some ankyrin repeats are involved in ligand binding. What is the selective advantage for maintaining an ankyrin repeat in FdtF and QdtF? The answer is presently unknown. Additional structural, biochemical, and microbiological studies on these putative N-formyltransferases will ultimately be required to address this compelling question.
Acknowledgments
The authors thank Dr. Michel Gilbert, National Research Council Canada, Ottawa, Ontario, Canada and Dr. Peter A. Tipton, University of Missouri, for helpful discussions and comments on the manuscript.
This research was supported in part by an NIH grant (GM115921 to H. M. H.).
Abbreviations
- CHES
2-(cyclohexylaminoethanesulfonic acid)
- dTDP
thymidine diphosphate
- Fuc3N
3-amino-3,6-dideoxygalactose
- Fuc3NFo
3-formamido-3,6-dideoxygalactose
- HEPPS
N-2-hydroxyethylpiperazine-N′-3-propanesulfonic acid
- HPLC
high-performance liquid chromatography
- MOPS
3-(N-morpholino)propanesulfonic acid; N5-formyl-THF, N5-formyltetrahydrofolate; N10-formyl-THF, N10-formyltetrahydrofolate
- Ni-NTA
nickel nitrilotriacetic acid
- Qui3N
3-amino-3,6-dideoxyglucose
- Qui3NFo
3-formamido-3,6-dideoxyglucose
- TEV
tobacco etch virus
- THF
tetrahydrofolate
- Tris
tris-(hydroxymethyl)aminomethane
Footnotes
Publisher's Disclaimer: This is a PDF file of an unedited manuscript that has been accepted for publication. As a service to our customers we are providing this early version of the manuscript. The manuscript will undergo copyediting, typesetting, and review of the resulting proof before it is published in its final citable form. Please note that during the production process errors may be discovered which could affect the content, and all legal disclaimers that apply to the journal pertain.
The authors have no competing financial interests.
X-ray coordinates have been deposited in the Research Collaboratory for Structural Bioinformatics, Rutgers University, New Brunswick, N. J. (accession nos. 5UIJ, 5UIK, 5UIL, 5UIM, and 5UIN).
References
- DeLano WL. The PyMOL Molecular Graphics System. DeLano Scientific; San Carlos, CA, USA: 2002. [Google Scholar]
- Dow GT, Gilbert M, Thoden JB, Holden HM. Structural investigation on WlaRG from Campylobacter jejuni: a sugar aminotransferase. Protein Sci, accepted. 2016 doi: 10.1002/pro.3109. [DOI] [PMC free article] [PubMed] [Google Scholar]
- Emsley P, Cowtan K. Coot: model-building tools for molecular graphics. Acta Crystallogr D Biol Crystallogr. 2004;60:2126–2132. doi: 10.1107/S0907444904019158. [DOI] [PubMed] [Google Scholar]
- Emsley P, Lohkamp B, Scott WG, Cowtan K. Features and development of Coot. Acta Crystallogr D Biol Crystallogr. 2010;66:486–501. doi: 10.1107/S0907444910007493. [DOI] [PMC free article] [PubMed] [Google Scholar]
- Genthe NA, Thoden JB, Benning MM, Holden HM. Molecular structure of an N-formyltransferase from Providencia alcalifaciens O30. Protein Sci. 2015;24:976–986. doi: 10.1002/pro.2675. [DOI] [PMC free article] [PubMed] [Google Scholar]
- Hale CR, Scallan E, Cronquist AB, Dunn J, Smith K, Robinson T, Lathrop S, Tobin-D’Angelo M, Clogher P. Estimates of enteric illness attributable to contact with animals and their environments in the United States. Clin Infect Dis. 2012;54(Suppl 5):S472–479. doi: 10.1093/cid/cis051. [DOI] [PubMed] [Google Scholar]
- Holden HM, Thoden JB, Gilbert M. Enzymes required for the biosynthesis of N-formylated sugars. Curr Opin Struct Biol. 2016;41:1–9. doi: 10.1016/j.sbi.2016.04.003. [DOI] [PMC free article] [PubMed] [Google Scholar]
- Hussain MA, Dawson CO. Economic impact of food safety outbreaks on food businesses. Foods. 2013;2:585–589. doi: 10.3390/foods2040585. [DOI] [PMC free article] [PubMed] [Google Scholar]
- Laskowski RA, Moss DS, Thornton JM. Main-chain bond lengths and bond angles in protein structures. J Mol Biol. 1993;231:1049–1067. doi: 10.1006/jmbi.1993.1351. [DOI] [PubMed] [Google Scholar]
- Li J, Mahajan A, Tsai MD. Ankyrin repeat: a unique motif mediating protein-protein interactions. Biochemistry. 2006;45:15168–15178. doi: 10.1021/bi062188q. [DOI] [PubMed] [Google Scholar]
- Liu B, Knirel YA, Feng L, Perepelov AV, Senchenkova SN, Reeves PR, Wang L. Structural diversity in Salmonella O antigens and its genetic basis. FEMS Microbiol Rev. 2014;38:56–89. doi: 10.1111/1574-6976.12034. [DOI] [PubMed] [Google Scholar]
- McCoy AJ, Grosse-Kunstleve RW, Adams PD, Winn MD, Storoni LC, Read RJ. Phaser crystallographic software. J Appl Cryst. 2007;40:658–674. doi: 10.1107/S0021889807021206. [DOI] [PMC free article] [PubMed] [Google Scholar]
- Murshudov GN, Vagin AA, Dodson EJ. Refinement of macromolecular structures by the maximum-likelihood method. Acta Crystallogr D Biol Crystallogr. 1997;53:240–255. doi: 10.1107/S0907444996012255. [DOI] [PubMed] [Google Scholar]
- Ovchinnikova OG, Liu B, Guo D, Kocharova NA, Bialczak-Kokot M, Shashkov AS, Feng L, Rozalski A, Wang L, Knirel YA. Structural, serological, and genetic characterization of the O-antigen of Providencia alcalifaciens O40. FEMS Immunol Med Microbiol. 2012;66:382–392. doi: 10.1111/1574-695X.12002. [DOI] [PubMed] [Google Scholar]
- Perepelov AV, Liu B, Senchenkova SN, Shashkov AS, Feng L, Knirel YA, Wang L. Structure and gene cluster of the O-antigen of Salmonella enterica O60 containing 3-formamido-3,6-dideoxy-D-galactose. Carbohydr Res. 2010;345:1632–1634. doi: 10.1016/j.carres.2010.05.008. [DOI] [PubMed] [Google Scholar]
- Raetz CR, Whitfield C. Lipopolysaccharide endotoxins. Annu Rev Biochem. 2002;71:635–700. doi: 10.1146/annurev.biochem.71.110601.135414. [DOI] [PMC free article] [PubMed] [Google Scholar]
- Shi C, Singh P, Ranieri ML, Wiedmann M, Moreno Switt AI. Molecular methods for serovar determination of Salmonella. Crit Rev Microbiol. 2015;41:309–325. doi: 10.3109/1040841X.2013.837862. [DOI] [PubMed] [Google Scholar]
- Thoden JB, Schaffer C, Messner P, Holden HM. Structural analysis of QdtB, an aminotransferase required for the biosynthesis of dTDP-3-acetamido-3,6-dideoxy-alpha-D-glucose. Biochemistry. 2009;48:1553–1561. doi: 10.1021/bi8022015. [DOI] [PMC free article] [PubMed] [Google Scholar]
- Thoden JB, Goneau MF, Gilbert M, Holden HM. Structure of a sugar N-formyltransferase from Campylobacter jejuni. Biochemistry. 2013;52:6114–6126. doi: 10.1021/bi4009006. [DOI] [PMC free article] [PubMed] [Google Scholar]
- Voth DE. ThANKs for the repeat: Intracellular pathogens exploit a common eukaryotic domain. Cell Logist. 2011;1:128–132. doi: 10.4161/cl.1.4.18738. [DOI] [PMC free article] [PubMed] [Google Scholar]
- Woodford CR, Thoden JB, Holden HM. New role for the ankyrin repeat revealed by a study of the N-formyltransferase from Providencia alcalifaciens. Biochemistry. 2015;54:631–638. doi: 10.1021/bi501539a. [DOI] [PMC free article] [PubMed] [Google Scholar]
- Wu AM, Mackenzie NE. Structural and immunochemical characterization of the O-haptens of Brucella abortus lipopolysaccharides from strains 19 and 2308. Mol Cell Biochem. 1987;75:103–111. doi: 10.1007/BF00229898. [DOI] [PubMed] [Google Scholar]
- Zimmer AL, Thoden JB, Holden HM. Three-dimensional structure of a sugar N-formyltransferase from Francisella tularensis. Protein Sci. 2014;23:273–283. doi: 10.1002/pro.2409. [DOI] [PMC free article] [PubMed] [Google Scholar]


