

Abstract
Despite the increasingly important role of Hippo-Yap in hepatocellular carcinoma (HCC) development and progression, little insight is available at the time regarding the specifics interaction of Yap and cancer cells migration. Here, we identified the mechanism by which tumor-intrinsic Yap deletion resulted in HCC migratory inhibition. Yap was greatly upregulated in HCC and its expression promoted the cells migration. Functional studies found that knockdown of Yap induced JNK phosphorylation which closely bound to the Bnip3 promoter and contributed to Bnip3 expression. Higher Bnip3 employed excessive mitophagy leading to mitochondrial dysfunction and ATP shortage. The insufficient ATP inactivated SERCA and consequently triggered intracellular calcium overload. As the consequence of calcium oscillation, Ca/calmodulin-dependent protein kinases II (CaMKII) was signaled and subsequently inhibited cofilin activity via phosphorylated modification. The phosphorylated cofilin failed to manipulate F-actin polymerization and lamellipodium formation, resulting into the impairment of lamellipodium-based migration. Collectively, our results identified Hippo-Yap as the tumor promoter in hepatocellular carcinoma that mediated via activation of cofilin/F-actin/lamellipodium axis by limiting JNK-Bnip3-SERCA-CaMKII pathways, with potential application to HCC therapy involving cancer metastasis.
Keywords: Yap, JNK, Bnip3, SERCA, CaMKII, F-actin, Cofilin, Lamellipodium, Migration
Graphical abstract
Highlights
-
•
Yap is upregulated in the hepatocellular carcinoma and promotes cancer cell migration.
-
•
Loss of Yap impairs cell mobility via inhibiting cofilin/F-actin/lamellipodium by activation of JNK-Bnip3-SERCA-CaMKII.
-
•
Loss of Yap enhances JNK phosphorylation which triggers Bnip3-required mitophagy.
-
•
Excessive mitophagy induces mitochondrial energy disorder which blunts SERCA and causes calcium overload.
-
•
The calcium overload drives CaMKII which inactivates cofilin, leading to F-actin degradation and lamellipodium collapse.
1. Introduction
Hepatocellular carcinoma (HCC) is reported as the most common one in digestive cancers in the worldwide [1]. Due to the rapid progression of HCC, most patients with this disease are diagnosed at advanced stage. In advanced HCC cases, the 5-year survival rate is as low as 25–39%, and the recurrence rate is approximately 80% [2]. Several patients underwent operative resection, however, these patients still suffered from a poor prognosis [3]. Notably, some HCC patients with advanced stage have no chances for operation, and their overall survival period is less than one year [4]. It has been reported that recurrence and metastasis account for the high mortality of HCC patients [5]. Therefore, it is critical to identify the potential molecular mechanisms underlying the progression and metastasis in HCC.
The Hippo network is a major conserved growth suppressor that participates in organ size control during development and prevents tumor formation during adult homeostasis [6]. The central component of the Hippo pathway is the transcriptional co-activator Yes-Activated Protein (Yap). Yap binds to transcription factor partners driving a transcriptional programme that specifies cell growth, proliferation, apoptosis, migration and invasion [7], [8], [9]. However, the mechanism by which Yap regulates the cellular migration or invasion is incompletely understood.
Cancer cells migrating into lymph nodes or blood vessels to form metastases is vital for the progression of HCC [10]. In tumor progression, cancer cells can migrate as single cells or collectively as groups in a lamellipodium-based migration mode [11]. Under this condition, cellular membrane extension in lamellipodia is driven predominantly through F-actin polymerization [12]. A large array of actin binding proteins (ABPs) have been found to be the regulator of F-actin polymerization and lamellipodium formation [13]. Among them, cofilin is an indispensable controller [14], [15]. Dephosphorylated cofilin augments the F-actin synthesis and actin filament extension, which assist the formation of lamellipodia. What remains unknown is whether cofilin and actin-driven lamellipodium is regulated by Yap, and if so, what molecular links Yap to cofilin.
Cellular migration involves drastic structural changes, a process that demands high levels of energy and fully functional mitochondria [16] whose quality and quantity are balanced by mitophagy [17], [18]. Our previous study has suggested that mitophagy could regulate the endothelial migration via modification of F-actin homeostasis [19]. Moreover, excessive mitochondrial damage such as mitochondrial fission would lead to the collapse of F-actin and lamellipodium [20], [21]. These information indicate the possible relationship between mitochondria and lamellipodium-based migration. Given the available evidences linking Yap and mitochondria [22], [23], we therefore want to know whether mitochondria, especially mitophagy, is the bridge connecting upstream Yap and downstream cofilin/F-actin. If so, what signals are responsible for mitophagy and cofilin/F-actin.
Apart from mitochondria, cellular migration also needs moderate intercellular calcium ([Ca2+]i) concentration [24]. The excessive [Ca2+]i elevation would impair the cellular migration via activation of Ca/calmodulin-dependent protein kinases II (CaMKII) [25]. The CaMKII has the ability to phosphorylate cofilin [26]. Phosphorylated cofilin is an inactivate form without the ability to assembly F-actin and promote lamellipodium formation. Our previous study [27] has reported that the [Ca2+]i balance is highly dependent on the sarco/endoplasmic reticulum Ca2+-ATPase (SERCA) activity which uptakes 92% [Ca2+]i back to endoplasmic reticulum in the resting state. Meanwhile, SERCA is a Ca-ATPase and its activity is heavily relied on the cellular ATP production. Considering the decisive action of mitophagy in ATP production [28], we therefore ask whether mitophagy handles cofilin via SERCA-mediated [Ca2+]i imbalance and CaMKII activation. Thus, this study is undertaken to establish the regulatory effect of Yap on HCC migration, particularly focusing on the mitophagy-SERCA-CaMKII pathways and cofilin/F-actin/lamellipodium axis.
2. Methods
2.1. Patients and specimen selection
The present study was conducted in accordance with the Guide for the Care and Use of Laboratory Animals, which was published by the US National Institutes of Health (NIH Publication No. 85-23, revised 1996) and the guidelines of the Ethics Committee of Chinese PLA (People's Liberty Army) General Hospital, Beijing, China. The all experimental protocol was approved by Ethics Committee of Chinese PLA (People's Liberty Army) General Hospital, Beijing, China. In all, 6 samples of liver cancer were obtained from the department of oncology, PLA general hospital cancer center. Meanwhile, 6 samples of normal liver tissues that were obtained from patients who underwent surgery were included in this study. The informed consent forms, including blood sample collection consent and operation consent were obtained from all individual participants included in this study.
2.2. Cell culture
The liver cancer cell lines HepG2 and normal live cell lines (L02) used in the present study were obtained from the Chinese Academy of Sciences (Shanghai, China). All cell lines were cultured in RPMI-1640 supplemented with 10% fetal bovine serum (FBS), penicillin G (100 U/ mL) and streptomycin (100 g/mL) and were maintained in monolayer culture at 37 °C in humidified air with 5% CO2.
2.3. The qPCR and RNA interference
The qPCR assay was carried out according to our previous study [29]. The primers used for polymerase chain reaction were as follows: Bnip3, forward, TCCAGCCTCGGTTTCTATTT and reverse, AGCTCTTGGAGCTACTCCGT, YAP, forward, CCCAGACTACCTTGAAGCCA and reverse, CTTCCTGCAGACTTGGCATC, GAPDH, forward, GCGGGAAATCGTGCGTGAC and reverse, CGTCATACTCCTGCTTGCTG. Quantification of gene expression was performed using the ABI PRISM 7500 Sequence Detection System (Applied Biosystems, Foster City, CA) with SYBR Green (TransGen Biotech Co., Ltd., China). The mRNA levels were determined by qRT-PCR in triplicate for each of the independently prepared RNAs and were normalized to the levels of GAPDH expression.
The shRNA or scrambled shRNA control specific against the expression of Yap was constructed using a lentiviral shRNA technique (GeneChem), as described previously by our laboratory [30]. The shRNA was used to generate the stable cell line HepG2 without expression of Yap. To suppress the Bnip3, siRNA was used according to our previous study [19]. The siRNA targeting Bnip3 was purchased from Santa Cruz Biotechnology.
2.4. Western blot analysis
Cells were rinsed with cold PBS and harvested in lysis buffer [31]. Then, the extractions were obtained and then centrifuged at 14,000 rpm for 30 min. Twenty-five micrograms of protein was loaded per lane and separated by SDS-PAGE, then transferred to nitrocellulose membranes and blocked overnight in 5% skim milk. Then, the membrane was incubated with primary antibodies at 4 °C and subsequently incubated with a secondary antibody for 2 h at room temperature. The primary antibodies for the blots are as follows: p-CaMKII (1:1000, Cell Signaling Technology, Inc.), p-cofilin (1:1000, Abcam plc), CaMKII (1:1000, Cell Signaling Technology, Inc.), cofilin (1:1000, Cell Signaling Technology, Inc.), Beclin1 (1:1000, Cell Signaling Technology, Inc.), LC3II (1:1000, Cell Signaling Technology, Inc.), ATG5 (1:1000, 1:1000, Abcam plc), Yap (1:1000, Cell Signaling Technology, Inc.), F-actin (1:1000, 1:1000, Abcam plc), G-actin (1:1000, 1:1000, Abcam plc), p-JNK (1:1000, Cell Signaling Technology, Inc.), JNK (1:1000, Cell Signaling Technology, Inc.), Parkin (1:1000, Cell Signaling Technology, Inc.), p-Parkin (1:1000, Cell Signaling Technology, Inc.), Bnip3 (1:1000, Cell Signaling Technology, Inc.), p62 (1:1000, 1:1000, Abcam plc) and SERCA (1:1000, Cell Signaling Technology, Inc.)
2.5. Detection of Ca2+ concentration and SERCA activity
Intracellular Ca2+ [Ca2+]i was measured using the calcium-dependent fluorescent dye Fura-2 as our previous study described [27]. Briefly, 5 μL of Fura-2-acetoxymethyl ester (AM; 10 μM; Life Technologies, Carlsbad, CA, USA) was applied in the medium for 30 min [27]. The Fura-2-loaded cells were then observed under confocal microscope (Olympus).
The calcium mapping was used to quantify the calcium intensity according to our previous study [32]. Fluorescence intensity of Furo-2 was measured by excitation wavelengths of 340 and emission wavelengths of 500. Data (F/F0) were obtained by dividing fluorescence intensity (F) by (F0) at resting level (t = 0) which was normalized by control groups.
For SERCA activity assay, cells after treatment were harvested to isolate the total proteins. The protein concentration of the supernatant was determined using the BCA method. Sample protein concentrations were adjusted to 1000 μg/mL. The proteins were incubated in a 30 °C water bath for 10 min and 20 μL ATP was added. Thirty seconds later, 20 μL of the sample was added. After mixing for 45 s, the OD values were measured [33].
2.6. Cell migration and invasion assay
Transwell assay was used to examine cell migration according to our previous study [29]. Briefly, a 24-well transwell chamber with a pore size of 8 µm (Corning, USA) was used to conduct the transwell assay [34]. First, 105 cells were seeded into the upper chamber in serum-free medium. DMEM supplemented with 10% FBS was added to the lower chamber. After a 12-h incubation at 37 °C, the non-migrating cells in the upper chamber were carefully removed and the cells that had traversed the membrane were fixed in methanol and stained with 0.05% crystal violet. For quantification, the number of migrated cells was calculated by counting at least five random separate fields as the ratio of the experimental samples to the control samples × 100 [35].
Cell invasion was detected by transwell methods [36]. With regard to the invasion assay, cells (2×10⁵) were seeded in the upper chambers in serum-free media with the matrigel membrane, whereas the lower chambers were loaded with DMEM supplemented with 10% FBS. After 24 h, the cells in the upper chambers that had not migrated were removed by a cotton swab. The total number of migrated cells was counted after they were fixed [37].
2.7. Immunofluorescence
The immunofluorescence staining was conducted as our previous study described [38]. After treatment, cells were fixed with 4% paraformaldehyde for 10 min at room temperature. The primary antibodies were as follows: p-cofilin (1:1000, Abcam, #ab124956), F-actin (1:500, Abcam, #ab205), tubublin (1:1000, Abcam, #ab7291). DAPI (Sigma-Aldrich), lysosome stain, and a mitochondrion-selective MitoFluor ™ stain (Molecular Probes, Burlington, ONT, CA) were used to marker the nuclear, lysosome, and mitochondria, respectively. Fluorescence confocal images were captured using a LSM 5 Pa Laser Scanning Microscope (Zeiss Germany, Oberkochen, Germany). For the observation of lamellipodium, the staining of F-actin was used and the images were obtained under black-and-white vision.
2.8. Chromatin immunoprecipitation
Chromatin immunoprecipitation was performed as described previously [39]. Formaldehyde cross-linked chromatin fragments were immunoprecipitated with either anti-p-JNK antibody or anti-histone H3 antibody overnight at 4 °C. Control samples were treated in the same way except that no antibody was present. Immune-complexes were captured with protein A/G-agarose and washed with 150 mM NaCl, 13.5% sucrose, 1% Triton X-100, 0.2% SDS, 0.02 NaN3, 5 mM EDTA and then 500 mM NaCl, 1% Triton X-100, 0.1% deoxycholate, 0.2% NaN3, 1 mM EDTA and 50 mM HEPES (pH 7.5), and finally Tris-EDTA (10 mM Tris, 1 mM EDTA, pH 8.0). Immune-complexes were then eluted by incubation with 1% SDS and 100 mM NaHCO3. To reverse cross-links, eluates and input DNA were incubated overnight at 65 °C. DNA was purified using the Qiagen PCR clean-up kit (Qiagen, Valencia, CA, USA). PCRs were performed with primers flanking the Bnip3 promoter. PCR products were resolved by electrophoresis in agarose gel and visualized with ethidium bromide.
2.9. Mitochondrial respiratory chain complex function
To investigate the function of mitochondria, the ATP production was examined [40]. Besides, mitochondrial respiratory complexes expression and activity were measured according to our previous studies [33]. Mitochondrial respiratory function was measured polarographically at 30 °C using a Biological Oxyge Monitor System (Hansatech Instruments, King's Lynn, UK). Mitochondrial respiration was initiated by adding glutamate/malate to a final concentration of 5 and 2.5 mmol/L, respectively. State 3 respiration was initiated by adding ADP (150 nmol/L); state 4 was measured as the rate of oxygen consumption after ADP phosphorylation. The respiratory control ratio (state 3/state 4) and the ADP/O ratio (number of nmol ADP phosphorylated to atoms of oxygen consumed) were calculated as our previously described.
2.10. Reagent treatment
To activate mitophagy, FCCP (5 μM, Selleck Chemicals) was used 2 h before treatment. To inhibit the mitophagy, its specific inhibitor 3-MA (10 mM, Selleck Chemicals) was added to the medium for 1 h to block mitophagy activation. To suppress and activate the JNK pathway, SP600125 (SP, 10 μM, Selleck Chemicals) and Anisomycin (Ani, 10 μM, Selleck Chemicals) were used 2 h before treatment, respectively. To blockade of the intracellular calcium overload, cell-permeable calcium chelator BAPTA (Sigma, #A1076) was diluted in D-Hanks solution to a final concentration of 50 μM for 30 min pretreatment. In contrast, to induce the cellular calcium overload, ionomycin, a calcium agonist was used 30 min before treatment. Jasplakinolide (Jas, 2 μM, Abcam, #ab141409) was used 2 h before treatment to inhibit the F-action degradation.
2.11. Statistical analysis
All data in this study are expressed as the mean ± SD of at least three independent experiments. Statistical analysis of differences was performed by one-way analysis of variance (ANOVA) or student t-test using SPSS 17.0 software. P value less than 0.05 was considered statistically significant.
3. Results
3.1. Loss of Yap impairs the HCC migration and invasion via inhibiting F-actin-induced lamellipodium formation
To figure out the expression of Yap in HCC cancer tissues and normal tissues in the present study, we carried out qRT-PCR and western blot analysis by extracting total mRNAs and proteins from patients. In this study, 6 cases of tissue samples were collected and detected using Yap primers or anti-Yap antibody. We found that the Yap mRNA and proteins expression were increased in tumor tissues compared with that in normal liver tissues (Supplemental Fig. 1A-C). These data indicated that Yap may be involved in the development of HCC. Furthermore, we also detected the change of Yap in HCC cell line HepG2 and normal liver cell line L02. We found abundant Yap expression in HepG2 but not in L02 (Fig. 1A-B), suggesting that Yap may have a causal role in regulating cellular migration. Thus, we stably knocked down Yap expression using a lentivirus vector–based shRNA technique in HepG2 cells. The knockdown efficiency was confirmed by western blotting (Fig. 1A-B). Through loss-of function assay about Yap in HepG2 cells, we confirmed that Yap had the ability to influence cellular invasion (Fig. 1C and E) and migration (Fig. 1D and F). Loss of Yap abated the numbers of migrated and invaded cells when compared to the control group (Fig. 1E-F). These results suggested that Yap was upregulated in HCC and higher Yap promoted HCC migration and invasion in vitro.
Fig. 1.

Knockdown of Yap impaired HCC metastasis in vitro via inhibition of F-actin-induced lamellipodium formation. A-B. The expression of Yap in HepG2 cells and L02 cells. HepG2 cells stably expressing the shRNA vector had lower Yap expression when compared to the control-shRNA group and normal liver L02 cells. C. The invasion assay was performed in wild-type cells (Ctrl) and in cells with stable knockdown of Yap (shRNA-Yap). Representative photographs are presented. D. The representative photographs of cell migration are presented. E. The relative number of invasive cells. F. The relative number of migratory cells. G-H. The co-staining of F-actin and tubulin. The amplification panel was indicative of the lamellipodia outside of the cell membrane (yellow arrows). *P < 0.05. (For interpretation of the references to color in this figure legend, the reader is referred to the web version of this article.)
Cancer migration depends on the formation of lamellipodium. Compared to the control HepG2 cells, Yap deficiency reduced the lamellopodium length (Fig. 1G) and impaired its formation (yellow arrows in the amplification panel of Fig. 1H). Because lamellipodium is composed of F-actin, and the collapse of lamellipodium could be derived from F-actin degradation. In control HepG2 cells, the F-actin was clear and expressed in the cytoplasm with regular arrangement (Fig. 1H). However, after Yap deletion, F-actin was unclear, inordinate and fragmented, suggesting that Yap loss facilitated F-actin collapse (Fig. 1H). To further demonstrate whether F-actin was specially handled by Yap, we also co-stained tubulin, another element of cytoskeleton, which makes up microtubule and promotes intracellular transport but has no role in cellular migration [41]. As shown in Fig. 1H, loss of Yap had no influence on the tubulin structure. Altogether, these data indicated that Yap controlled lamellipodium-based migration of HCC via sustaining F-actin homeostasis.
3.2. Yap deficiency induces F-actin degradation via phosphorylation of cofilin by activating CaMKII
Because F-actin was made up of G-actin, we therefore wanted to know whether Yap deficiency induced F-actin malfunction via promoting F-actin degradation into G-actin. As shown in Fig. 2A-C, loss of Yap was associated with more G-actin but less F-actin in HepG2 cells. However, after application of depolymerizing agent jasplakinolide (Jas) under Yap deletion group, the F-actin expression was increased while the G-actin was reduced (Fig. 2A–C). These data indicated that Yap deletion disassembled F-actin into G-actin. Furthermore, because cofilin is the vital regulator for the balance between F-actin and G-actin. Dephosphorylated cofilin has the ability to assist G-actin to form F-actin which facilitates the cell migration in some direction via lamellipodium. In our present study, loss of Yap upregulated the phosphorylated cofilin when compared to the control HepG2 cells (Fig. 2A and D). These could be the underlying mechanism by which Yap deficiency induced F-actin degradation.
Fig. 2.

Yap silence was associated with F-actin depolymerization into G-actin via activation of CaMKII/cofilin pathways. A-C. Yap deficiency broken-down F-actin into G-actin. Jasplakinolide (Jas), an inhibitor of F-actin depolymerization, reversed the F-actin content in Yap-deleted HepG2. A and D. The change of cofilin phosphorylation. Yap loss enhanced the expression of p-confilin, an inactive form of cofilin. E-G. Yap deficiency could activate CaMKII and cofilin. And CaMKII pathway was responsible for cofilin phosphorylation because inhibition of CaMKII via KN93 abated p-cofilin expression. H. The co-staining of p-CaMKII and p-cofilin. Yap loss caused the synergistic change of p-CaMKII and p-cofilin. However, CaMKII blocker KN93 suppressed the Yap-induced cofilin phosphorylation. *P < 0.05 vs. control group; #P < 0.05 vs. shRNA-Yap group.
According to previous study, the initial signal for cofilin conformational change is primarily attributed to CaMKII which phosphorylates cofilinat Ser3 site [26], [42]. To demonstrate whether CaMKII was involved in the cofilin modification in Yap-deleted HepG2 cells, we firstly examined the change of CaMKII. Compared to the control HepG2 cells, Yap deficiency augmented the CaMKII phosphorylation (Fig. 2E-F), indicative of increased CaMKII activity. In contrast, the KN-93, an inhibitor of CaMKII, could neutralize CaMKII phosphorylation under Yap deletion (Fig. 2E-F). Furthermore, KN-93 also alleviated the expression of p-cofilinSer3 and therefore elevated the cellular dephosphorylated cofilin (Fig. 2E and G), hinting that activated CaMKII by Yap deficiency was instrumental to the cofilin inactivation. To further provide solid evidence for the contributory effect of CaMKII on cofilin phosphorylation, we used immunofluorescence to observe the changes of p-CaMKII and p-cofilin. As shown in Fig. 2H, loss of Yap increased p-CaMKII and p-cofilin. However, inhibition of CaMKII via KN-93 had the ability to abate p-CaMKII expression as well as p-cofilin content (Fig. 2H). Altogether, these data indicated that CaMKII was the Yap's sequential signaling to govern cofilin phosphorylation and F-actin-to-G-actin degradation.
3.3. CaMKII is activated by SERCA-mediated [Ca2+]i overload
Given that CaMKII is a calcium dependent protein whose activity and phosphorylation are relied on [Ca2+]i concentration. Based on this, we observed the change of [Ca2+]i concentration. Firstly, Fura-2AM. based calcium detection illustrated that [Ca2+]i fluorescence was increased in response to Yap deficiency (Fig. 3A-B). To further prove whether [Ca2+]i overload was responsible for CaMKII activation, we used BAPTA, a calcium chelator, to suppress Yap-mediated [Ca2+]i outburst. As shown in Fig. 3. A-B, BAPTA not only reduced [Ca2+]i but also alleviated p-CaMKII expression (Fig. 3C-D). In contrast, the ionomycin (Ion), a calcium agonist, could increase the [Ca2+]i (Fig. 3A-B) as well as the CaMKII phosphorylation in shRNA-control HepG2 cells (Fig. 3C-D). Accordingly, these data elucidated that CaMKII was drove by [Ca2+]i overload.
Fig. 3.

CaMKII and cofilin phosphorylation were droved by SERCA-mediated [Ca2+]i overload. A-B. The intracellular calcium ([Ca2+]i) intensity was measured by Fura-2 A.M. BAPTA, a calcium chelator, was used to reduce the level of [Ca2+]i. Ionomycin (Ion), a calcium agonist, was applied to induce [Ca2+]i overload. C-D. The CaMKII was phosphorylated by [Ca2+]i overload. C and E. The change of SERCA expression. F. The ATP production was also decreased in Yap-deleted HepG2 cells. G. The alteration of SERCA activity. SERCA activity was declined in response to Yap loss. Whereas exogenous treatment of ATP could reverse SERCA activity. H-I. The [Ca2+]i map via confocal microscopy by Fura-2 A.M. Fluorescence intensity of Fura-2AM was measured by excitation wavelengths of 340 nm and emission wavelengths of 500 nm, respectively. Data (F/F0) were obtained by dividing fluorescence intensity (F) by (F0) at resting level (t=0) which was normalized by control groups. Exogenous treatment of ATP was used to reverse the SERCA activity. Thapsigargin (Tg), an inhibitor of SERCA was used to block SERCA activity. J. The co-staining of p-CaMKII and p-cofilin. Recovery of SERCA via exogenous ATP reduced p-CaMKII and p-cofilin in Yap-deleted HepG2 cells. While inhibition of SERCA by Tg caused the increases in p-CaMKII and p-cofilin in shRNA-control HepG2 cells. *P < 0.05 vs. control group; #P < 0.05 vs. shRNA-Yap group, @ P < 0.05 vs. shRNA-ctrl group.
Our previous study has proposed that the SERCA inactivity and downregulation account for [Ca2+]i overload. The SERCA re-uptakes 92% calcium back to endoplasmic reticulum (ER) in resting condition [27], [32]. Therefore, we wanted to know whether [Ca2+]i overload was resulted from the aberrant SERCA. As for SERCA expression, no significant change was observed regardless of Yap deficiency or not (Fig. 3C and E). Notably, SERCA activity was strongly reduced after Yap deletion (Fig. 3G). These data hinted that SERCA activity rather than its expression was manipulated by Yap.
Considering that SERCA is a Ca-ATPase whose activity is highly dependent on ATP production. We therefore examined the fluctuation of intracellular ATP. Compared to the control group, the ATP production was robustly declined in Yap-deleted HepG2 cells (Fig. 3F). In contrast, exogenous ATP application (1 mM) not only reversed the cellular ATP content to normal level (Fig. 3F) but also restored SERCA activity in Yap-deleted cells (Fig. 3G). Moreover, these tendencies were functionally accompanied with a drop in [Ca2+]i intensity via calcium mapping analysis (Fig. 3H-I). Application of ATP could reduce calcium overload in Yap-deleted cells. However, inhibition of SERCA activity via its inhibitor thapsigargin (Tg) elevated [Ca2+]i in shRNA-control group. These data implied that ATP shortage causally forced SERCA inactivation and calcium overload. The latter elicited CaMKII phosphorylation.
At last, we conducted the loss-and gain-of function assay of SERCA activity via exogenous ATP and SERCA inhibitor Tg. Then, we observed the change of p-CaMKII and p-cofilin. As shown in Fig. 3J, the extra ATP treatment had the ability to dramatically attenuate p-CaMKII and p-cofilin. In contrast, inhibition of SERCA via Tg re-introduced the p-CaMKII and p-cofilin. Altogether, these data revealed that ATP shortage blunted SERCA, leading to the [Ca2+]i elevation which was the main molecular mechanism for CaMKII activation and cofilin phosphorylation.
3.4. Yap deficiency activates mitophagy leading to energy metabolism disorder
Because mitochondria are the center of cellular energy production [43]. The ATP undersupply may be derived from the mitochondrial dysfunction [44]. Based on the property of Yap on mitochondrial damage via Bcl-XL [22], we therefore speculated that Yap deficiency was associated with mitochondrial energy disorder. As shown in Fig. 4A–D, loss of Yap repressed the state 3/4 respiratory rate, ADP phosphorylation (respiratory control ratio) and ATP synthesis efficiency (ADP/O). These data claimed the damage of mitocondrial oxidative phosphorylation under Yap deletion.
Fig. 4.

Yap-related energy disorder was due to excessive mitophagy. A-D. Effect of Yap deletion on state 3 respiration, state 4 respiration, respiratory control ratio (RCR [state 3/state 4]), and number of nmol ADP phosphorylated to atoms of oxygen consumed (ADP/O). E. The mitophagy activity was examined via the overlap of mitochondria and lysosome. Compared to the control cells, Yap-deleted HepG2 cells had more lysosome containing mitochondria. 3-MA was the inhibitor of mitophagy and 3-MA could alleviate the promotive effect of Yap deficiency on mitophagy. FCCP was the inducer of mitophagy, which was used as the positive control group. F-J. The change of proteins related to mitophagy. K-L. The content of mitochondrial electron respiratory complex (ETC). Yap caused a significant drop in ETC contents. But this tendency was reversed by 3-MA. M. The changes in ETC I, II, and V activities were measured spectrophotometrically. Yap deficiency was associated with the ETC inactivity which was reversed by mitophagy inhibition via 3-MA. N. The mtDNA copy number was assessed by complex IV segment. O. The transcript level of mtDNA was reflected by two different components: NADH dehydrogenase subunit 1 (ND1) encoded by the light chain of mtDNA and cytochrome c oxidase subunit I (COX I) encoded by the heavy chain of mtDNA. *P < 0.05 vs. control group; #P < 0.05 vs. shRNA-Yap group, @ P < 0.05 vs. shRNA-ctrl group.
Based on the increasingly important action of mitophagy on mitochondrial quantity and quality, we therefore asked whether mitophagy was implicated in the Yap-mediated mitochondrial malfunction. As shown in Fig. 3E, compared to the normal HepG2 cells, Yap deficiency positively promoted the fusion of mitochondria and lysosome, which was witnessed by more overlap of mitochondria and lysosome. In contrast, the mitophagy inhibitor 3-MA weakened the integration between mitochondria and lysosome. However, in the shRNA control group, application of FCCP, an inducer of mitophagy, could augment the merge of mitochondria and lysosome.
Besides, loss of Yap also enhanced the LC3II accumulation on the mitochondria which was accompanied with the increases in p62, beclin1 and ATG5 expression (Fig. 4F–J). These changes could be reversed by 3-MA, an inhibitor of mitophagy(Fig. 4F-J). Excessive mitophagy would consume most of mitochondria. As shown in Fig. 4K–L, we found that loss of Yap caused the downregulation of mitochondrial electron respiratory complex (ETC). However, 3-MA inhibited the decline of ETC in Yap-deleted HepG2 cells (Fig. 4K-L). These data indicated that mitophagy induced mitochondrial damage. Similarly, the ETC activities were also reduced after knockdown of Yap but increased once inhibition of mitophagy (Fig. 4M). Thus, these data collectively described that Yap deficiency was associated with mitophagy activation which consumed lots of mitochondria, leading to the ETC down-regulation and inactivation.
The ETC was encoded by mitochondria DNA (mtDNA), we therefore wanted to know whether excessive mitophagy debased the mtDNA copy number and mtDNA transcripts. The mtDNA copy number was assessed by complex IV segment. The transcript level of mtDNA was reflected by two different components: NADH dehydrogenase subunit 1 (ND1) encoded by the light chain of mtDNA and cytochrome c oxidase subunit I (COX I) encoded by the heavy chain of mtDNA. As shown in Fig. 4N–O, under Yap deficiency, the mtDNA copy and transcription were obviously diminished. However, inhibition of mitophagy by 3-MA protected the mtDNA copy and transcription in Yap-deleted HepG2 cells. These findings explained that Yap-mediated energy shortage was derived from excessive mitophagy which degraded the mtDNA copy and transcription, leading to ETC loss and oxidative phosphorylation collapse.
3.5. Mitophagy is triggered by Bnip3 upregulation
Mitophagy could be regulated via BCL2/adenovirus E1B 19 kDa protein-interacting protein 3 (Bnip3), FUN14 domain containing 1 (FUNDC1) and Parkin [19], [30], [45]. FUNDC1-required mitophagy was primarily triggered in response to hypoxia according to our previous finding [19]. As for Parkin, its activation was largely dependent on PINK or mitochondrial membrane potential collapse as our previously reported [30]. Bnip3 was considered as a tumor suppressor to limit tumor development and progression [46]. In the present, we argued that Bnip3 may be more likely to be employed in Yap-mediated mitophagy. As expected, compared to the control HepG2 cells, no changes were found about the total FUNDC1 (t-FUNDC1), phosphorylated FUNDC1 at Tyr18 (p-FUNDC1), total Parkin (t-Parkin) and phosphorylated Parkin at Ser65 (p-Parkin) in Yap-deleted HepG2 cells (Fig. 5A-C). While the Bnip3 content was significantly increased in Yap-deleted HepG2 cells (Fig. 5A and D). These data fully explained that Bnip3 was commanded by Yap and may be involved in mitophagy activity. Next, siRNA was used to establish the regulatory role of Bnip3 in mitophagy (the siRNA knockdown efficiency was confirmed in Fig. 5F). After Bnip3 silence, less LC3II was migrated on the mitochondria (Fig. 5E), indicative of mitophagy inhibition. These data uncovered that Yap regulated mitophagy via Bnip3.
Fig. 5.

Yap deficiency activated Bnip3-required mitophagy. A-D. The change of t-FUNDC1, p-FUNDC1, t-Parkin, p-Parkin and Bnip3. Yap loss upregulated Bnip3 expression but had no role in other mitophagy receptors. E. Bnip3 upregulation was associated with the mitophagy activation. The siRNA was used to knockdown the expression of Bnip3. In Yap-deleted HepG2 cells, more LC3II migrated on the surface of mitochondria. In the amplification panel, we observed more foci of mitochondria and lysosome. However, this change was blocked once knockdown of Bnip3. F-I. Bnip3-required mitophagy was associated with CaMKII/cofilin phosphorylation. Western blots indicated that both of p-CaMKII and p-cofilin were suppressed once silence of Bnip3. J. Inhibition of Bnip3-required mitophagy reversed the F-actin and lamellipodia in Yap-deleted HepG2 cells. The F-actin and lamellipodia images were obtained under black-and-white vision. In the amplification panel, the yellow arrows indicated the lamellipodia. *P < 0.05 vs. control group; #P < 0.05 vs. shRNA-Yap group. (For interpretation of the references to color in this figure legend, the reader is referred to the web version of this article.).
Furthermore, to demonstrate whether mitophagy was involved the CaMKII and cofilin regulation, we detected the expression of CaMKII and cofilin. The results shown in Fig. 5F-I displayed that loss of Bnip3 abated CaMKII and cofilin phosphorylation. Moreover, to provide the direct evidence for the role of Bnip3-required mitophagy in F-actin degradation and lamellipodium disorder, we stained F-actin. As shown in Fig. 5J, Yap deficiency caused F-actin malalignment with less lamellipodium around the cells. However, loss of Bnip3 reversed F-actin structure and lamellipodium number (Fig. 5J). Thus, we solidly confirmed that mitophagy was regulated by Bnip3 and contributed to the F-actin degradation and CaMKII/cofilin activation.
3.6. Yap deletion augments Bnip3 expression via JNK pathway
At last, we wanted to know how Yap increased the expression of Bnip3. Several studies have indicated that Bnip3 could be regulated by JNK pathways. Considering the available evidences linking Yap and JNK, we therefore guessed whether JNK was the node connecting Yap and Bnip3. Firstly, we demonstrated that Yap loss was associated with JNK phosphorylation (Fig. 6A-B). SP600125 (SP) is the inhibitor of JNK and it blocked Yap-mediated JNK phosphorylation (Fig. 6A-B). Moreover, SP also halted the Yap-evoked Bnip3 upregulation (Fig. 6A and C). In contrast, Anisomycin (Ani) is the activator of JNK, which was used as the positive control group. Ani induced JNK phosphorylation (Fig. 6A-B) and Bnip3 upregulation (Fig. 6A and C) in shRNA-control group. These data confirmed our original assumption that Yap deletion elevated Bnip3 via JNK.
Fig. 6.

JNK pathway mediated Bnip3 upregulation via regulating Bnip3 transcription. A-C. Yap deletion was involved in the JNK activation. SP600125 (SP) and Anisomycin (Ani) were used to inhibit or activate JNK pathways, respectively. Inhibition of JNK pathway abated Bnip3 upregulation in Yap-deleted HepG2 cells. However, activation of JNK triggered Bnip3 expression in shRNA-control HepG2 cells. D. The mRNA expression of Bnip3. E-F. Chromatin-anti-p-JNK immunoprecipitation (ChIP) assay displayed that p-JNK interacted with the Bnip3 promoter in Yap-deleted HepG2 cells, but it does not in control or shRNA-control HepG2 cells. Immunoglobulin-G (IgG) was used as negative control, and anti-histone-3 (α-H3) as a positive control; input demonstrated equal amplification of DNA in non-immunoprecipitated samples; IP corresponds to the amplified DNA band in the immunoprecipitated samples. G. Inhibition of JNK also alleviated the mitophagy activity via mitochondria and lysosome co-staining. H. Blockade of JNK prevented the F-actin degradation and therefore contributed to the lamellipodia formation. The tubulin was used as the negative control group. In the amplification panel, yellow arrows indicated the lamellipodia. *P < 0.05 vs. control group; #P < 0.05 vs. shRNA-Yap group, @ P < 0.05 vs. shRNA-ctrl group. (For interpretation of the references to color in this figure legend, the reader is referred to the web version of this article.)
To further explain how JNK elevated the Bnip3 expression, we focused the Bnip3 gene transcription. Firstly, Bnip3 mRNA was increased after Yap deletion, but was reduced under SP treatment (Fig. 6D). Whereas in the shRNA-control group, the Ani had the ability to promote Bnip3 transcription (Fig. 6D). These data hinted that JNK may contribute to Bnip3 gene transcription. Through chromatin-anti-p-JNK immunoprecipitation (ChIP) assay, we demonstrated that p-JNK structurally bound to Bnip3 promoter (Fig. 6E-F). In Yap-deleted HepG2 cells, p-JNK could interact with Bnip3 promoter (Fig. 6E-F). Whereas SP inhibited this tendency (Fig. 6E-F). Furthermore, we also used the JNK activator Anisomycin (Ani) in the shRNA-control HepG2 cells (Fig. 6E-F). The result exhibited that Ani treatment induced the interaction between p-JNK and Bnip3 promoter. Altogether, this data illustrated that p-JNK was the positive transcription factor for Bnip3.
At last, to demonstrate whether JNK was also involved in mitophagy activation and F-actin degradation, we firstly co-stained mitochondria and lysosome. As shown in Fig. 6G, loss of Yap caused more mitochondria and lysosome overlap. And this change was reversed by JNK inhibitor. Furthermore, we used the F-actin, tubulin and lysosome staining to explain the role of JNK in F-actin and lamellipodium regulation. As shown in Fig. 6H, loss of Yap caused F-actin disarrangement and lysosome upregulation, which was accompanied with lamellipodium collapse (yellow arrows in the amplification panel of Fig. 6H). However, inhibition of JNK via SP in Yap-deleted HepG2 cells, the number of lysosome was reduced (Fig. 6H). Meanwhile, SP also sustained F-actin and lamellipodium (Fig. 6H). In contrast, in the shRNA control group, activation of JNK by Ani upregulated the lysosome and disrupted F-actin/lamellipodium. Collectively, these data identified the vital role of JNK in mitophagy activation, F-actin degradation and lamellipodium disorder.
4. Discussion
In this study, we found that (1) Yap was significantly increased in the HCC cancer tissues and HepG2 cells; (2) loss of Yap was closely associated with the inability of HepG2 cells to migrate and invade in a F-actin dependent mode; (3) Yap deficiency greatly contributed to the JNK phosphorylation which directly interacted the Bnip3 promoter and augmented the Bnip3-required mitophagy; (4) excessive mitophagy unfortunately consumed most of mitochondria leading to the mitochondrial DNA damage, ETC loss and energy disorder; (5) insufficient ATP specifically blunted SERCA and trigged [Ca2+]i overload; (6) [Ca2+]i elevation drastically phosphorylated CaMKII which inactivated cofilin, finally resulting into F-actin degradation and abrogating lamellipodium-based migration. To our best known, this is the first study to describe the comprehensive role of Yap in the HCC migration via regulation of cofilin/F-actin axis by inhibiting JNK/Bnip3/SERCA/CaMKII pathways (Fig. 7).
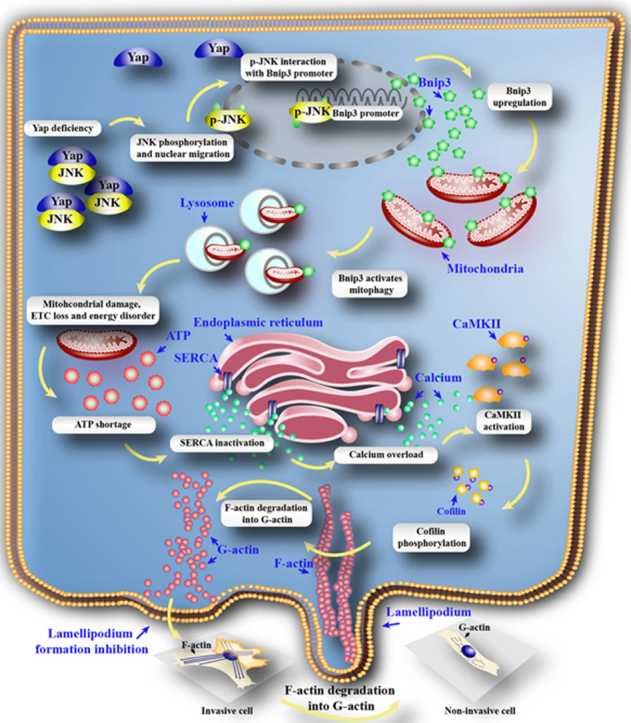
Fig. 7.

Deletion of Yap impaired the HCC migration. Loss of Yap enhanced the JNK activity. Phosphorylated JNK translocated into nuclear where it directly interacted with Bnip3 promoter and contributed to Bnip3 transcription and expression. Higher Bnip3 forced the mitophagy which excessively consumed mitochondria, leading to the mtDNA damage, mitochondrial electron respiratory complex (ETC) downregulation and ATP undersupply. The energy disorder blunted SERCA activity resulting into the inability of SERCA to reuptake intracellular calcium into ER. The elevation of calcium activated CaMKII which phosphorylated cofilin, leading to the obstacle of F-actin assembling. The failure of F-actin to form the stress fiber impeded lamellipodium formation in the cell membrane, finally limiting the cancer migration. Therefore, Yap regulated HCC metastasis and mobilization via governing cofilin/F-actin/lamellipodium axis by inhibition of JNK/Bnip3/SERCA/CaMKII pathways.
Hepatocellular carcinoma (HCC) is the fifth most common malignancies worldwide and the second frequent cause of cancer-related death [5]. Despite remarkable advances in diagnosis and improvement in therapeutic modalities, including novel chemotherapeutic interventions and target therapy, the long-term survival of HCC patients remains unsatisfactory due to the high rates of distal metastasis [2], [4]. Thus, it is essential to explore the molecular mechanisms of metastasis and recurrence of HCC.
Cancer cell migration requires important regulations of cell cytoskeleton, volume, morphology, cell-to-matrix and cell-to-cell adhesions [15], [47]. Over the recent years, multiple modes of cancer cell migration have been characterized. Notably, the mesenchymal mode (or the lamellipodium-based migration mode) on individual cell migration has been described by several studies [10], [15]. In the lamellipodium-based mode, the arrangement and dynamic behavior of F-actin filaments supply the protrusive force for cell movement [48], determine the shape of migrating cells [49], and provide the cortical tension necessary for maintaining cell/cell and cell/matrix contacts [50], [51]. These functions depend on a complex network of F-actin filaments that extend throughout the cytoplasm and is mainly controlled by cofilin [12], [52]. Thus, the F-actin cytoskeleton and its regulator cofilin are the major vehicle for cellular migration and invasion [53], [54]. In the present, we found that Hippo-Yap pathway was the upstream controller of cofilin/F-actin. Loss of Yap caused the cofilin phosphorylated inactivation, which was accompanied with lamellipodium collapse. As far as we know, this is the first investigation to describe the relationship between Hippp-Yap and cofilin/F-actin.
The Hippo pathway is strongly considered as an important player in cancer development involving cellular growth and apoptosis in liver cancer, prostate cancer, lung cancer, and ovarian cancer [55], [56], [57]. Although clinical data have illustrated high Yap expression correlates with poor survival for HCC patients [58], little evidence is available to explain the role of Yap in cellular migration. In the present study, we provided solid evidence for the indispensable action of Yap on cellular migration. Yap negatively controlled the JNK/Bnip3 activation and sustained mitochondria ATP supply via abating Bnip3-required mitophagy. More ATP production could preserve the SERCA activity and intracellular calcium homeostasis, powerfully blocking CaMKII activation. CaMKII is the upstream mediator for the cofilin phosphorylated inactivation [59]. Inhibition of CaMKII/cofilin pathway by Yap maintains F-actin updating and prevents F-actin degradation. Thus, through modification of JNK/Bnip3/SERCA/CaMKII pathways, Yap forcefully keeps the cofilin and F-actin balance. This is the mechanism by which Yap regulates the cell migration.
JNK has been reported as the stress-activated protein kinases in the liver [60], and activation of JNK induces inflammation and apoptosis [61]. JNK has a close relationship with c-Jun, a kind of phosphorylation activated transcription factor. We found that phosphorylated JNK could bind to the Bnip3 promoter, leading to Bnip3 upregulation. Furthermore, Bnip3 has the ability to activate mitophagy which is the housekeeper of mitochondrial quantity and quality [62]. Notably, different mitophagy receptor may have different role in cell fate. Our previous study has found that FUNDC1-required mitophagy benefited cells survival under hypoxia [19]. In contrast, in the reoxygenation stage after hypoxia, the Parkin-required mitophagy was the culprit for cellular death [30]. While, in the present study, JNK/Bnip3-required mitophagy specifically induced mitochondrial dysfunction, causing HCC migration inhibition. This data puts forward that the Bnip3-required mitophagy may be the core signal to handle cancer migration.
Mechanistically, excessive mitophay consumed the mitochondrial mass and led to the drop in mtDNA copy and transcript, which was accompanied with the decline in ETC contents. Lower ETC failed to produce enough ATP to fuel the cellular biological function, especially intracellular calcium recycle. The ATP shortage finally impaired SERCA activity and evoked calcium overload, suggesting that mitophagy has the ability to modify calcium balance. Notably, several studies have uncovered the relationship between calcium and mitophagy. But they argued that calcium was the upstream signal for the mitophagy [40], [63]. Little evidence is available for the feedback signal of mitophagy to calcium. Based on our data, we added more information of the regulatory effect of mitophagy on calcium balance. These findings confirm that mitophagy is not only the scavenging system of mitochondria, and that it also influences the calcium homeostasis and ER-related calcium channel SERCA. Cautiously, the calcium homeostasis is finely-controlled by inositol trisphosphate receptor 3 (IP3R), ryanodine receptor (RyR) and SERCA according to our previous study [32], [64]. Whether mitophagy also exerts influence on IP3R or RyR remains unknown and further insights into these molecular mechanisms are needed.
The CaMKII could be launched by calcium overload. Activated CaMKII elicited cofilin phosphorylation, an inactive form of cofilin. In the process of cellular migration, actin cytoskeleton rearrange needs the dephosphorylated cofilin [65]. It promotes G-actin assembling into F-actin at the front of cell, contributing to the formation of lamellipodium [66]. In contrast, p-cofilin causes the F-actin synthesis disturbance, and even mediates F-actin depolymerization into G-actin. As the consequence of F-actin collapse, the lamellipodium-based migration was blunt. In the present study, Yap deficiency was associated with the cofilin phosphorylation via activation of JNK/Bnip3/SERCA/CaMKII pathways, hinting the indispensable role of Yap in cancer migration. Thereby, there findings enrich the tumor-promotive effect of Yap via enhancing migration, which fills the gap underlying Yap and cancer metastasis. Meanwhile, we also explore a novel pathway to regulate the F-actin/lamellipodium homeostasis, and that is Yap-JNK-Bnip3-SERCA-CaMKII. However, more solid clinical evidences are needed to support our notation.
Collectively, the results of our report illustrate the important role of Yap in the HCC migration via regulating cofilin/F-actin/lamellipodium related cellular mobilization by inhibiting JNK/Bnip3/SERCA/CaMKII pathways. Moreover, we establish the links between Hippo-Yap pathway, Bnip3-required mitophagy, SERCA-related calcium overload and cofilin-associated F-actin homeostasis with respect to cellular migration. Based on these findings, the strategies to regulate the balance of Hippo-Yap pathway and F-actin/lamellipodium could be a therapeutic target to HCC metastasis and recurrence in the clinical practice.
Authors contribution
CS, HZ and YC conceived the research; YHL, YL, NH, SM and SYH performed the experiments; QM and WHW analyzed the data; CS and HZ wrote the manuscript; all authors participated in discussing and revising the manuscript.
Disclosure
The authors have declared that they have no conflicts of interest.
Acknowledgements
This study was supported by grants from the Open Project funded by Key laboratory of Carcinogenesis and Translational Research, Ministry of Education/Beijing (2017 Open Project-9), National Natural Science Foundation of China (No. 81770237) and the science technological innovation nursery fund of People Liberation Army General Hospital (No. 16KMZ02). The funders had no role in the study design, data collection and analysis, decision to publish, or preparation of the manuscript.
Footnotes
Supplementary data associated with this article can be found in the online version at doi:10.1016/j.redox.2017.08.013.
Contributor Information
Weihu Wang, Email: wangweihufl@outlook.com.
Hao Zhou, Email: zhouhao301@outlook.com.
Appendix A. Supplementary material
Fig. S1.

A-B. Western blotting for Yap protein in HCC. Six randomly selected pairs of patients with HCC and matched surrounding tissues are presented. C. The change of Yap mRNA in HCC and surrounding tissues. *P < 0.05.
References
- 1.Gyawali B., Prasad V. Health policy: me-too drugs with limited benefits - the tale of regorafenib for HCC. Nat. Rev. Clin. Oncol. 2017 doi: 10.1038/nrclinonc.2017.100. [DOI] [PubMed] [Google Scholar]
- 2.Sia D., Villanueva A., Friedman S.L., Llovet J.M. Liver cancer cell of origin, molecular class, and effects on patient prognosis. Gastroenterology. 2017;152(4):745–761. doi: 10.1053/j.gastro.2016.11.048. [DOI] [PubMed] [Google Scholar]
- 3.Kansagara D., Papak J., Pasha A.S., O'neil M., Freeman M., Relevo R., Quinones A., Motu'apuaka M., Jou J.H. Screening for hepatocellular carcinoma in chronic liver disease: a systematic review. Ann. Intern. Med. 2014;161(4):261–269. doi: 10.7326/M14-0558. [DOI] [PubMed] [Google Scholar]
- 4.Bruix J., Gores G.J., Mazzaferro V. Hepatocellular carcinoma: clinical frontiers and perspectives. Gut. 2014;63(5):844–855. doi: 10.1136/gutjnl-2013-306627. [DOI] [PMC free article] [PubMed] [Google Scholar]
- 5.Rizvi S., Gores G.J. Pathogenesis, diagnosis, and management of cholangiocarcinoma. Gastroenterology. 2013;145(6):1215–1229. doi: 10.1053/j.gastro.2013.10.013. [DOI] [PMC free article] [PubMed] [Google Scholar]
- 6.Gregorieff A., Wrana J.L. Hippo signalling in intestinal regeneration and cancer. Curr. Opin. Cell Biol. 2017;48:17–25. doi: 10.1016/j.ceb.2017.04.005. [DOI] [PubMed] [Google Scholar]
- 7.Guo P.D., Lu X.X., Gan W.J., Li X.M., He X.S., Zhang S., Ji Q.H., Zhou F., Cao Y., Wang J.R., Li J.M., Wu H. RARgamma downregulation contributes to colorectal tumorigenesis and metastasis by derepressing the Hippo-Yap pathway. Cancer Res. 2016;76(13):3813–3825. doi: 10.1158/0008-5472.CAN-15-2882. [DOI] [PubMed] [Google Scholar]
- 8.Jiao S., Wang H., Shi Z., Dong A., Zhang W., Song X., He F., Wang Y., Zhang Z., Wang W., Wang X., Guo T., Li P., Zhao Y., Ji H., Zhang L., Zhou Z. A peptide mimicking VGLL4 function acts as a YAP antagonist therapy against gastric cancer. Cancer Cell. 2014;25(2):166–180. doi: 10.1016/j.ccr.2014.01.010. [DOI] [PubMed] [Google Scholar]
- 9.Kim H.B., Kim M., Park Y.S., Park I., Kim T., Yang S.Y., Cho C.J., Hwang D., Jung J.H., Markowitz S.D., Hwang S.W., Yang S.K., Lim D.S., Myung S.J. Prostaglandin E2 activates YAP and a positive-signaling loop to promote colon regeneration after colitis but also carcinogenesis in mice. Gastroenterology. 2017;152(3):616–630. doi: 10.1053/j.gastro.2016.11.005. [DOI] [PMC free article] [PubMed] [Google Scholar]
- 10.Gaspar P., Tapon N. Sensing the local environment: actin architecture and Hippo signalling. Curr. Opin. Cell Biol. 2014;31:74–83. doi: 10.1016/j.ceb.2014.09.003. [DOI] [PubMed] [Google Scholar]
- 11.Jacquemet G., Hamidi H., Ivaska J. Filopodia in cell adhesion, 3D migration and cancer cell invasion. Curr. Opin. Cell Biol. 2015;36:23–31. doi: 10.1016/j.ceb.2015.06.007. [DOI] [PubMed] [Google Scholar]
- 12.Gross S.R. Actin binding proteins: their ups and downs in metastatic life. Cell Adh Migr. 2013;7(2):199–213. doi: 10.4161/cam.23176. [DOI] [PMC free article] [PubMed] [Google Scholar]
- 13.Klopocka W., Korczynski J., Pomorski P. Cytoskeleton and nucleotide signaling in glioma C6 cells. Adv. Exp. Med. Biol. 2013;986:103–119. doi: 10.1007/978-94-007-4719-7_6. [DOI] [PubMed] [Google Scholar]
- 14.Shishkin S., Eremina L., Pashintseva N., Kovalev L., Kovaleva M. Cofilin-1 and other ADF/cofilin superfamily members in human malignant cells. Int. J. Mol. Sci. 2016;18(1) doi: 10.3390/ijms18010010. [DOI] [PMC free article] [PubMed] [Google Scholar]
- 15.Martin S.K., Kamelgarn M., Kyprianou N. Cytoskeleton targeting value in prostate cancer treatment. Am. J. Clin. Exp. Urol. 2014;2(1):15–26. [PMC free article] [PubMed] [Google Scholar]
- 16.Doskey C.M., Buranasudja V., Wagner B.A., Wilkes J.G., Du J., Cullen J.J., Buettner G.R. Tumor cells have decreased ability to metabolize H2O2: implications for pharmacological ascorbate in cancer therapy. Redox Biol. 2016;10:274–284. doi: 10.1016/j.redox.2016.10.010. [DOI] [PMC free article] [PubMed] [Google Scholar]
- 17.Senft D., Ronai Z.A. Regulators of mitochondrial dynamics in cancer. Curr. Opin. Cell Biol. 2016;39:43–52. doi: 10.1016/j.ceb.2016.02.001. [DOI] [PMC free article] [PubMed] [Google Scholar]
- 18.Ni H.M., Williams J.A., Ding W.X. Mitochondrial dynamics and mitochondrial quality control. Redox Biol. 2015;4:6–13. doi: 10.1016/j.redox.2014.11.006. [DOI] [PMC free article] [PubMed] [Google Scholar]
- 19.Zhou H., Zhu P., Guo J., Hu N., Wang S., Li D., Hu S., Ren J., Cao F., Chen Y. Ripk3 induces mitochondrial apoptosis via inhibition of FUNDC1 mitophagy in cardiac IR injury. Redox Biol. 2017;13:498–507. doi: 10.1016/j.redox.2017.07.007. [DOI] [PMC free article] [PubMed] [Google Scholar]
- 20.Bereiter-Hahn J., Voth M., Mai S., Jendrach M. Structural implications of mitochondrial dynamics. Biotechnol. J. 2008;3(6):765–780. doi: 10.1002/biot.200800024. [DOI] [PubMed] [Google Scholar]
- 21.Gourlay C.W., Ayscough K.R. A role for actin in aging and apoptosis. Biochem. Soc. Trans. 2005;33(Pt 6):1260–1264. doi: 10.1042/BST0331260. [DOI] [PubMed] [Google Scholar]
- 22.Nakamura M., Zhai P., Del Re D.P., Maejima Y., Sadoshima J. Mst1-mediated phosphorylation of Bcl-xL is required for myocardial reperfusion injury. JCI Insight. 2016;1(5) doi: 10.1172/jci.insight.86217. [DOI] [PMC free article] [PubMed] [Google Scholar]
- 23.Deng Q., Guo T., Zhou X., Xi Y., Yang X., Ge W. Cross-Talk between mitochondrial fusion and the hippo pathway in controlling cell proliferation during drosophila development. Genetics. 2016;203(4):1777–1788. doi: 10.1534/genetics.115.186445. [DOI] [PMC free article] [PubMed] [Google Scholar]
- 24.Wei W.C., Huang W.C., Lin Y.P., Becker E.B.E., Ansorge O., Flockerzi V., Conti D., Cenacchi G., Glitsch M.D. Functional expression of calcium-permeable canonical transient receptor potential 4-containing channels promotes migration of medulloblastoma cells. J. Physiol. 2017 doi: 10.1113/JP274659. [DOI] [PMC free article] [PubMed] [Google Scholar]
- 25.Bell J.R., Erickson J.R., Delbridge L.M. Ca(2+) /calmodulin dependent kinase II: a critical mediator in determining reperfusion outcomes in the heart? Clin. Exp. Pharmacol. Physiol. 2014;41(11):940–946. doi: 10.1111/1440-1681.12301. [DOI] [PubMed] [Google Scholar]
- 26.Saito A., Miyajima K., Akatsuka J., Kondo H., Mashiko T., Kiuchi T., Ohashi K., Mizuno K. CaMKIIbeta-mediated LIM-kinase activation plays a crucial role in BDNF-induced neuritogenesis. Genes Cells. 2013;18(7):533–543. doi: 10.1111/gtc.12054. [DOI] [PubMed] [Google Scholar]
- 27.Zhang Y., Zhou H., Wu W., Shi C., Hu S., Yin T., Ma Q., Han T., Zhang Y., Tian F., Chen Y. Liraglutide protects cardiac microvascular endothelial cells against hypoxia/reoxygenation injury through the suppression of the SR-Ca(2+)-XO-ROS axis via activation of the GLP-1R/PI3K/Akt/survivin pathways. Free Radic. Biol. Med. 2016;95:278–292. doi: 10.1016/j.freeradbiomed.2016.03.035. [DOI] [PubMed] [Google Scholar]
- 28.San-Miguel B., Crespo I., Sanchez D.I., Gonzalez-Fernandez B., Ortiz De Urbina J.J., Tunon M.J., Gonzalez-Gallego J. Melatonin inhibits autophagy and endoplasmic reticulum stress in mice with carbon tetrachloride-induced fibrosis. J. Pineal Res. 2015;59(2):151–162. doi: 10.1111/jpi.12247. [DOI] [PubMed] [Google Scholar]
- 29.Zhou H., Yang J., Xin T., Zhang T., Hu S., Zhou S., Chen G., Chen Y. Exendin-4 enhances the migration of adipose-derived stem cells to neonatal rat ventricular cardiomyocyte-derived conditioned medium via the phosphoinositide 3-kinase/Akt-stromal cell-derived factor-1alpha/CXC chemokine receptor 4 pathway. Mol. Med. Rep. 2015;11(6):4063–4072. doi: 10.3892/mmr.2015.3243. [DOI] [PMC free article] [PubMed] [Google Scholar]
- 30.Zhou H., Zhang Y., Hu S., Shi C., Zhu P., Ma Q., Jin Q., Cao F., Tian F., Chen Y. Melatonin protects cardiac microvasculature against ischemia/reperfusion injury via suppression of mitochondrial fission-VDAC1-HK2-mPTP-mitophagy axis. J. Pineal Res. 2017;63(1) doi: 10.1111/jpi.12413. [DOI] [PMC free article] [PubMed] [Google Scholar]
- 31.Quintana C., Cabrera J., Perdomo J., Estevez F., Loro J.F., Reiter R.J., Quintana J. Melatonin enhances hyperthermia-induced apoptotic cell death in human leukemia cells. J. Pineal Res. 2016;61(3):381–395. doi: 10.1111/jpi.12356. [DOI] [PubMed] [Google Scholar]
- 32.Zhu H., Jin Q., Li Y., Ma Q., Wang J., Li D., Zhou H., Chen Y. Melatonin protected cardiac microvascular endothelial cells against oxidative stress injury via suppression of IP3R-[Ca2+]c/VDAC-[Ca2+]m axis by activation of MAPK/ERK signaling pathway. Cell Stress Chaperones. 2017 doi: 10.1007/s12192-017-0827-4. [DOI] [PMC free article] [PubMed] [Google Scholar]
- 33.Zhou H., Hu S., Jin Q., Shi C., Zhang Y., Zhu P., Ma Q., Tian F., Chen Y. Mff-Dependent mitochondrial fission contributes to the pathogenesis of cardiac microvasculature ischemia/reperfusion injury via induction of mROS-mediated cardiolipin oxidation and HK2/VDAC1 disassociation-Involved mPTP opening. J. Am. Heart Assoc. 2017;6(3) doi: 10.1161/JAHA.116.005328. [DOI] [PMC free article] [PubMed] [Google Scholar]
- 34.Zhou H., Li D., Shi C., Xin T., Yang J., Zhou Y., Hu S., Tian F., Wang J., Chen Y. Effects of Exendin-4 on bone marrow mesenchymal stem cell proliferation, migration and apoptosis in vitro. Sci. Rep. 2015;5:12898. doi: 10.1038/srep12898. [DOI] [PMC free article] [PubMed] [Google Scholar]
- 35.Lin Y.W., Lee L.M., Lee W.J., Chu C.Y., Tan P., Yang Y.C., Chen W.Y., Yang S.F., Hsiao M., Chien M.H. Melatonin inhibits MMP-9 transactivation and renal cell carcinoma metastasis by suppressing Akt-MAPKs pathway and NF-kappaB DNA-binding activity. J. Pineal Res. 2016;60(3):277–290. doi: 10.1111/jpi.12308. [DOI] [PubMed] [Google Scholar]
- 36.Mao L., Dauchy R.T., Blask D.E., Dauchy E.M., Slakey L.M., Brimer S., Yuan L., Xiang S., Hauch A., Smith K., Frasch T., Belancio V.P., Wren M.A., Hill S.M. Melatonin suppression of aerobic glycolysis (Warburg effect), survival signalling and metastasis in human leiomyosarcoma. J. Pineal Res. 2016;60(2):167–177. doi: 10.1111/jpi.12298. [DOI] [PubMed] [Google Scholar]
- 37.Pariente R., Pariente J.A., Rodriguez A.B., Espino J. Melatonin sensitizes human cervical cancer HeLa cells to cisplatin-induced cytotoxicity and apoptosis: effects on oxidative stress and DNA fragmentation. J. Pineal Res. 2016;60(1):55–64. doi: 10.1111/jpi.12288. [DOI] [PubMed] [Google Scholar]
- 38.Zhou H., Yang J., Xin T., Li D., Guo J., Hu S., Zhou S., Zhang T., Zhang Y., Han T., Chen Y. Exendin-4 protects adipose-derived mesenchymal stem cells from apoptosis induced by hydrogen peroxide through the PI3K/Akt-Sfrp2 pathways. Free Radic. Biol. Med. 2014;77:363–375. doi: 10.1016/j.freeradbiomed.2014.09.033. [DOI] [PubMed] [Google Scholar]
- 39.He B., Zhao Y., Xu L., Gao L., Su Y., Lin N., Pu J. The nuclear melatonin receptor RORalpha is a novel endogenous defender against myocardial ischemia/reperfusion injury. J. Pineal Res. 2016;60(3):313–326. doi: 10.1111/jpi.12312. [DOI] [PubMed] [Google Scholar]
- 40.Xu S., Pi H., Zhang L., Zhang N., Li Y., Zhang H., Tang J., Li H., Feng M., Deng P., Guo P., Tian L., Xie J., He M., Lu Y., Zhong M., Zhang Y., Wang W., Reiter R.J., Yu Z., Zhou Z. Melatonin prevents abnormal mitochondrial dynamics resulting from the neurotoxicity of cadmium by blocking calcium-dependent translocation of Drp1 to the mitochondria. J. Pineal Res. 2016;60(3):291–302. doi: 10.1111/jpi.12310. [DOI] [PubMed] [Google Scholar]
- 41.Ma W., Wang Y., Yao X., Xu Z., An L., Yin M. The role of Exo70 in vascular smooth muscle cell migration. Cell Mol. Biol. Lett. 2016;21:20. doi: 10.1186/s11658-016-0019-8. [DOI] [PMC free article] [PubMed] [Google Scholar]
- 42.Peterson T.S., Thebeau C.N., Ajit D., Camden J.M., Woods L.T., Wood W.G., Petris M.J., Sun G.Y., Erb L., Weisman G.A. Up-regulation and activation of the P2Y(2) nucleotide receptor mediate neurite extension in IL-1beta-treated mouse primary cortical neurons. J. Neurochem. 2013;125(6):885–896. doi: 10.1111/jnc.12252. [DOI] [PMC free article] [PubMed] [Google Scholar]
- 43.Du K., Ramachandran A., Jaeschke H. Oxidative stress during acetaminophen hepatotoxicity: sources, pathophysiological role and therapeutic potential. Redox Biol. 2016;10:148–156. doi: 10.1016/j.redox.2016.10.001. [DOI] [PMC free article] [PubMed] [Google Scholar]
- 44.Smith M.R., Vayalil P.K., Zhou F., Benavides G.A., Beggs R.R., Golzarian H., Nijampatnam B., Oliver P.G., Smith R.A., Murphy M.P., Velu S.E., Landar A. Mitochondrial thiol modification by a targeted electrophile inhibits metabolism in breast adenocarcinoma cells by inhibiting enzyme activity and protein levels. Redox Biol. 2016;8:136–148. doi: 10.1016/j.redox.2016.01.002. [DOI] [PMC free article] [PubMed] [Google Scholar]
- 45.Prieto-Dominguez N., Ordonez R., Fernandez A., Mendez-Blanco C., Baulies A., Garcia-Ruiz C., Fernandez-Checa J.C., Mauriz J.L., Gonzalez-Gallego J. Melatonin-induced increase in sensitivity of human hepatocellular carcinoma cells to sorafenib is associated with reactive oxygen species production and mitophagy. J. Pineal Res. 2016;61(3):396–407. doi: 10.1111/jpi.12358. [DOI] [PMC free article] [PubMed] [Google Scholar]
- 46.Manu K.A., Chai T.F., Teh J.T., Zhu W.L., Casey P.J., Wang M. Inhibition of isoprenylcysteine carboxylmethyltransferase induces cell-cycle arrest and apoptosis through p21 and p21-regulated BNIP3 induction in pancreatic cancer. Mol. Cancer Ther. 2017;16(5):914–923. doi: 10.1158/1535-7163.MCT-16-0703. [DOI] [PubMed] [Google Scholar]
- 47.Kalyanaraman B. Teaching the basics of cancer metabolism: developing antitumor strategies by exploiting the differences between normal and cancer cell metabolism. Redox Biol. 2017;12:833–842. doi: 10.1016/j.redox.2017.04.018. [DOI] [PMC free article] [PubMed] [Google Scholar]
- 48.Heppner D.E., Van Der Vliet A. Redox-dependent regulation of epidermal growth factor receptor signaling. Redox Biol. 2016;8:24–27. doi: 10.1016/j.redox.2015.12.002. [DOI] [PMC free article] [PubMed] [Google Scholar]
- 49.Watson W.H., Ritzenthaler J.D., Roman J. Lung extracellular matrix and redox regulation. Redox Biol. 2016;8:305–315. doi: 10.1016/j.redox.2016.02.005. [DOI] [PMC free article] [PubMed] [Google Scholar]
- 50.Bhatia M., Mcgrath K.L., Di Trapani G., Charoentong P., Shah F., King M.M., Clarke F.M., Tonissen K.F. The thioredoxin system in breast cancer cell invasion and migration. Redox Biol. 2016;8:68–78. doi: 10.1016/j.redox.2015.12.004. [DOI] [PMC free article] [PubMed] [Google Scholar]
- 51.Han J., Weisbrod R.M., Shao D., Watanabe Y., Yin X., Bachschmid M.M., Seta F., Janssen-Heininger Y.M., Matsui R., Zang M., Hamburg N.M., Cohen R.A. The redox mechanism for vascular barrier dysfunction associated with metabolic disorders: glutathionylation of Rac1 in endothelial cells. Redox Biol. 2016;9:306–319. doi: 10.1016/j.redox.2016.09.003. [DOI] [PMC free article] [PubMed] [Google Scholar]
- 52.Schiapparelli P., Guerrero-Cazares H., Magana-Maldonado R., Hamilla S.M., Ganaha S., Goulin Lippi Fernandes E., Huang C.H., Aranda-Espinoza H., Devreotes P., Quinones-Hinojosa A. NKCC1 regulates migration ability of glioblastoma cells by modulation of actin dynamics and interacting with cofilin. EBioMedicine. 2017;21:94–103. doi: 10.1016/j.ebiom.2017.06.020. [DOI] [PMC free article] [PubMed] [Google Scholar]
- 53.De Souza P., Guarido K.L., Scheschowitsch K., Da Silva L.M., Werner M.F., Assreuy J., Da Silva-Santos J.E. Impaired vascular function in sepsis-surviving rats mediated by oxidative stress and Rho-Kinase pathway. Redox Biol. 2016;10:140–147. doi: 10.1016/j.redox.2016.09.016. [DOI] [PMC free article] [PubMed] [Google Scholar]
- 54.Ho H.Y., Lin C.W., Chien M.H., Reiter R.J., Su S.C., Hsieh Y.H., Yang S.F. Melatonin suppresses TPA-induced metastasis by downregulating matrix metalloproteinase-9 expression through JNK/SP-1 signaling in nasopharyngeal carcinoma. J. Pineal Res. 2016;61(4):479–492. doi: 10.1111/jpi.12365. [DOI] [PubMed] [Google Scholar]
- 55.Steinhardt A.A., Gayyed M.F., Klein A.P., Dong J., Maitra A., Pan D., Montgomery E.A., Anders R.A. Expression of Yes-associated protein in common solid tumors. Hum. Pathol. 2008;39(11):1582–1589. doi: 10.1016/j.humpath.2008.04.012. [DOI] [PMC free article] [PubMed] [Google Scholar]
- 56.Zender L., Spector M.S., Xue W., Flemming P., Cordon-Cardo C., Silke J., Fan S.T., Luk J.M., Wigler M., Hannon G.J., Mu D., Lucito R., Powers S., Lowe S.W. Identification and validation of oncogenes in liver cancer using an integrative oncogenomic approach. Cell. 2006;125(7):1253–1267. doi: 10.1016/j.cell.2006.05.030. [DOI] [PMC free article] [PubMed] [Google Scholar]
- 57.Zhao B., Wei X., Li W., Udan R.S., Yang Q., Kim J., Xie J., Ikenoue T., Yu J., Li L., Zheng P., Ye K., Chinnaiyan A., Halder G., Lai Z.C., Guan K.L. Inactivation of YAP oncoprotein by the Hippo pathway is involved in cell contact inhibition and tissue growth control. Genes Dev. 2007;21(21):2747–2761. doi: 10.1101/gad.1602907. [DOI] [PMC free article] [PubMed] [Google Scholar]
- 58.Xu M.Z., Yao T.J., Lee N.P., Ng I.O., Chan Y.T., Zender L., Lowe S.W., Poon R.T., Luk J.M. Yes-associated protein is an independent prognostic marker in hepatocellular carcinoma. Cancer. 2009;115(19):4576–4585. doi: 10.1002/cncr.24495. [DOI] [PMC free article] [PubMed] [Google Scholar]
- 59.Zhao J.W., Gao Z.L., Ji Q.Y., Wang H., Zhang H.Y., Yang Y.D., Xing F.J., Meng L.J., Wang Y. Regulation of cofilin activity by CaMKII and calcineurin. Am. J. Med Sci. 2012;344(6):462–472. doi: 10.1097/MAJ.0b013e318244745b. [DOI] [PubMed] [Google Scholar]
- 60.Wang L., Zhang S., Cheng H., Lv H., Cheng G., Ci X. Nrf2-mediated liver protection by esculentoside A against acetaminophen toxicity through the AMPK/Akt/GSK3beta pathway. Free Radic. Biol. Med. 2016;101:401–412. doi: 10.1016/j.freeradbiomed.2016.11.009. [DOI] [PubMed] [Google Scholar]
- 61.Kitsati N., Mantzaris M.D., Galaris D. Hydroxytyrosol inhibits hydrogen peroxide-induced apoptotic signaling via labile iron chelation. Redox Biol. 2016;10:233–242. doi: 10.1016/j.redox.2016.10.006. [DOI] [PMC free article] [PubMed] [Google Scholar]
- 62.Fuhrmann D.C., Brune B. Mitochondrial composition and function under the control of hypoxia. Redox Biol. 2017;12:208–215. doi: 10.1016/j.redox.2017.02.012. [DOI] [PMC free article] [PubMed] [Google Scholar]
- 63.Kang J.W., Hong J.M., Lee S.M. Melatonin enhances mitophagy and mitochondrial biogenesis in rats with carbon tetrachloride-induced liver fibrosis. J. Pineal Res. 2016;60(4):383–393. doi: 10.1111/jpi.12319. [DOI] [PubMed] [Google Scholar]
- 64.Hu S.Y., Zhang Y., Zhu P.J., Zhou H., Chen Y.D. Liraglutide directly protects cardiomyocytes against reperfusion injury possibly via modulation of intracellular calcium homeostasis. J. Geriatr. Cardiol. 2017;14(1):57–66. doi: 10.11909/j.issn.1671-5411.2017.01.008. [DOI] [PMC free article] [PubMed] [Google Scholar]
- 65.Ostrowska Z., Moraczewska J. Cofilin - a protein controlling dynamics of actin filaments. Post. Hig. Med. Dosw (Online) 2017;71(0):339–351. doi: 10.5604/01.3001.0010.3818. [DOI] [PubMed] [Google Scholar]
- 66.Christensen J.R., Hocky G.M., Homa K.E., Morganthaler A.N., Hitchcock-Degregori S.E., Voth G.A., Kovar D.R. Competition between Tropomyosin, Fimbrin, and ADF/cofilin drives their sorting to distinct actin filament networks. Elife. 2017;6 doi: 10.7554/eLife.23152. [DOI] [PMC free article] [PubMed] [Google Scholar]